
“National debt” gets brought up constantly in political debates, usually as a warning sign or a way to criticize whoever happens to be in charge. In simple terms, it refers to the total amount of money the federal government owes after years of borrowing to cover spending that exceeds revenue. Those creditors can include American investors, financial institutions, government trust funds, foreign governments, and other buyers of U.S. Treasury securities.
Debt is often treated like a dirty word, but national debt is not automatically a sign of collapse. Most modern governments carry debt, and borrowing can help fund wars, infrastructure, emergency relief, social programs, and economic stimulus during downturns. The problem is not simply that debt exists, but how quickly it grows, what caused it to grow, and whether the country can manage the cost of servicing it.
In the United States, debt has risen under presidents from both parties for many different reasons. Recessions, tax cuts, wars, pandemics, entitlement spending, interest costs, and changing economic conditions have all played a role. This article looks at how much was added to the national debt under different U.S. presidents and which administrations saw the largest increases.
Why It Matters
With higher national debts come high borrowing costs. This means that a lot of money is going towards interest payments instead of important funding that benefits the public, such as research, education, and infrastructure. The higher national debt also means that the government is more limited in what they’re able to do in times of crises and must resort to cutting back on social safety net programs to make ends meet. The budget is the chief responsibility of Congress and the President, and people need to understand what some presidents have done with this budget.
21. Calvin Coolidge (in office from 1923–1929)

- Avg. annual change in national debt, fiscal 1923-1929: -4.5% (-$903.1 million)
- Total change in national debt, fiscal 1923-1929: -24.2% (-$5.4 billion)
- National debt at the end of fiscal 1929: $16.9 billion
- National debt at the end of fiscal 1923: $22.3 billion
- Party affiliation: Republican
20. Warren G. Harding (in office from 1921–1923)
- Avg. annual change in national debt, fiscal 1921-1923: -3.5% (-$813.9 million)
- Total change in national debt, fiscal 1921-1923: -6.8% (-$1.6 billion)
- National debt at the end of fiscal 1923: $22.3 billion
- National debt at the end of fiscal 1921: $24.0 billion
- Party affiliation: Republican
19. Harry S. Truman (in office from 1945–1953)
- Avg. annual change in national debt, fiscal 1945-1953: +0.4% (+$923.6 million)
- Total change in national debt, fiscal 1945-1953: +2.9% (+$7.4 billion)
- National debt at the end of fiscal 1953: $266.1 billion
- National debt at the end of fiscal 1945: $258.7 billion
- Party affiliation: Democratic
18. Dwight D. Eisenhower (in office from 1953–1961)
- Avg. annual change in national debt, fiscal 1953-1961: +1.0% (+$2.9 billion)
- Total change in national debt, fiscal 1953-1961: +8.6% (+$22.9 billion)
- National debt at the end of fiscal 1961: $289.0 billion
- National debt at the end of fiscal 1953: $266.1 billion
- Party affiliation: Republican
17. Lyndon B. Johnson (in office from 1963–1969)
- Avg. annual change in national debt, fiscal 1963-1969: +2.5% (+$8.0 billion)
- Total change in national debt, fiscal 1963-1969: +15.6% (+$47.9 billion)
- National debt at the end of fiscal 1969: $353.7 billion
- National debt at the end of fiscal 1963: $305.9 billion
- Party affiliation: Democratic
16. William Howard Taft (in office from 1909–1913)
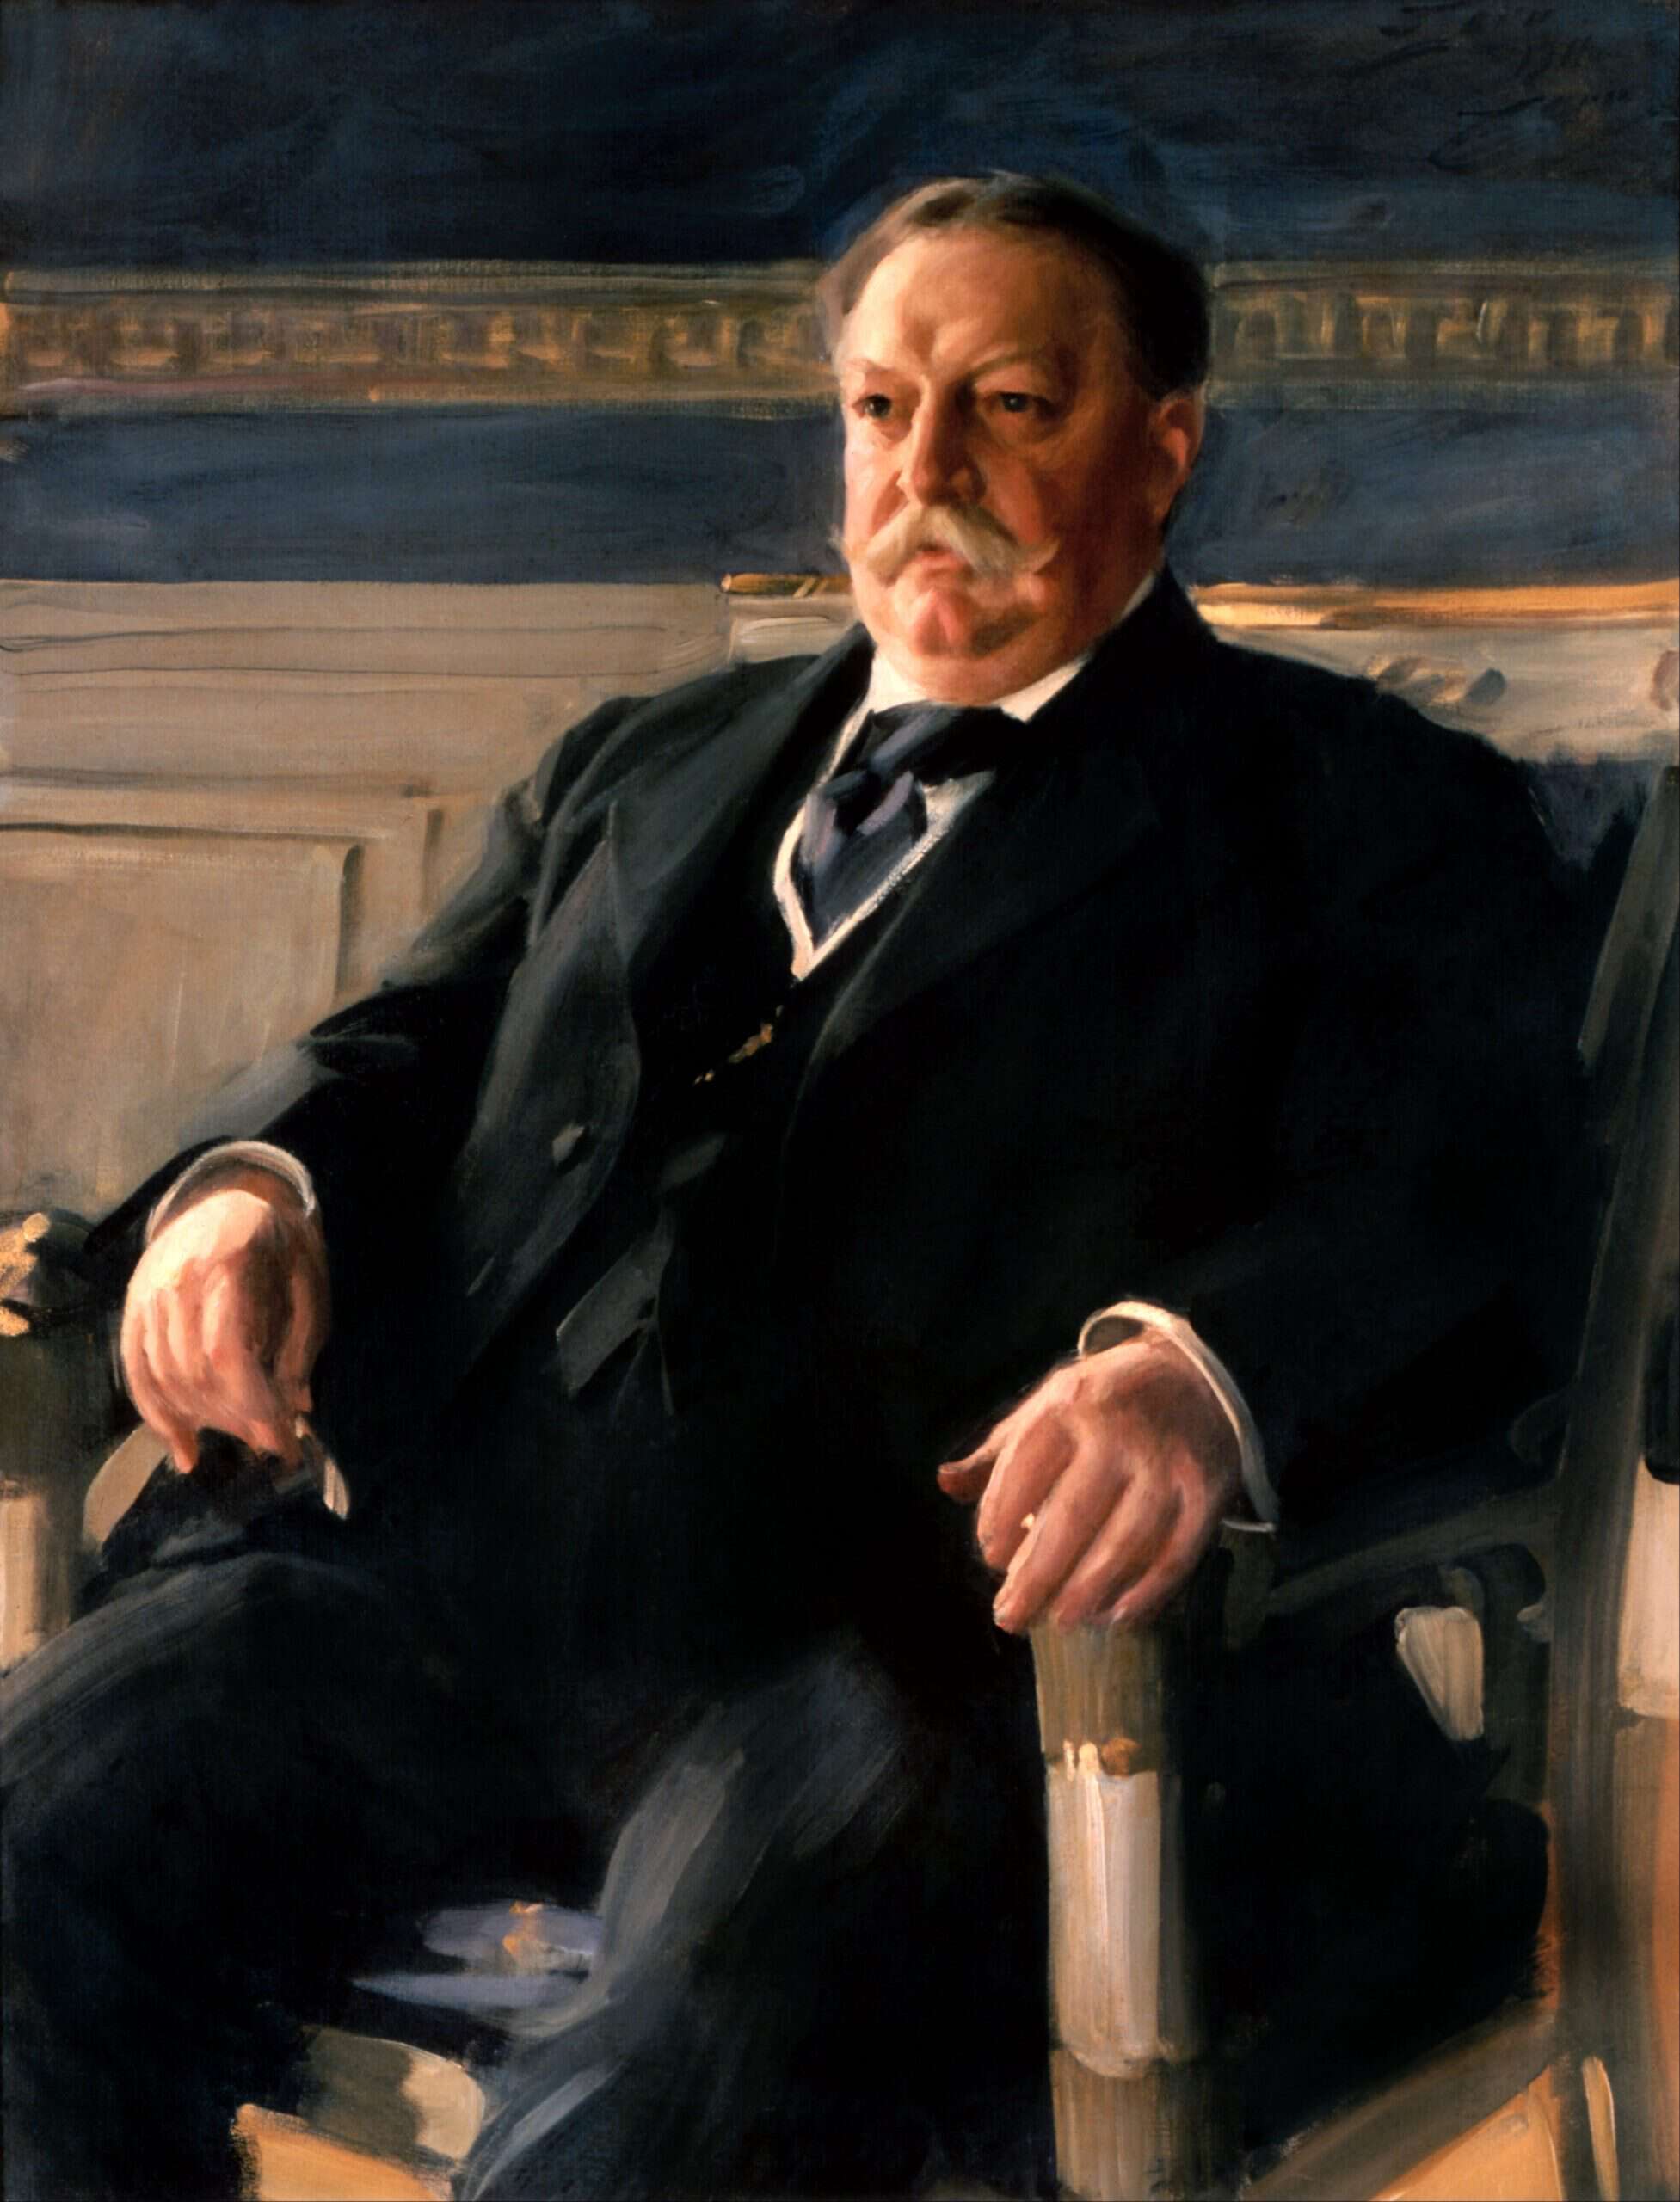
- Avg. annual change in national debt, fiscal 1909-1913: +2.5% (+$69.2 million)
- Total change in national debt, fiscal 1909-1913: +10.5% (+$276.7 million)
- National debt at the end of fiscal 1913: $2.9 billion
- National debt at the end of fiscal 1909: $2.6 billion
- Party affiliation: Republican
15. Theodore Roosevelt (in office from 1901–1909)

- Avg. annual change in national debt, fiscal 1901-1909: +2.6% (+$62.0 million)
- Total change in national debt, fiscal 1901-1909: +23.2% (+$496.2 million)
- National debt at the end of fiscal 1909: $2.6 billion
- National debt at the end of fiscal 1901: $2.1 billion
- Party affiliation: Republican
14. John F. Kennedy (in office from 1961–1963)

- Avg. annual change in national debt, fiscal 1961-1963: +2.9% (+$8.4 billion)
- Total change in national debt, fiscal 1961-1963: +5.8% (+$16.9 billion)
- National debt at the end of fiscal 1963: $305.9 billion
- National debt at the end of fiscal 1961: $289.0 billion
- Party affiliation: Democratic
13. William J. Clinton (in office from 1993–2001)

- Avg. annual change in national debt, fiscal 1993-2001: +3.5% (+$174.5 billion)
- Total change in national debt, fiscal 1993-2001: +31.6% (+$1.4 trillion)
- National debt at the end of fiscal 2001: $5.8 trillion
- National debt at the end of fiscal 1993: $4.4 trillion
- Party affiliation: Democratic
12. Richard M. Nixon (in office from 1969–1974)
- Avg. annual change in national debt, fiscal 1969-1974: +6.1% (+$24.3 billion)
- Total change in national debt, fiscal 1969-1974: +34.3% (+$121.3 billion)
- National debt at the end of fiscal 1974: $475.1 billion
- National debt at the end of fiscal 1969: $353.7 billion
- Party affiliation: Republican
11. Barack Obama (in office from 2009–2017)
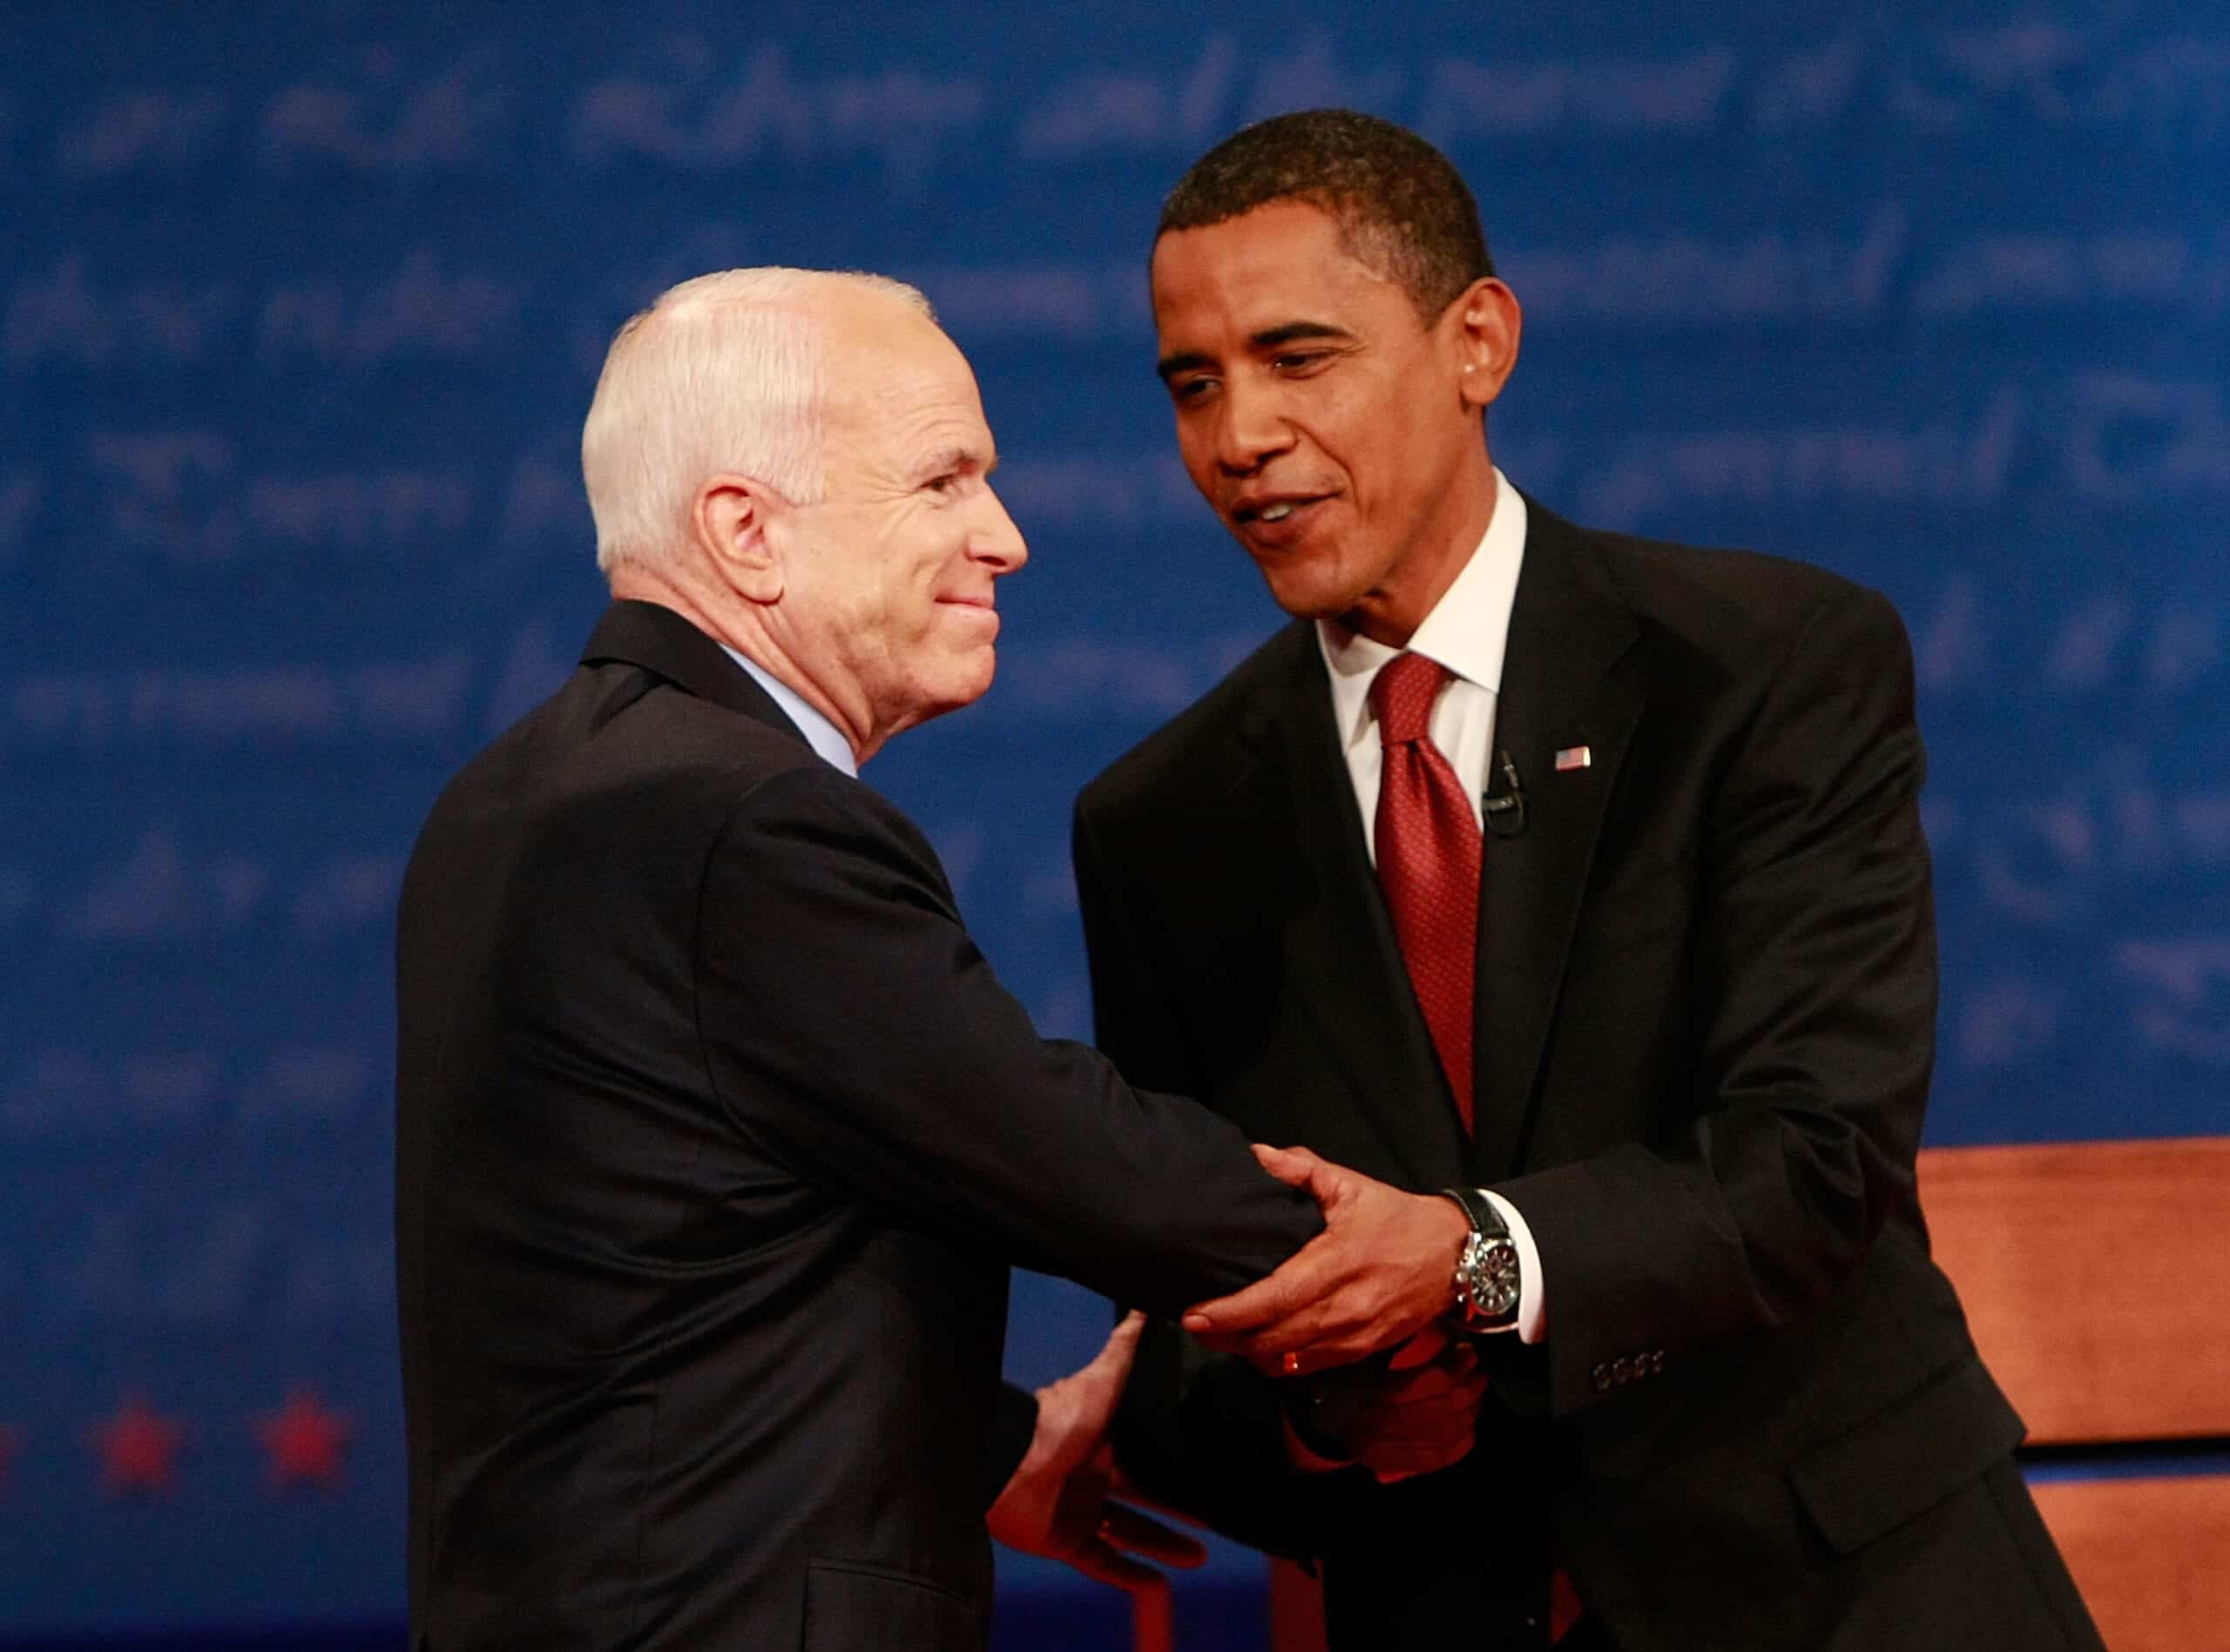
- Avg. annual change in national debt, fiscal 2009-2017: +6.9% (+$1.0 trillion)
- Total change in national debt, fiscal 2009-2017: +70.0% (+$8.3 trillion)
- National debt at the end of fiscal 2017: $20.2 trillion
- National debt at the end of fiscal 2009: $11.9 trillion
- Party affiliation: Democratic
10. Herbert Hoover (in office from 1929–1933)
- Avg. annual change in national debt, fiscal 1929-1933: +7.4% (+$1.4 billion)
- Total change in national debt, fiscal 1929-1933: +33.1% (+$5.6 billion)
- National debt at the end of fiscal 1933: $22.5 billion
- National debt at the end of fiscal 1929: $16.9 billion
- Party affiliation: Republican
9. Joseph R. Biden Jr. (in office from 2021–2025)
- Avg. annual change in national debt, fiscal 2021-2023: +8.0% (+$2.4 trillion)
- Total change in national debt, fiscal 2021-2025: +16.7% (+$4.7 trillion)
- National debt at the end Biden’s term: $36.2 trillion
- Party affiliation: Democratic
8. Donald J. Trump (in office from 2017–2021)

- Avg. annual change in national debt, fiscal 2017-2021: +8.9% (+$2.0 trillion)
- Total change in national debt, fiscal 2017-2021: +40.4% (+$8.2 trillion)
- National debt at the end of fiscal 2021: $28.4 trillion
- National debt at the end of fiscal 2017: $20.2 trillion
- Party affiliation: Republican
7. Jimmy Carter (in office from 1977–1981)
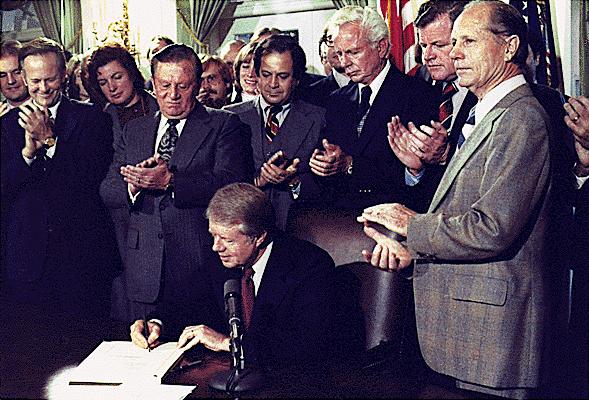
- Avg. annual change in national debt, fiscal 1977-1981: +9.3% (+$74.8 billion)
- Total change in national debt, fiscal 1977-1981: +42.8% (+$299.0 billion)
- National debt at the end of fiscal 1981: $997.9 billion
- National debt at the end of fiscal 1977: $698.8 billion
- Party affiliation: Democratic
6. George W. Bush (in office from 2001–2009)
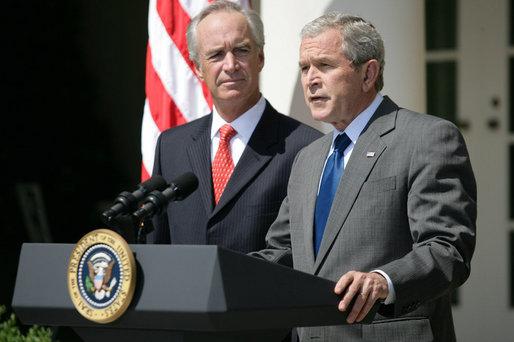
- Avg. annual change in national debt, fiscal 2001-2009: +9.4% (+$762.8 billion)
- Total change in national debt, fiscal 2001-2009: +105.1% (+$6.1 trillion)
- National debt at the end of fiscal 2009: $11.9 trillion
- National debt at the end of fiscal 2001: $5.8 trillion
- Party affiliation: Republican
5. George H.W. Bush (in office from 1989–1993)
- Avg. annual change in national debt, fiscal 1989-1993: +11.5% (+$388.5 billion)
- Total change in national debt, fiscal 1989-1993: +54.4% (+$1.6 trillion)
- National debt at the end of fiscal 1993: $4.4 trillion
- National debt at the end of fiscal 1989: $2.9 trillion
- Party affiliation: Republican
4. Gerald R. Ford (in office from 1974–1977)
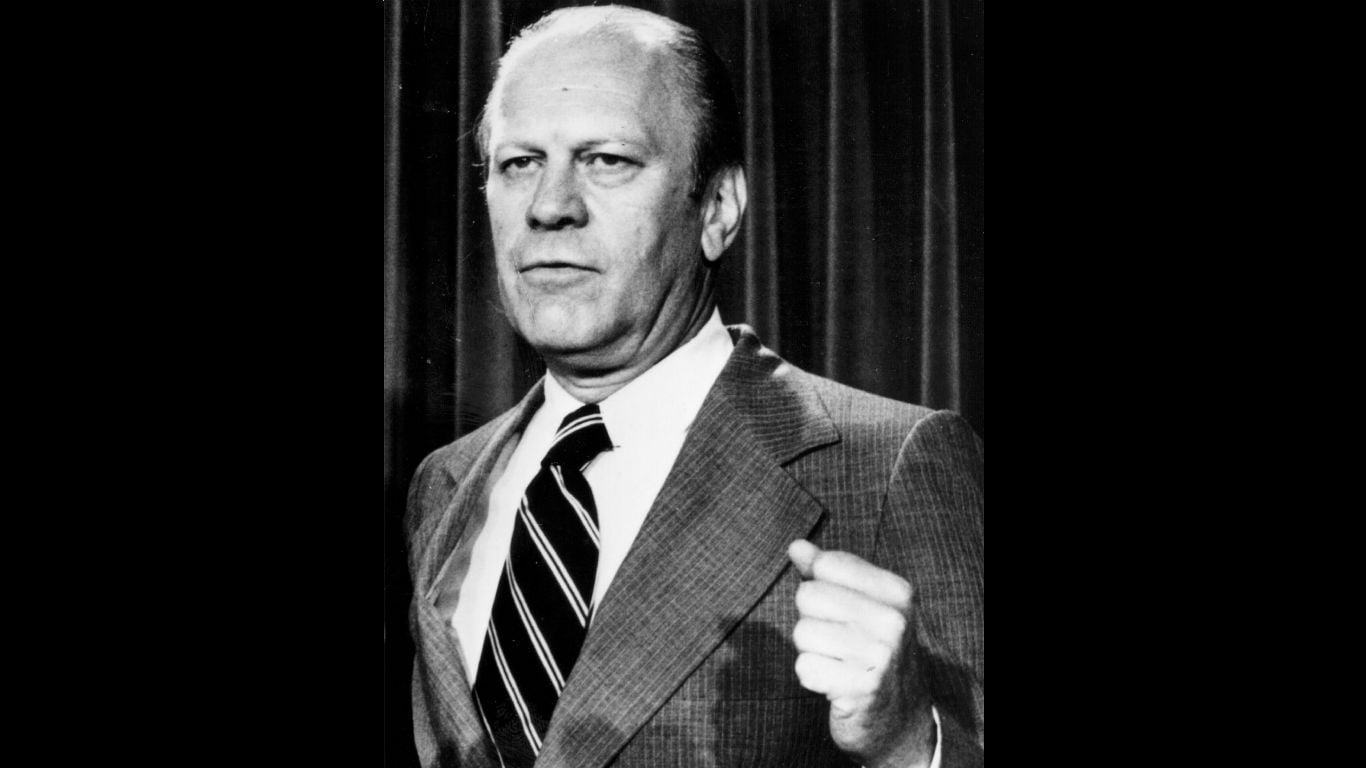
- Avg. annual change in national debt, fiscal 1974-1977: +13.7% (+$74.6 billion)
- Total change in national debt, fiscal 1974-1977: +47.1% (+$223.8 billion)
- National debt at the end of fiscal 1977: $698.8 billion
- National debt at the end of fiscal 1974: $475.1 billion
- Party affiliation: Republican
3. Ronald Reagan (in office from 1981–1989)
- Avg. annual change in national debt, fiscal 1981-1989: +14.1% (+$232.4 billion)
- Total change in national debt, fiscal 1981-1989: +186.4% (+$1.9 trillion)
- National debt at the end of fiscal 1989: $2.9 trillion
- National debt at the end of fiscal 1981: $997.9 billion
- Party affiliation: Republican
2. Franklin D. Roosevelt (in office from 1933–1945)
- Avg. annual change in national debt, fiscal 1933-1945: +22.6% (+$19.7 billion)
- Total change in national debt, fiscal 1933-1945: +1,047.7% (+$236.1 billion)
- National debt at the end of fiscal 1945: $258.7 billion
- National debt at the end of fiscal 1933: $22.5 billion
- Party affiliation: Democratic
1. Woodrow Wilson (in office from 1913–1921)
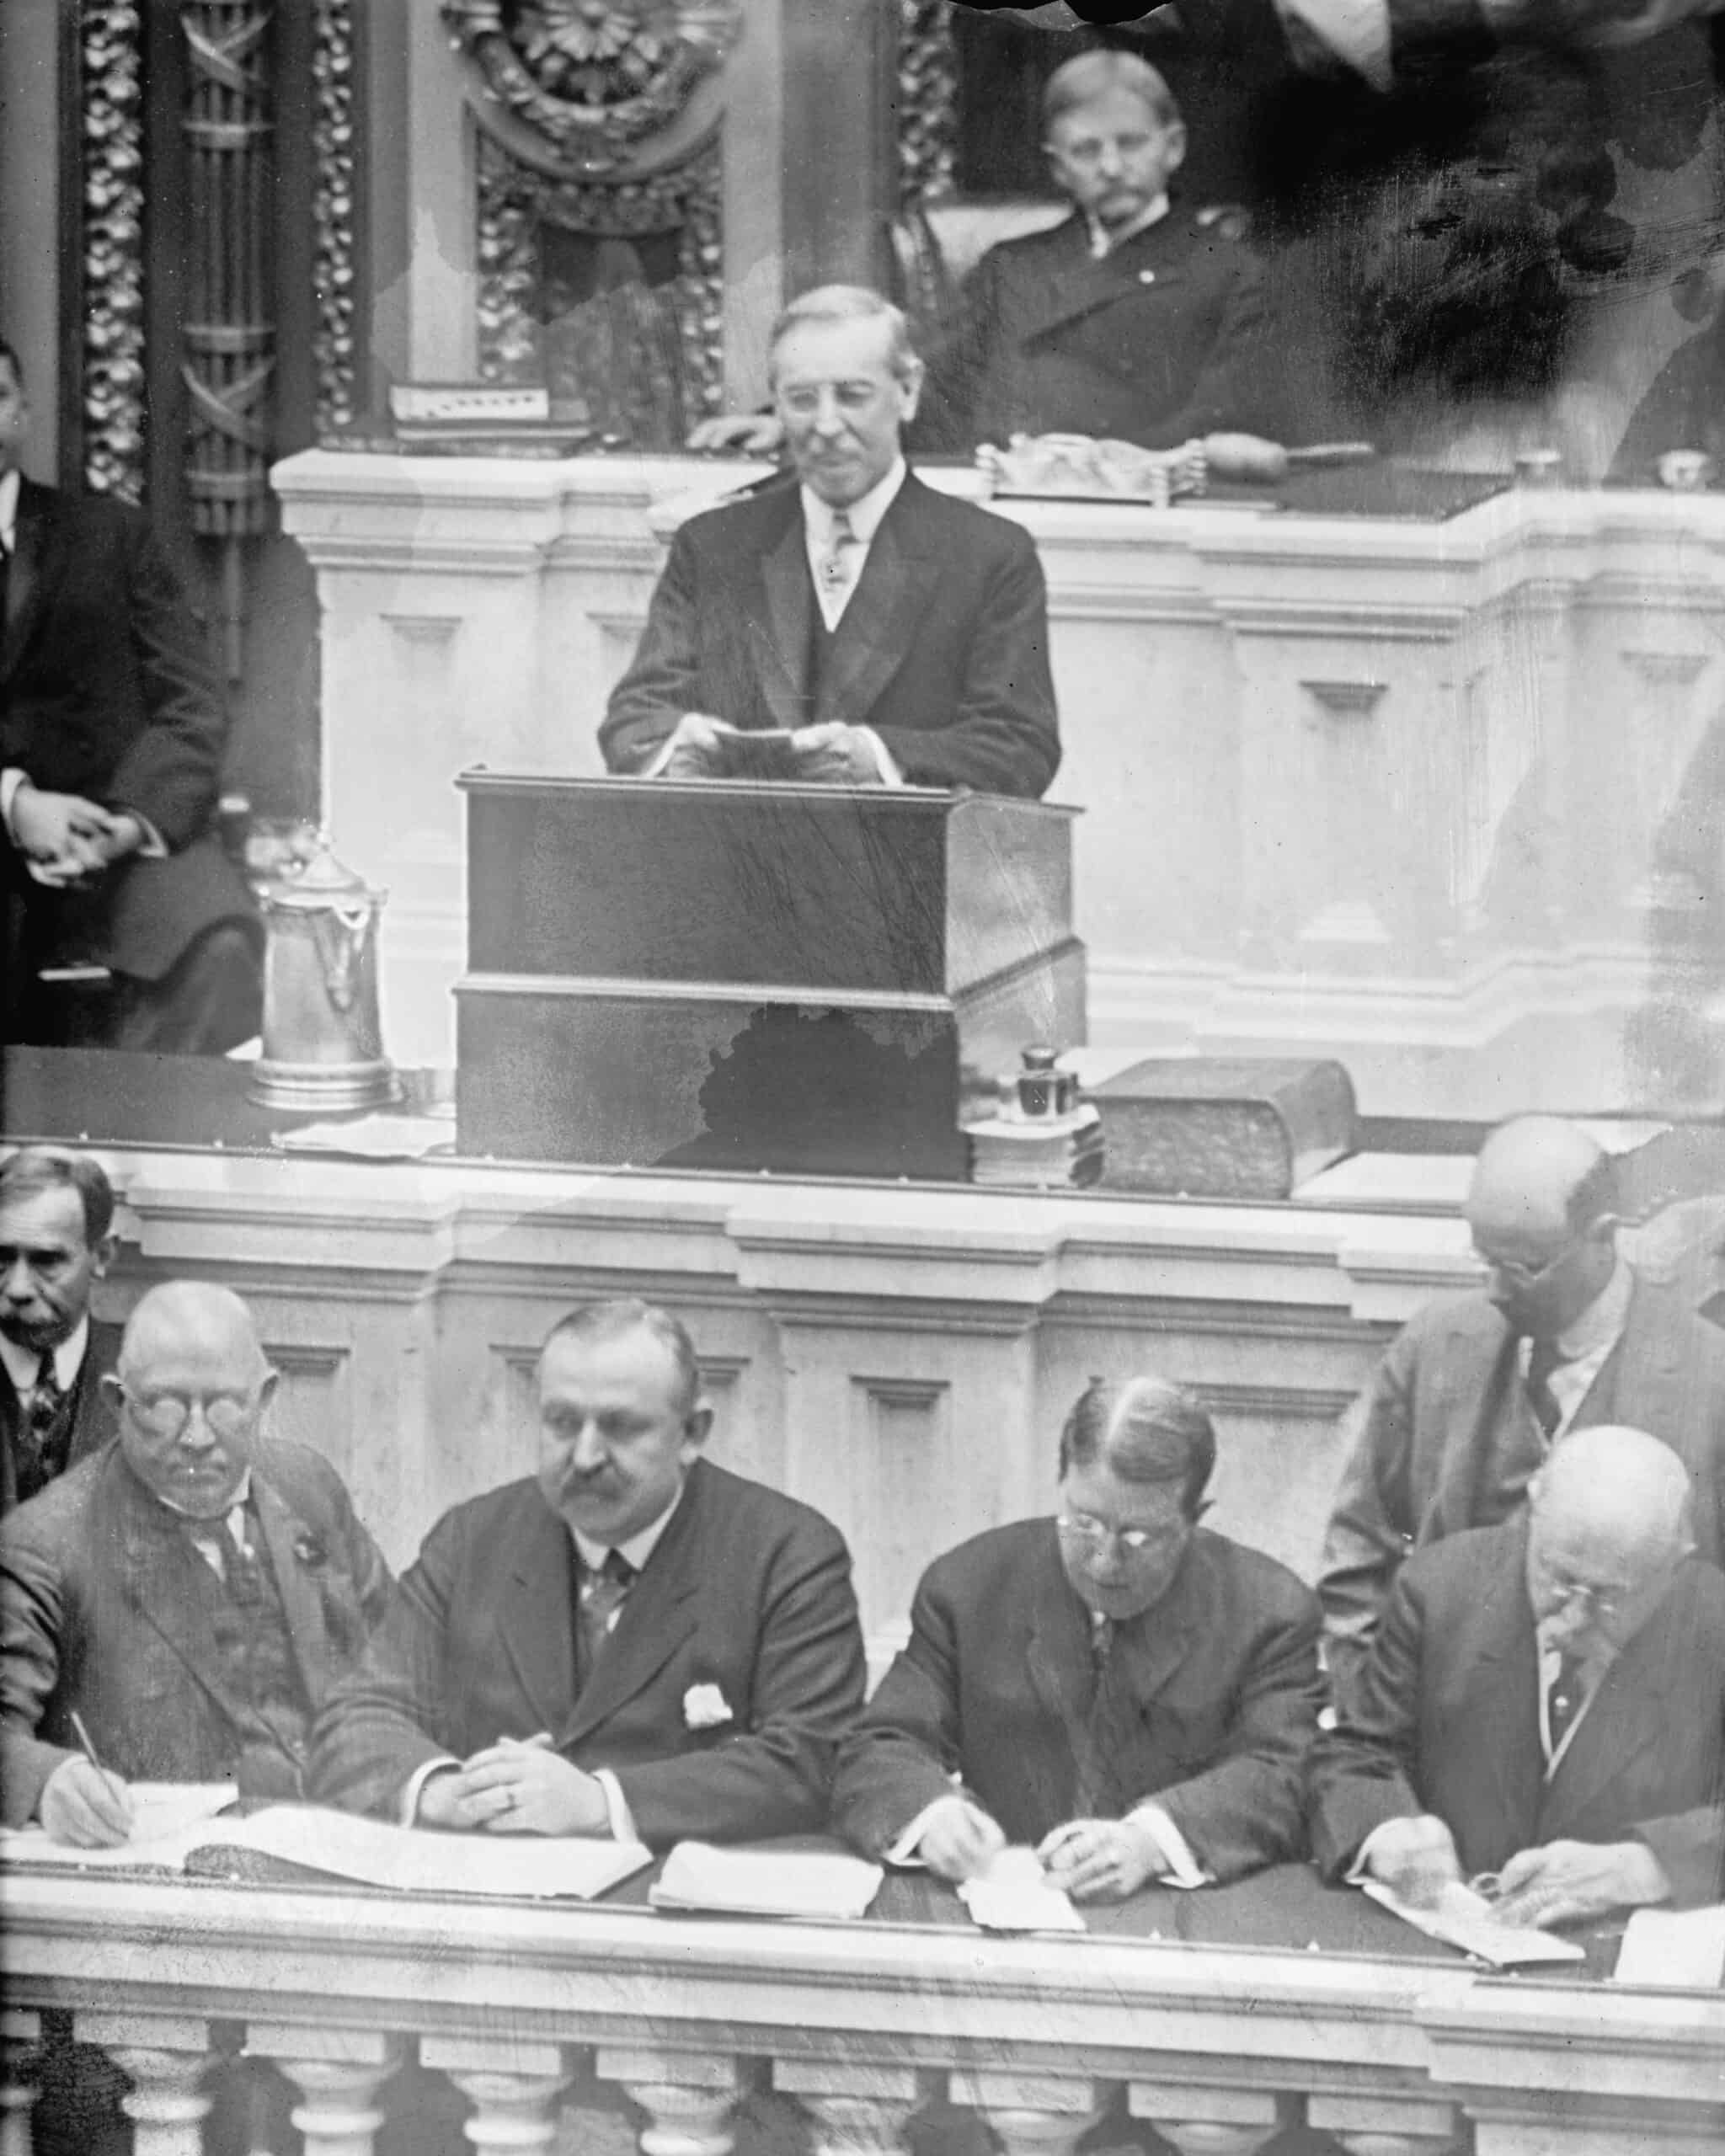
- Avg. annual change in national debt, fiscal 1913-1921: +30.1% (+$2.6 billion)
- Total change in national debt, fiscal 1913-1921: +722.2% (+$21.1 billion)
- National debt at the end of fiscal 1921: $24.0 billion
- National debt at the end of fiscal 1913: $2.9 billion
- Party affiliation: Democratic
Donald J. Trump (2nd Term, Ongoing)
- Avg. annual change in national debt, second term: ongoing
- National debt at beginning of term: $36.2 trillion
- Current national debt: as of July 1, 2026: $39.4 trillion
- Party affiliation: Republican
The image featured at the top of this post is ©Keystone / Hulton Archive via Getty Images.