
Picture two retirees with identical $1.5 million portfolios generating $80,000 a year in taxable portfolio income. One lives in Naples, Florida. The other lives in San Diego. On paper, their retirement plans look the same. In real life, they may not spend the same. Florida has no broad-based individual income tax, while California taxes ordinary income at progressive rates that can climb sharply depending on taxable income and filing status. If the California retiree’s investment income falls into a 9.3% state bracket, $80,000 of ordinary portfolio income could mean roughly $7,440 a year in state income tax before counting the federal tax bill.
That is the retirement income problem many investors miss. The headline yield is the same. The portfolio value is the same. The withdrawal target is the same. But taxes, state residency, Medicare premiums, and inflation can all change how much of that income actually reaches a retiree’s checking account. Many retirement plans still focus too heavily on gross yield, as if a 7% distribution automatically beats a 4% distribution. The better question is what survives after the IRS, the state, Medicare, and inflation all take their turn.

The $80,000 Target at Three Yield Tiers
A retiree trying to generate $80,000 a year from portfolio income needs a very different starting balance depending on the yield being targeted. At a conservative 3% to 4% yield, using 3.5% as the midpoint, the math requires roughly $2.29 million. This is the world of dividend-growth stocks, short-term Treasury funds, CDs, and high-quality bonds. Johnson & Johnson is an example of the lower-yield, dividend-growth side of that equation. The company raised its quarterly dividend from $1.30 to $1.34 in 2026, marking its 64th consecutive year of dividend increases. That kind of income stream may not look exciting next to a double-digit yield, but growth and tax character matter.
At a moderate 5% to 7% yield, using 5.5% as the midpoint, the required portfolio falls to about $1.45 million. This is where many retirees start looking at REITs, preferred shares, utility stocks, high-dividend equities, and diversified income funds. Realty Income is a useful example because it is known for monthly dividends and announced its 670th consecutive monthly common stock dividend in 2026. At the aggressive end, an 8% to 12% yield can theoretically generate $80,000 from about $800,000 if the portfolio yields 10%. That range often includes business development companies, mortgage REITs, leveraged covered-call funds, and other higher-risk income vehicles. The catch is that these higher yields often come with ordinary-income tax treatment, less dividend growth, more volatility, or more risk to the payout itself.
Where the Tax Trap Springs Shut
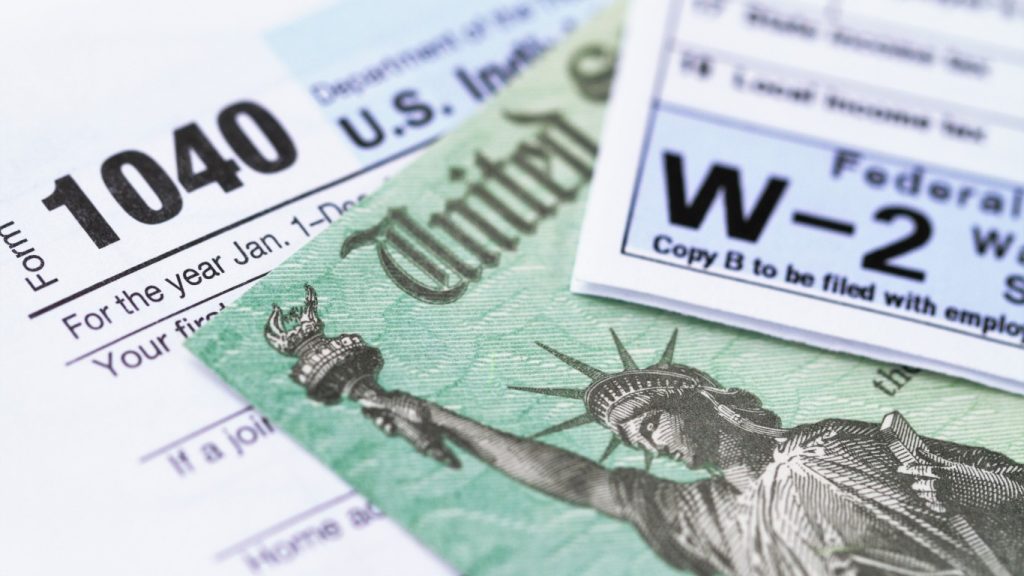
The tax character of retirement income can matter as much as the yield. Qualified dividends from many large U.S. corporations may qualify for the lower federal long-term capital gains tax rates if the investor meets the holding-period rules. That can make a lower-yielding dividend-growth stock more attractive after taxes than it looks at first glance. By contrast, REIT and BDC distributions are often largely taxed as ordinary income, though the exact mix can vary by company and year. Some distributions may include capital gain, return of capital, or other components, so investors should not assume every dollar is treated the same.
State taxes add another layer. A retiree in a no-income-tax state such as Florida, Texas, Nevada, South Dakota, Tennessee, or Wyoming may keep more ordinary portfolio income than a retiree in a high-tax state. California, New York, New Jersey, Oregon, and Hawaii can all be much less forgiving for higher-income retirees. That does not mean everyone should move for taxes alone, since housing, property taxes, insurance, family, health care, and lifestyle also matter. But it does mean state residency belongs in the income plan. A $7,440 annual state-tax difference on $80,000 of ordinary investment income becomes $186,000 over 25 years before considering what that money could have earned if it had remained invested.
Two Income Streams High-Tax States Treat Differently
Treasury income can be especially useful in taxable accounts for retirees living in high-tax states. Interest from U.S. Treasury bills, notes, and bonds is subject to federal income tax, but the IRS says it is exempt from state and local income taxes. That is why short-term Treasury funds can look more attractive after taxes than a simple yield comparison suggests. The iShares 0-3 Month Treasury Bond ETF, ticker SGOV, recently showed a 30-day SEC yield of 3.56% as of July 7, 2026. For a California retiree in a 9.3% state bracket, a fully state-taxable bond fund would need to yield roughly 3.92% to match that SGOV yield after state tax.
Municipal bonds work differently. Qualifying municipal bond interest is generally excluded from federal income tax, and in-state municipal bonds may also avoid state income tax for residents of that state. The iShares National Muni Bond ETF, ticker MUB, recently showed a 30-day SEC yield of 3.34% as of July 7, 2026. For a retiree in the 24% federal tax bracket, a 3.34% tax-exempt yield is roughly equivalent to a 4.39% taxable yield before considering state taxes. That does not make munis automatically better, because duration risk, credit quality, fund expenses, and state rules all matter. But it does show why retirees should compare income by after-tax yield, not headline yield alone.
The Quiet Bill: IRMAA and Inflation
Taxes are not the only thing that can reduce usable retirement income. Medicare premiums can rise when income crosses an IRMAA threshold. For 2026, CMS lists the standard Medicare Part B premium at $202.90 per month. For married couples filing jointly, the first IRMAA threshold begins above $218,000 of modified adjusted gross income, and Part B premiums rise to $284.10 per person per month in that first surcharge tier. Part D surcharges can also apply. That means a retiree who builds an income plan entirely around high ordinary-income distributions may create an unexpected Medicare premium problem.
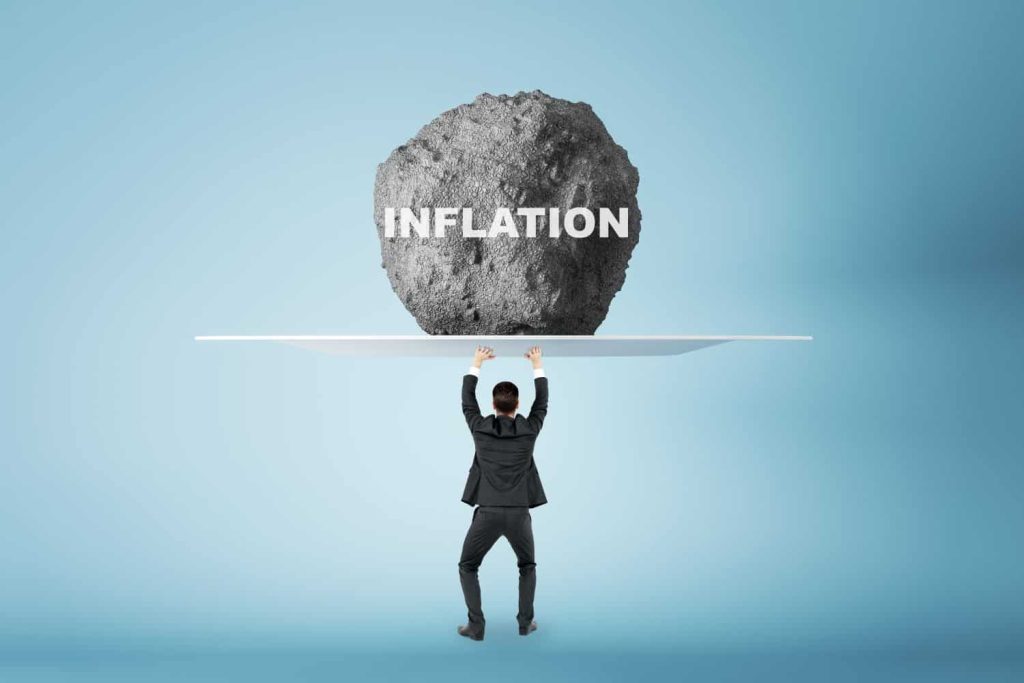
The IRMAA calculation can surprise retirees because it is not limited to taxable bond interest or ordinary dividends. The Social Security Administration defines IRMAA modified adjusted gross income as adjusted gross income plus tax-exempt interest. In other words, municipal bond interest can help reduce federal income tax, but it can still count toward Medicare premium surcharges. Inflation then adds one more challenge. The Bureau of Economic Analysis reported that the PCE price index rose 4.1% year over year in May 2026. A flat 10% income stream may look strong in year one, but if the payout never grows and prices keep rising, the retiree’s purchasing power slowly erodes.
Make the Yield Work After Taxes
The first step is to map retirement income by tax character instead of by ticker symbol. A portfolio that simply lists dividend yield, bond yield, and fund distributions is missing the point. Retirees should separate qualified dividends, ordinary dividends, REIT income, BDC income, Treasury interest, municipal bond interest, capital gains, IRA withdrawals, Roth withdrawals, and Social Security. Each one can be treated differently by the federal government, the state, and Medicare. A retiree does not need to become a tax expert, but the income plan should show which dollars are likely to be taxed as ordinary income and which dollars may receive better treatment.
The second step is to run the state-tax comparison on the actual portfolio. Start by estimating annual ordinary-income distributions, then multiply that figure by the retiree’s marginal state bracket. That rough number is not a final tax projection, but it quickly shows whether state taxes are a minor nuisance or a major retirement expense. From there, refine the estimate for filing status, deductions, state-specific rules, Social Security treatment, pension treatment, and any local taxes. For retirees considering a move, the question is not just whether a state has no income tax. It is whether the total cost of living, housing, insurance, health care, and taxes improves the retirement picture.

Stress Test the Aggressive Tier
High-yield retirement income can work, but it needs to be tested harder than a blue-chip dividend portfolio or short-term Treasury ladder. A 10% distribution is only useful if the payout is sustainable, the underlying asset does not lose too much value, and the tax bill does not erase the advantage. Business development companies, mortgage REITs, leveraged income funds, and covered-call strategies can all have a place in an income portfolio, but they should not be judged by yield alone. A retiree should look at total return, payout history, credit quality, leverage, expense ratios, and how the fund or company performed during stress periods.
This is where dividend growth can compete with raw yield. A stock yielding 3% today but raising its payout steadily may produce more usable income later than a flat 10% payer that never grows or loses principal over time. Johnson & Johnson’s 2026 dividend increase is a reminder that slower income can still compound. The right comparison is not 3% versus 10% in year one. It is after-tax income, dividend growth, inflation protection, and account value over 10, 15, or 25 years. Retirees who only chase the biggest yield on the screen may end up with a portfolio that looks rich on paper but struggles to preserve spending power.
The Better Retirement Income Target
The highest-yielding portfolio is not always the portfolio that produces the most usable retirement income. A retiree who wants $80,000 a year should not stop once the brokerage account shows $80,000 in projected distributions. That number still has to pass through federal taxes, state taxes, possible Medicare surcharges, and inflation. It also has to survive market downturns, dividend cuts, interest-rate changes, and the ordinary math of a long retirement. Gross yield is only the beginning of the story.
The better target is not simply $80,000 of portfolio income. It is $80,000 of durable spending power. That means blending income sources with different tax treatments, keeping some flexibility in taxable and tax-advantaged accounts, and recognizing that location can matter almost as much as allocation. A $1.5 million portfolio can support very different retirements depending on where the investor lives and how the income is generated. For retirees, the winning portfolio is not the one with the flashiest yield. It is the one that still works after the state, Medicare, taxes, and inflation all take their cut.