Where we heard it“Why are so many men opting out of the labor force?” Marketplace Morning Report, Nov. 3, 2026. Host Kimberly Adams interviewed Remy Levin, a behavioral economist at the University of Connecticut.
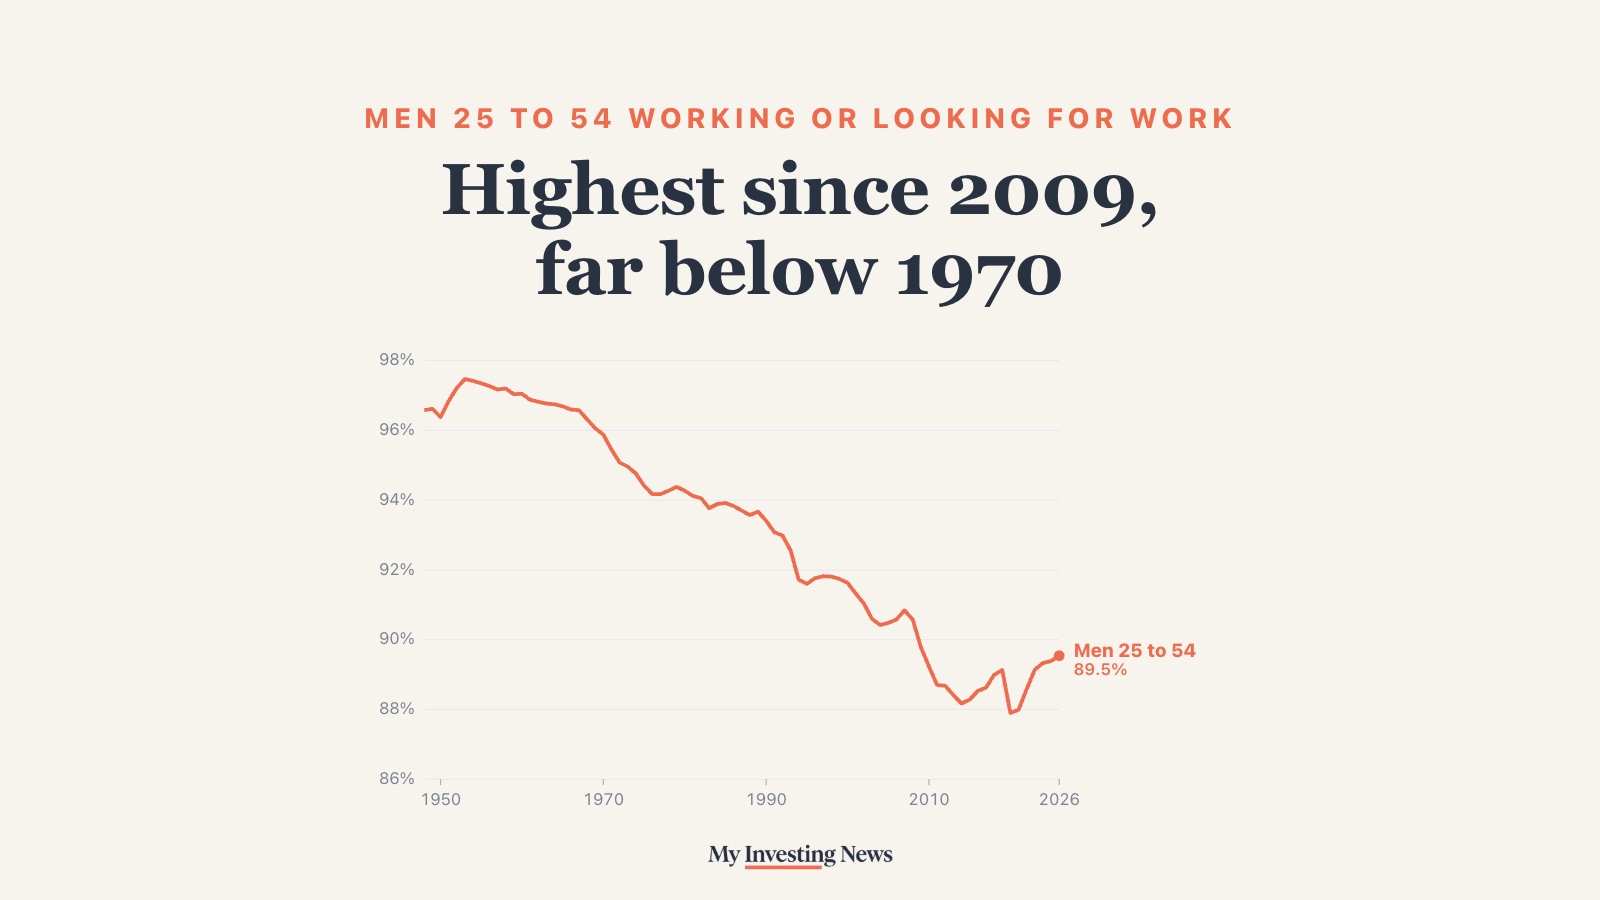
Remy Levin has spent years on one of the labor market’s oldest puzzles: why so many men in their prime working years have stopped working or looking for work. On Marketplace Morning Report on Nov. 3, the University of Connecticut economist laid out the history. “In the 1960s or in 1970, about 95% of prime-aged men, so that’s men between 25 and 54, were in the labor force,” he said. “And then by 2015, that number had gone down to about 88%.” That gap, he added, is “millions and millions of men who are not in the labor force and are not looking for jobs.”

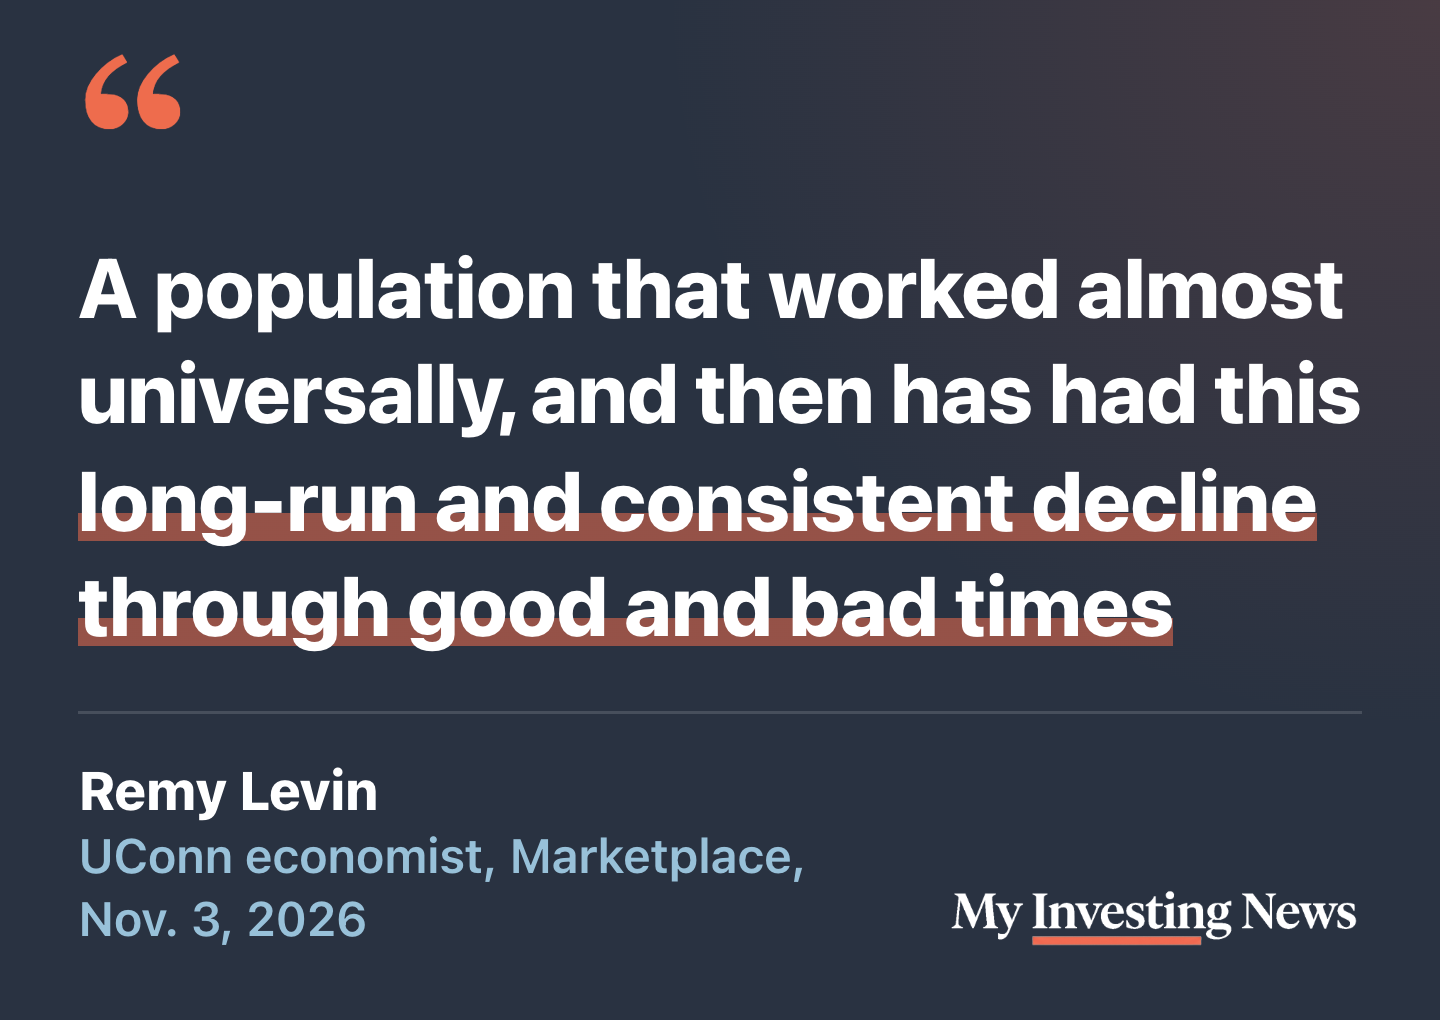
What sets the group apart, Levin said, is that it once worked almost universally and then declined steadily, even as other groups did not. His new research, written with Daniela Vidart and published as a National Bureau of Economic Research working paper titled “Nobody Wants to Work Anymore,” argues that one cause is men’s beliefs about the payoff from work, shaped by the job markets they saw growing up. We checked his numbers against the Bureau of Labor Statistics record, which goes back to 1948, and looked at what has happened since 2015.
The Long Slide Is Real, and It Started Higher
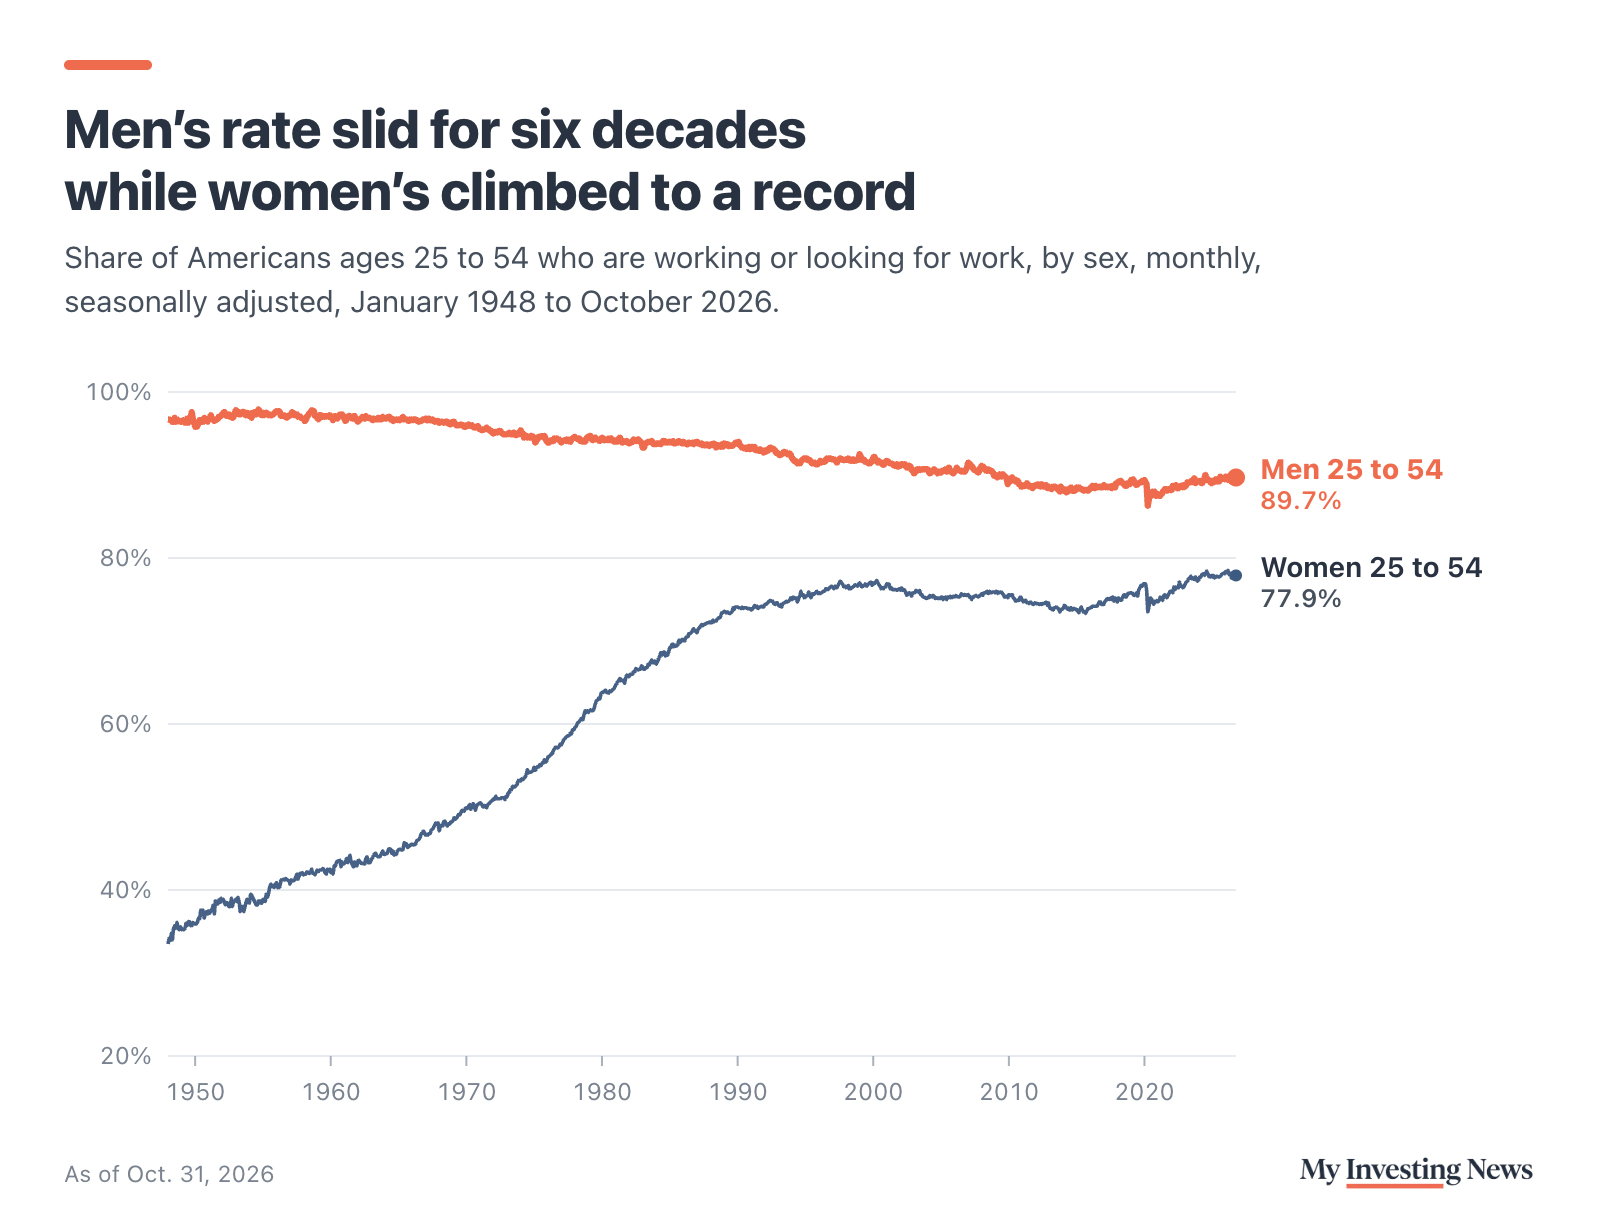
Levin’s history holds up, and if anything he undersold it. The BLS series for men 25 to 54 averaged 96.7% in the 1960s and 95.9% in 1970, so the starting point was closer to 96% or 97% than 95%. It peaked at 97.9% in September 1954. His 2015 figure is right on: the rate averaged 88.3% that year.
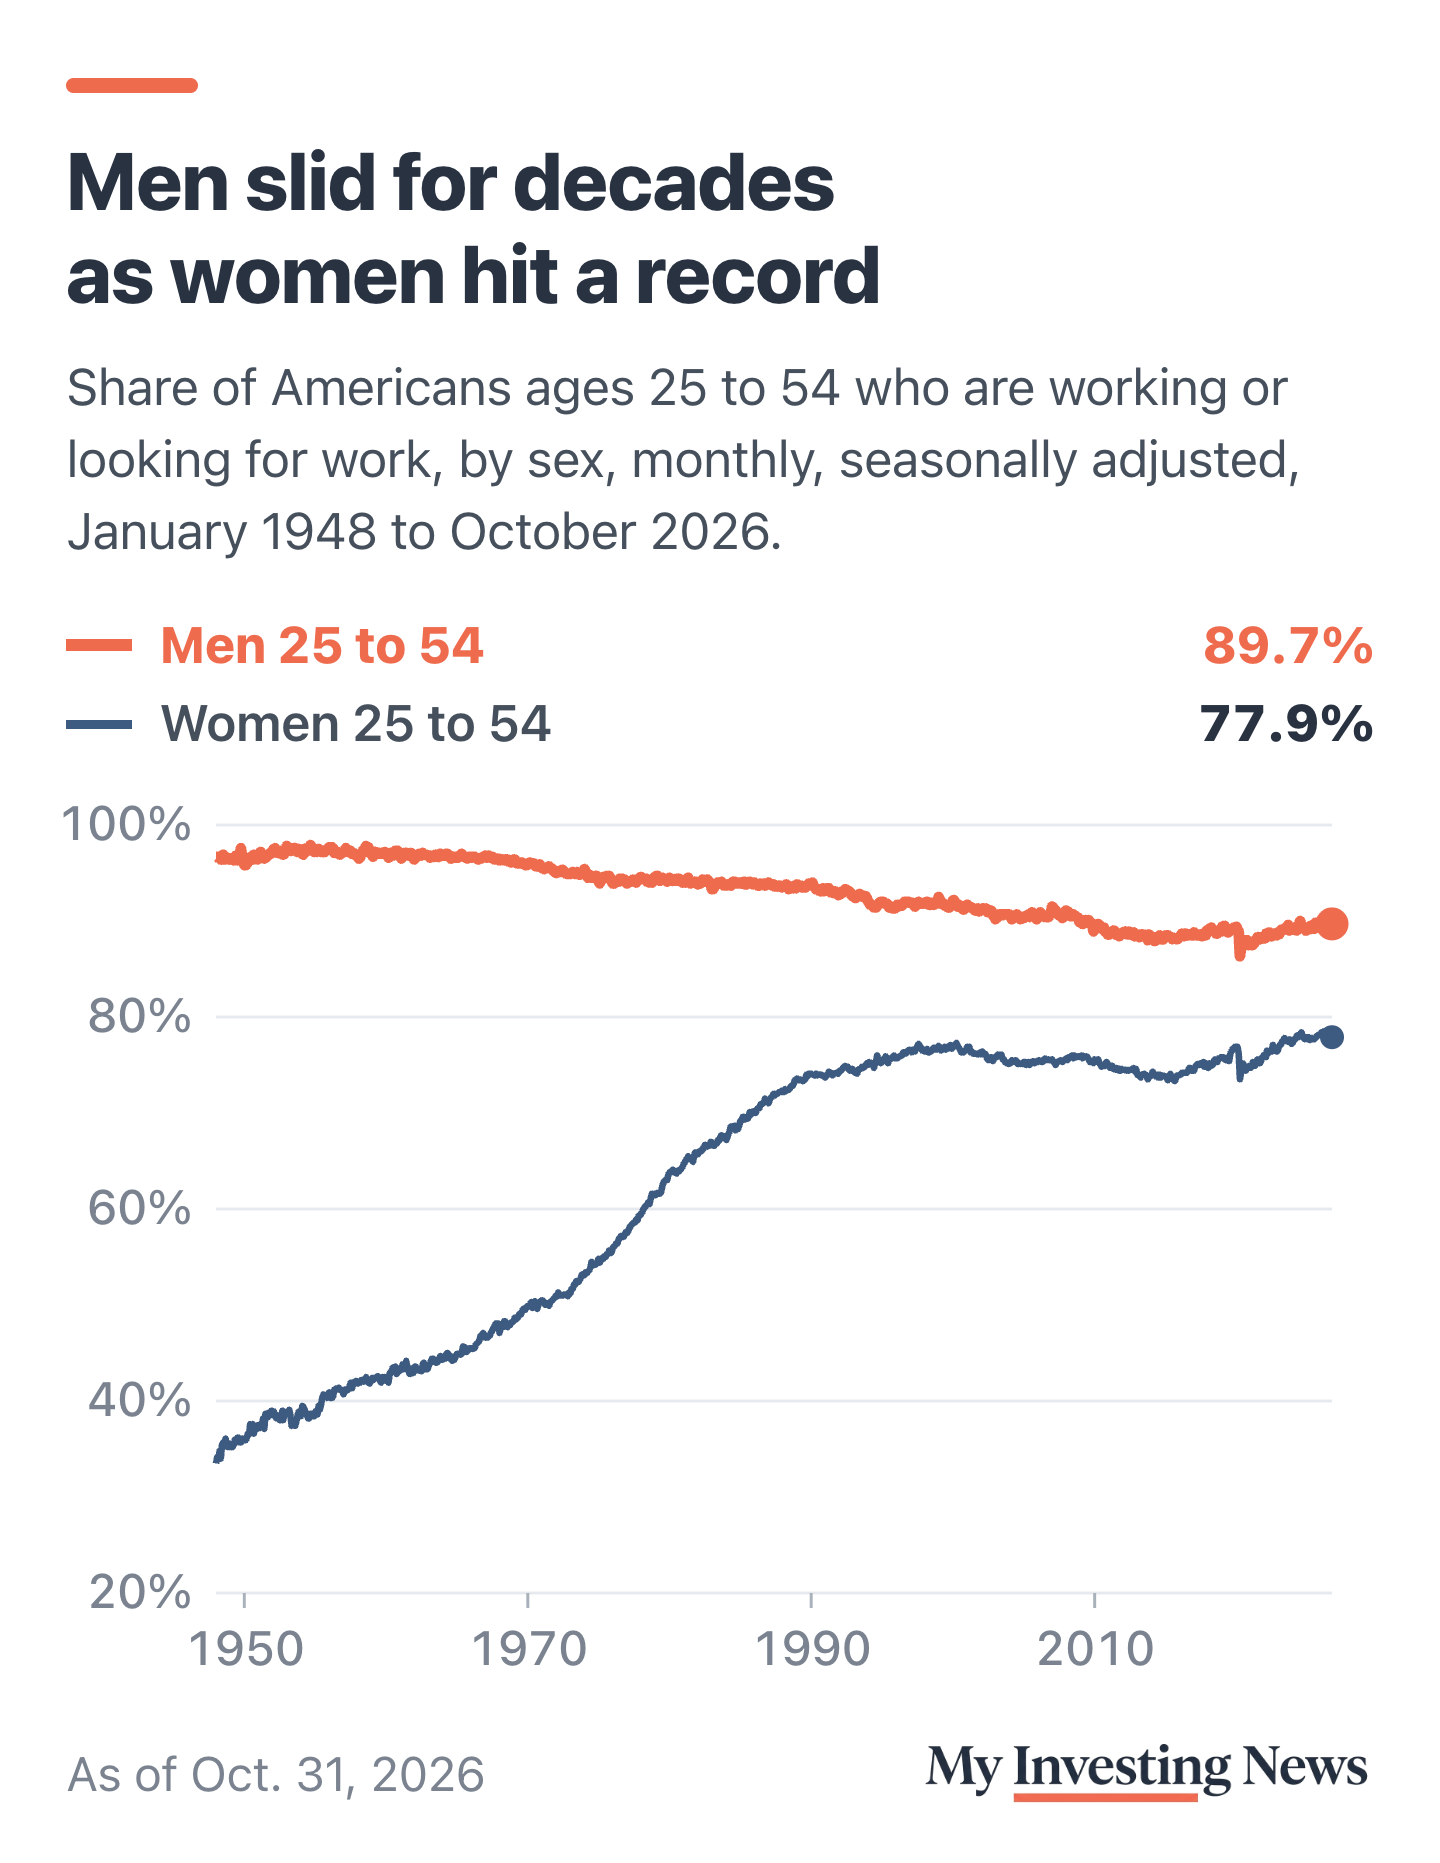
The decline also matches his description of a slide “through good and bad times.” The rate fell during recessions and mostly failed to recover in the expansions that followed. Over the same decades, women moved the other way, which is the contrast Levin pointed to. Prime-age women’s participation rose from 35% in 1948 to 50% in 1970 and hit a record 78.5% in March 2026.
Then the Slide Stopped
The part of the story that has changed is the last decade. On a yearly basis, prime-age men’s participation bottomed at 88.2% in 2014. It climbed through 2019, plunged to 86.3% in April 2020 as the pandemic shut down the economy, and has recovered since. From January through October of this year it averaged 89.5%, the highest for those months since 2009 and up about 1.4 points from the 2014 low. That still leaves it more than six points below 1970.
In the October jobs report, released Nov. 6, the rate was 89.7%. The household survey behind it is noisy from month to month, so the three-month average of 89.5% is a steadier read. It is up from 89.2% in June, July and August. The overall labor force tells a similar story. On CNBC on Nov. 9, Steve Liesman noted that it shrank from January to July and then grew by 1.6 million from July to October. BLS data show a drop of 1.37 million and then a gain of 1.59 million, though January figures include the bureau’s yearly population adjustments. For the payroll side of that report, the three- and six-month averages of job gains ran well below October’s 165,000.
Men ages 25 to 54 in the labor force
Testing the Disability Explanation
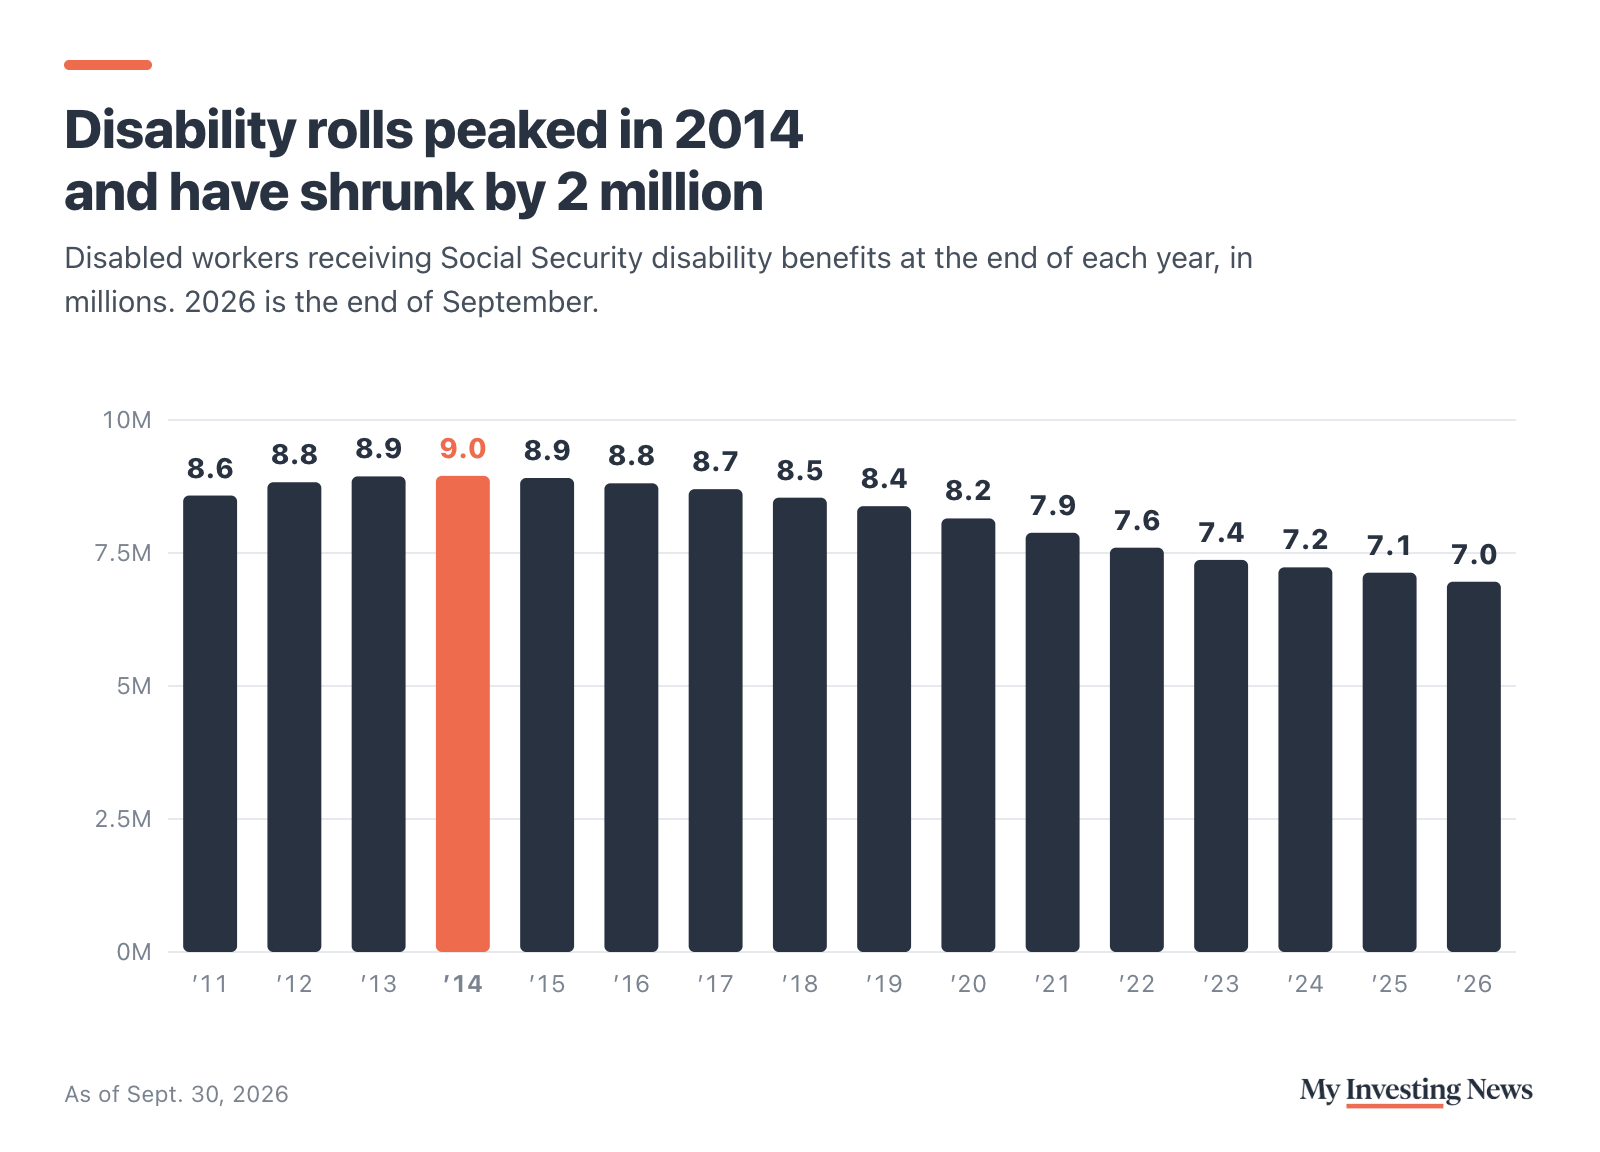
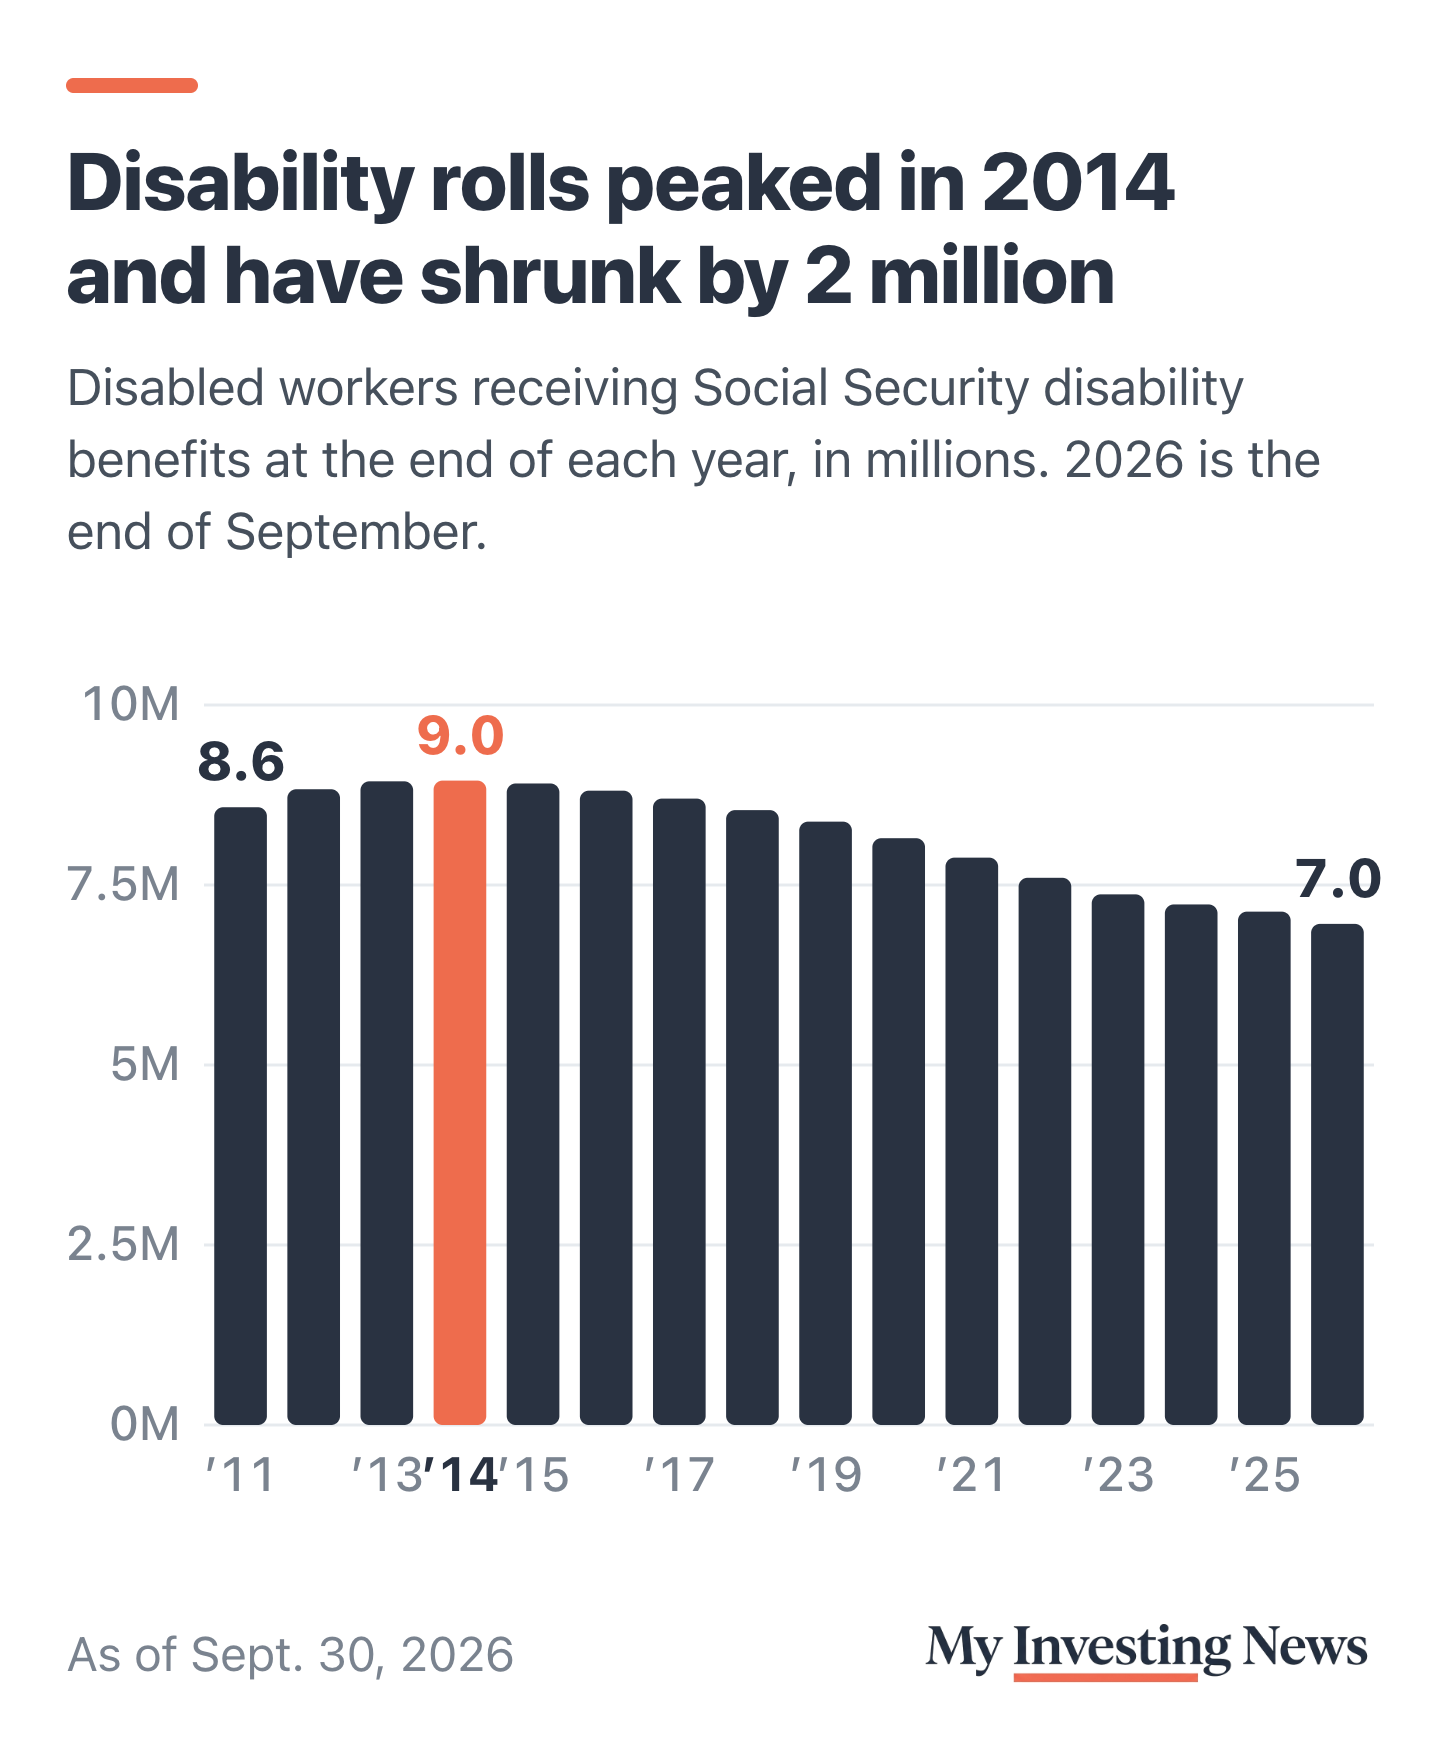
Levin listed several drivers, from his own work and other research: the generosity of the safety net, “changes in payments for disability, which allow one to survive if you’re not working,” and shifting norms about not working or living with parents. The disability piece is the easiest to check, and its timing lines up with the turn. Social Security’s actuaries count 8.95 million disabled workers receiving benefits at the end of 2014, the peak. By September 2026 the count was 6.96 million, down 22%.
That does not prove one caused the other. Applications fall when jobs are plentiful, older beneficiaries convert to retirement benefits, and the rolls cover women too. Still, the rolls have shrunk by about 2 million people over the same years that men came back. We did not find comparable yearly data to test the living-at-home point.
What to Watch
Levin’s research points to a slower force: beliefs formed over a lifetime. If he is right, a few strong years of hiring should lift participation only gradually, and the men who grew up in weaker job markets may stay out longer. He also warned that young men reading about artificial intelligence and expecting no jobs could talk themselves out of looking, “a little bit of a self-reinforcing prophecy.” Pay matters to that calculation too, and the Fed’s latest survey of household finances found lower earners got raises and still got poorer.
The November jobs report, due in early December, will show whether October’s 89.7% holds. Before the October report, Julia Coronado described layoffs as low. The real test of Levin’s concern is whether the share keeps rising when hiring cools.
Levin is right that prime-age men’s participation fell for decades, from about 96% in 1970 to about 88% in 2015, while women’s climbed. Apart from the pandemic plunge, the slide stopped in 2014, and this year’s 89.5% average is the highest since 2009. It is still far below where it started, and a cooling job market would test whether the recovery lasts.