Where we heard itDave Ramsey on The Ramsey Show, Nov. 5, 2026; Wes Moss on The Clark Howard Podcast’s “Ask An Advisor” segment, Nov. 3, 2026; and Morningstar’s “What’s a Safe Retirement Withdrawal Rate for 2026?”, Dec. 3, 2025.
How much of a nest egg can a retiree spend each year? Two well-known voices answered it within days of each other this month, and both went well past the safe rate in Morningstar’s latest research, 3.9% of savings. Wes Moss, the financial planner, worked through a $500,000 retirement on The Clark Howard Podcast on Nov. 3 using 5%. Two days later, Dave Ramsey told a caller on The Ramsey Show that a retiree with $1 million in growth stock mutual funds could “only pull off 8%,” or $80,000 a year.
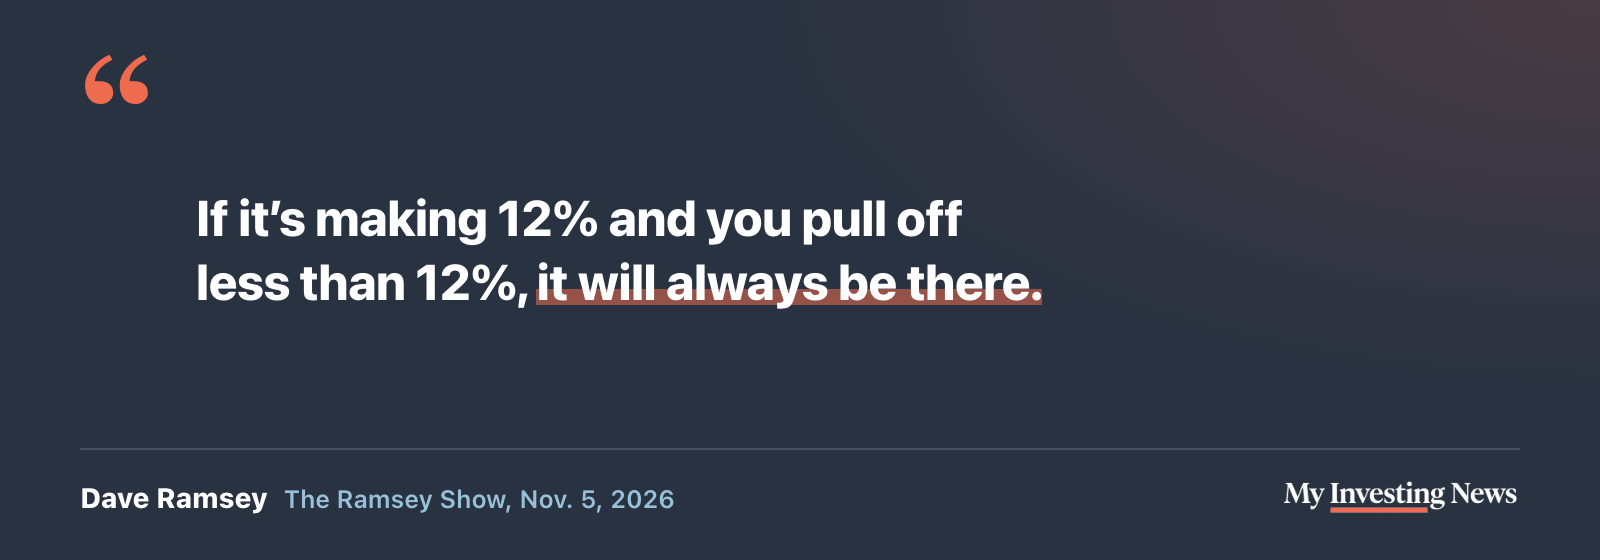
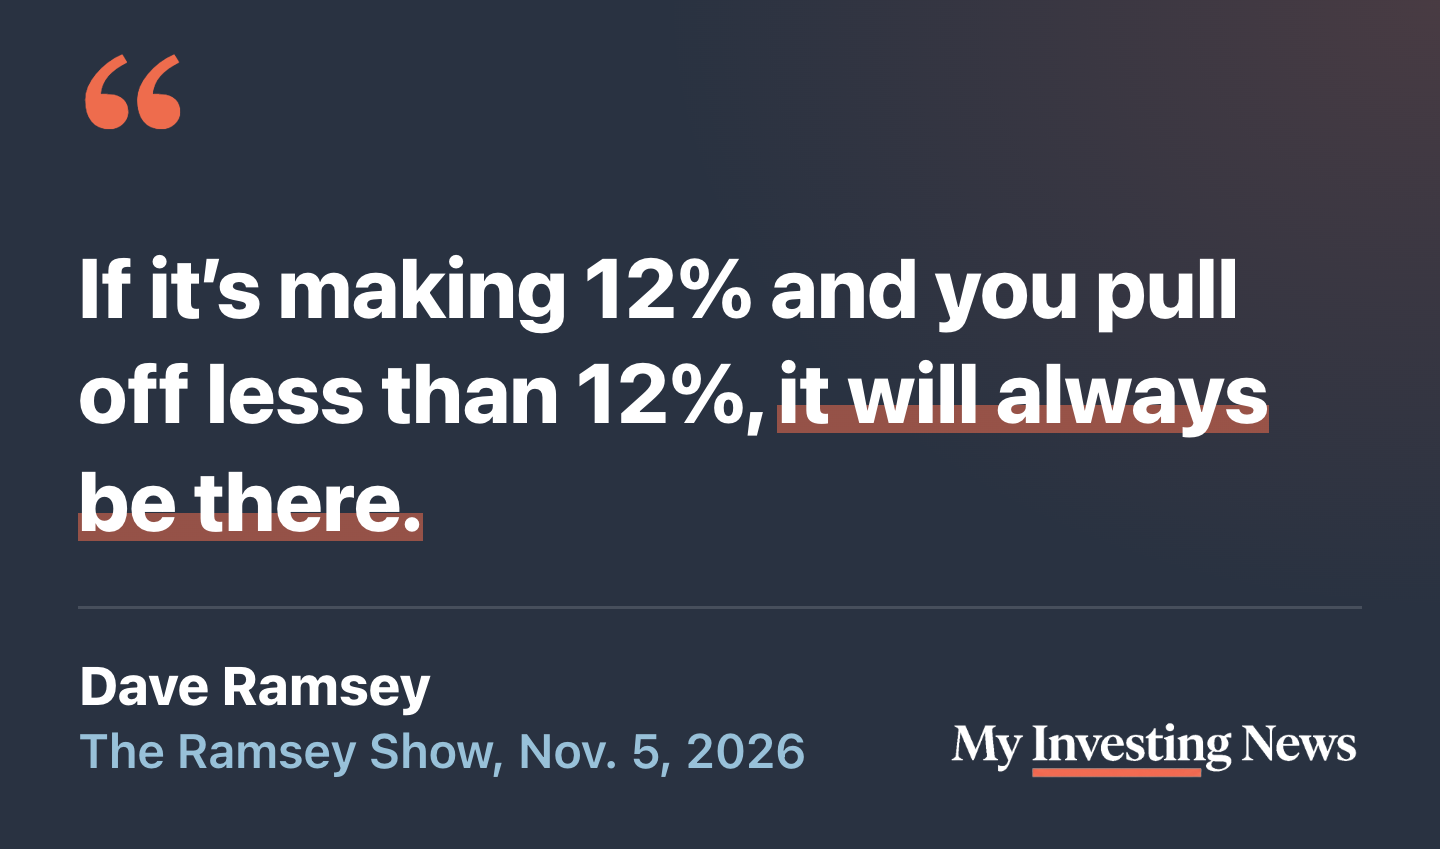
Ramsey’s reasoning was that the funds were “averaging what the S&P is averaging of 12, 12 and a half percent,” so taking less than that would leave the million untouched. He said 8% leaves room for inflation, and he dismissed moving money into bonds at 65. Moss was more cautious about his own number. Pushing past “the 4% rule” to 5% is “a little high on a withdrawal rate,” he said, and retiring on $500,000 “is possible, but it is difficult.” We checked both quotes against the audio of each episode.
How We Ran the Test
We used the annual returns that NYU Stern professor Aswath Damodaran publishes for the S&P 500 with dividends, 10-year Treasury bonds and consumer prices, from 1928 through 2025. That covers 69 full 30-year retirements, starting every year from 1928 to 1996. Each retiree takes the first withdrawal on the first day of the year, then raises it with inflation every year after, which is how Morningstar defines its rate. We ran two portfolios: all stocks, the way Ramsey invests, and 60% stocks with 40% bonds, rebalanced every year. A retirement counts as having run dry if the money could not cover all 30 withdrawals. There are no fees or taxes in the test, so real-world results would be somewhat worse.
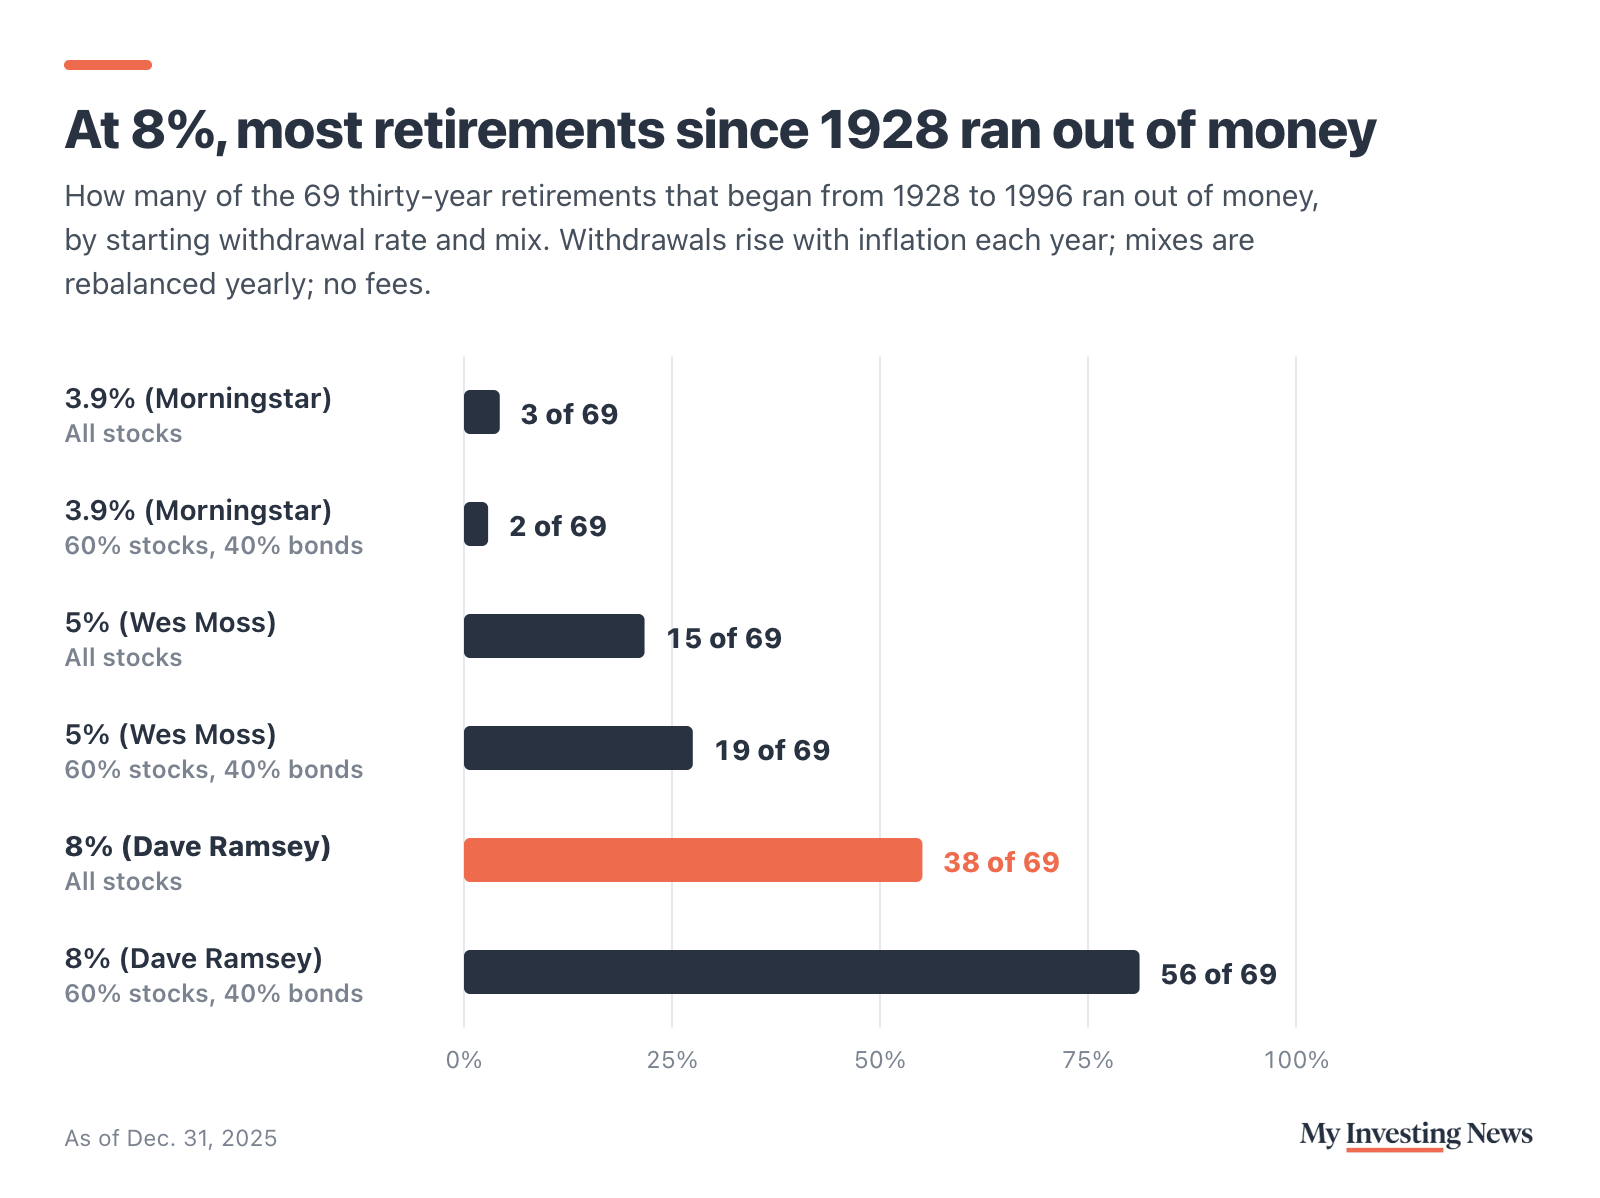
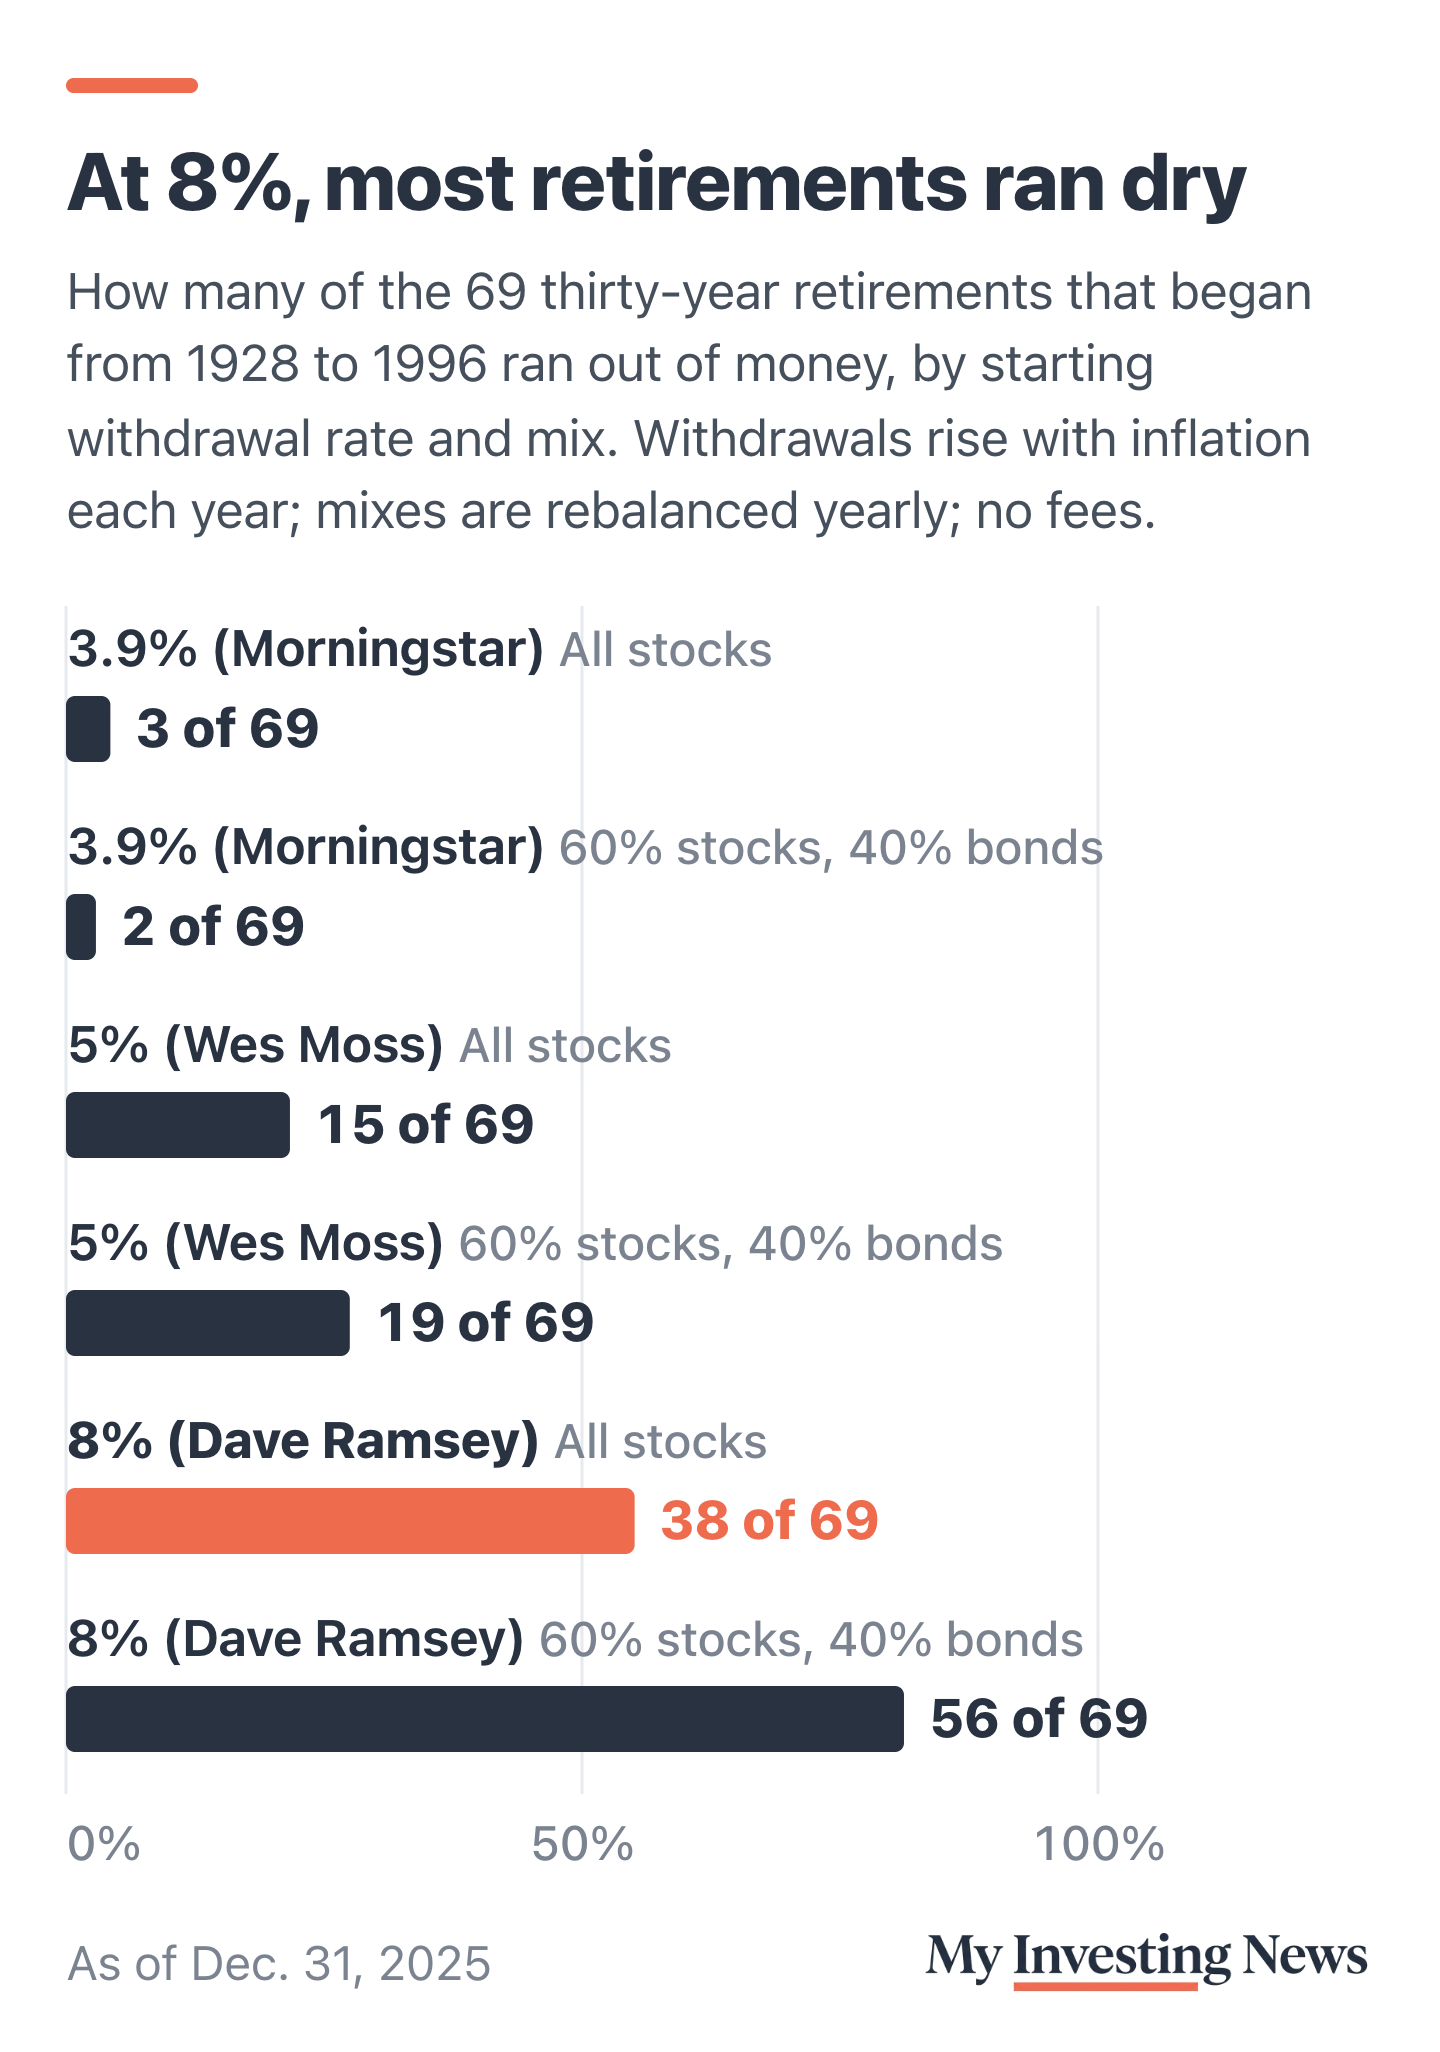
The 8% rule ran out of money in 38 of 69 retirements in an all-stock portfolio, and in 56 with 60/40. Moss’s 5% failed 15 times in all stocks and 19 times with 60/40. Morningstar’s 3.9% failed 3 times and 2 times, and each of those still covered at least 21 of the 30 years.
Why 8% Breaks
Ramsey’s 12% is close to the record if you take a simple average of yearly returns: 11.8% for the S&P 500 from 1928 to 2025. But money compounds at the actual growth rate, which was 10.0% a year. After inflation, it was 6.8%. An 8% withdrawal that keeps pace with prices asks the portfolio to earn more than stocks have earned over nearly a century, and the order of returns makes it worse. Retirees who started in 1929 and 1973 ran out in the ninth year, in 1937 and 1981. A 1966 retiree was broke by 1977.
The rule failed in good eras too. Retirements that began in 1990 and 1996, at the start of the long 1990s bull market, ran dry in 2018 and 2019, after the 2000 and 2008 crashes. Ramsey’s own example kept the withdrawal at a flat $80,000 with no raises. On that basis 8% failed 13 times, but the check loses buying power: consumer prices rose to 2.12 times their level over the 30 years from 1996 to 2025, so a flat check would have bought less than half as much by the end.
Retirements that ran dry, of 69 starting 1928 to 1996
Where 5% and 3.9% Land
Moss’s 5% held up in most eras, with two bad stretches. In the 60/40 portfolio it failed for every retiree who started from 1959 through 1973, when inflation ate into returns for more than a decade, and for those who started in 1929, 1930, 1937 and 1956. All stocks did a little better, failing for most 1962 to 1973 starts and four Depression-era ones. His plan also leans on two Social Security checks of about $2,000 a month each, which he called the average at 67; the trustees have moved Social Security’s projected run-out date 29 times since 1983. Moss is a regular voice on The Clark Howard Podcast, where another rule of thumb, “Sell in May,” trailed staying invested in our test.
Morningstar’s 3.9% is a forecast based on expected returns, with a 90% chance of lasting 30 years and 30% to 50% in stocks. Against history it was close to the floor. The lowest rate that would have lasted through every start was 3.5% in all stocks, set by 1929, and 3.7% with 60/40, set by 1966. The cost of that safety is money left unspent: in the typical 3.9% all-stock retirement, the portfolio ended 30 years later worth 4.1 times its starting value after inflation.
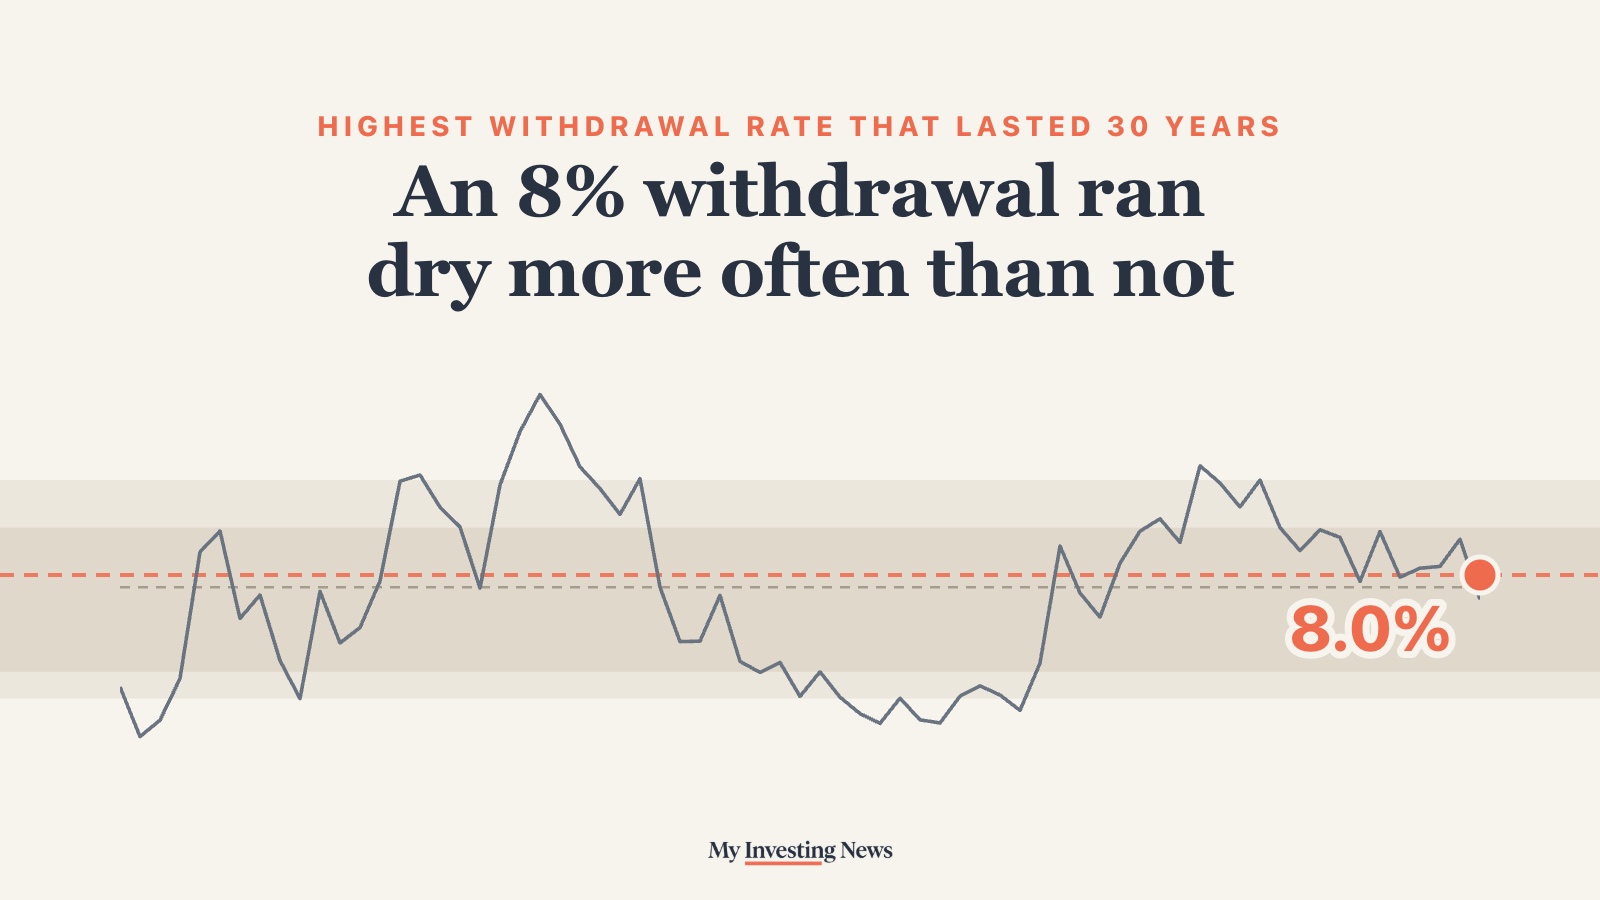
An 8% withdrawal lasted 30 years in only 31 of 69 retirements since 1928, even in all stocks
The highest starting withdrawal rate, raised with inflation each year, that would have lasted 30 years, for each year a retirement could have begun from 1928 to 1996. All S&P 500, dividends reinvested, no fees. The bands hold the middle half and middle 80% of the 69 results.
The chart shows the highest rate each starting year could have used in all stocks. The median was 7.7%, which is why 8% sounds reasonable: it worked for retirees who started in the 1940s and early 1950s or in the late 1970s and 1980s. It lasted in 31 of 69 years. No one can know in advance which kind of decade a retirement will start in.
What to Watch
Morningstar has updated its estimate every year since 2021, when it was 3.3%; the current 3.9% came out on Dec. 3, 2025, so a new number for people retiring in 2027 may be close. The research also found that flexible plans, which cut spending after bad years, support higher starting rates than a fixed raise every year. Retirees using any fixed rule face the biggest risk in the first decade, when a bear market or a burst of inflation does the most damage.
Raised with inflation, Ramsey’s 8% ran out of money in 38 of 69 retirements since 1928, even in all stocks, because stocks compounded at 6.8% a year after inflation, well short of his 12% average. Moss’s 5% held in most eras but failed for most 1960s retirees, and Morningstar’s 3.9% fell short only two or three times, each after at least 21 years, at the cost of leaving most retirees with money unspent.