Where we heard itA post on X by Charlie Bilello, chief market strategist at Creative Planning, Nov. 4, 2026, the morning the Commerce Department released September trade figures.
Charlie Bilello put the tariff era’s main promise next to its results. “Tariffs were pitched as the fix for America’s trade deficit,” the Creative Planning strategist wrote on X on Nov. 4, the day the Commerce Department published trade figures for September. In the last 21 months, he wrote, the U.S. ran a $2.19 trillion deficit in goods. In the 21 months before that, it was $2.01 trillion. “The deficit didn’t shrink. It increased 9%.”
Checking the Sum
His windows are January 2025 through September 2026 and April 2023 through December 2024. We added up the monthly goods balance from the Census Bureau and the Bureau of Economic Analysis for the same months. The earlier window comes to $2,009.5 billion, matching his figure to the million. The recent one comes to $2,198.2 billion, about $6 billion more than his chart shows, which puts the increase at 9.4% instead of 9.1%. The data had not been revised between the Nov. 4 release and Nov. 10, so the gap does not change the conclusion. His claim holds.
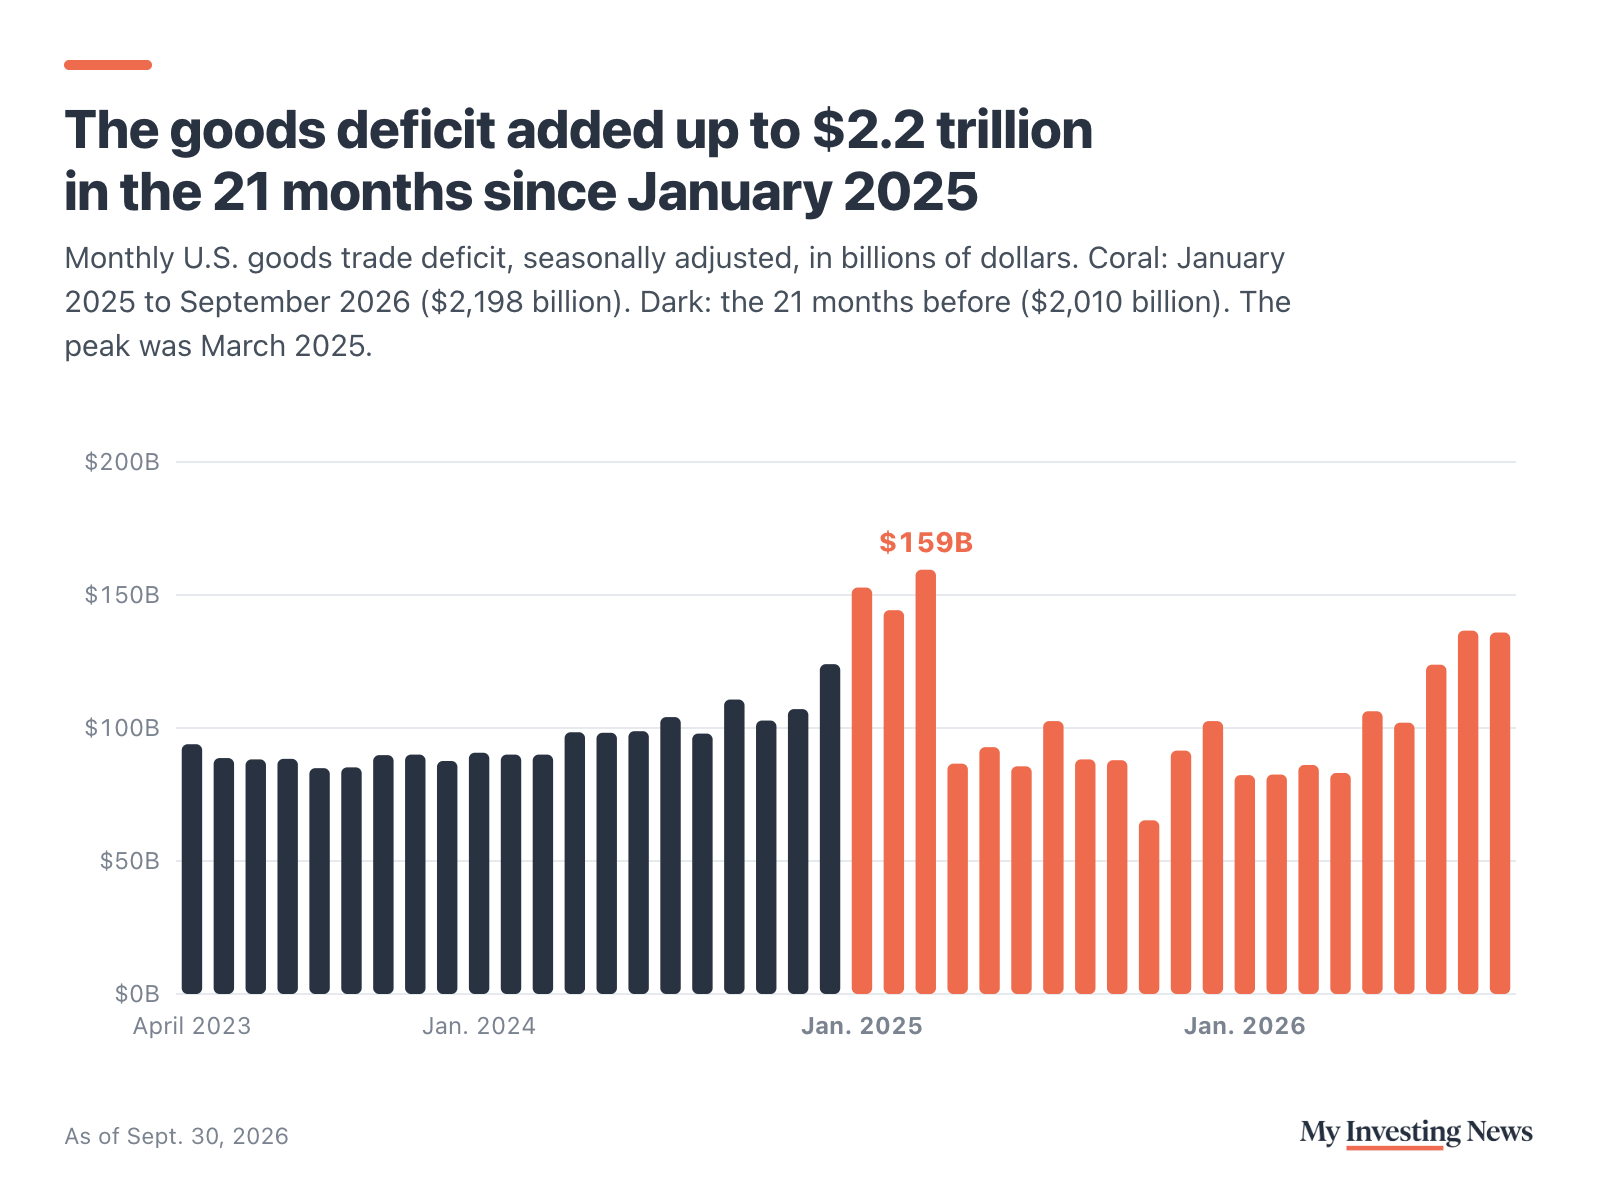
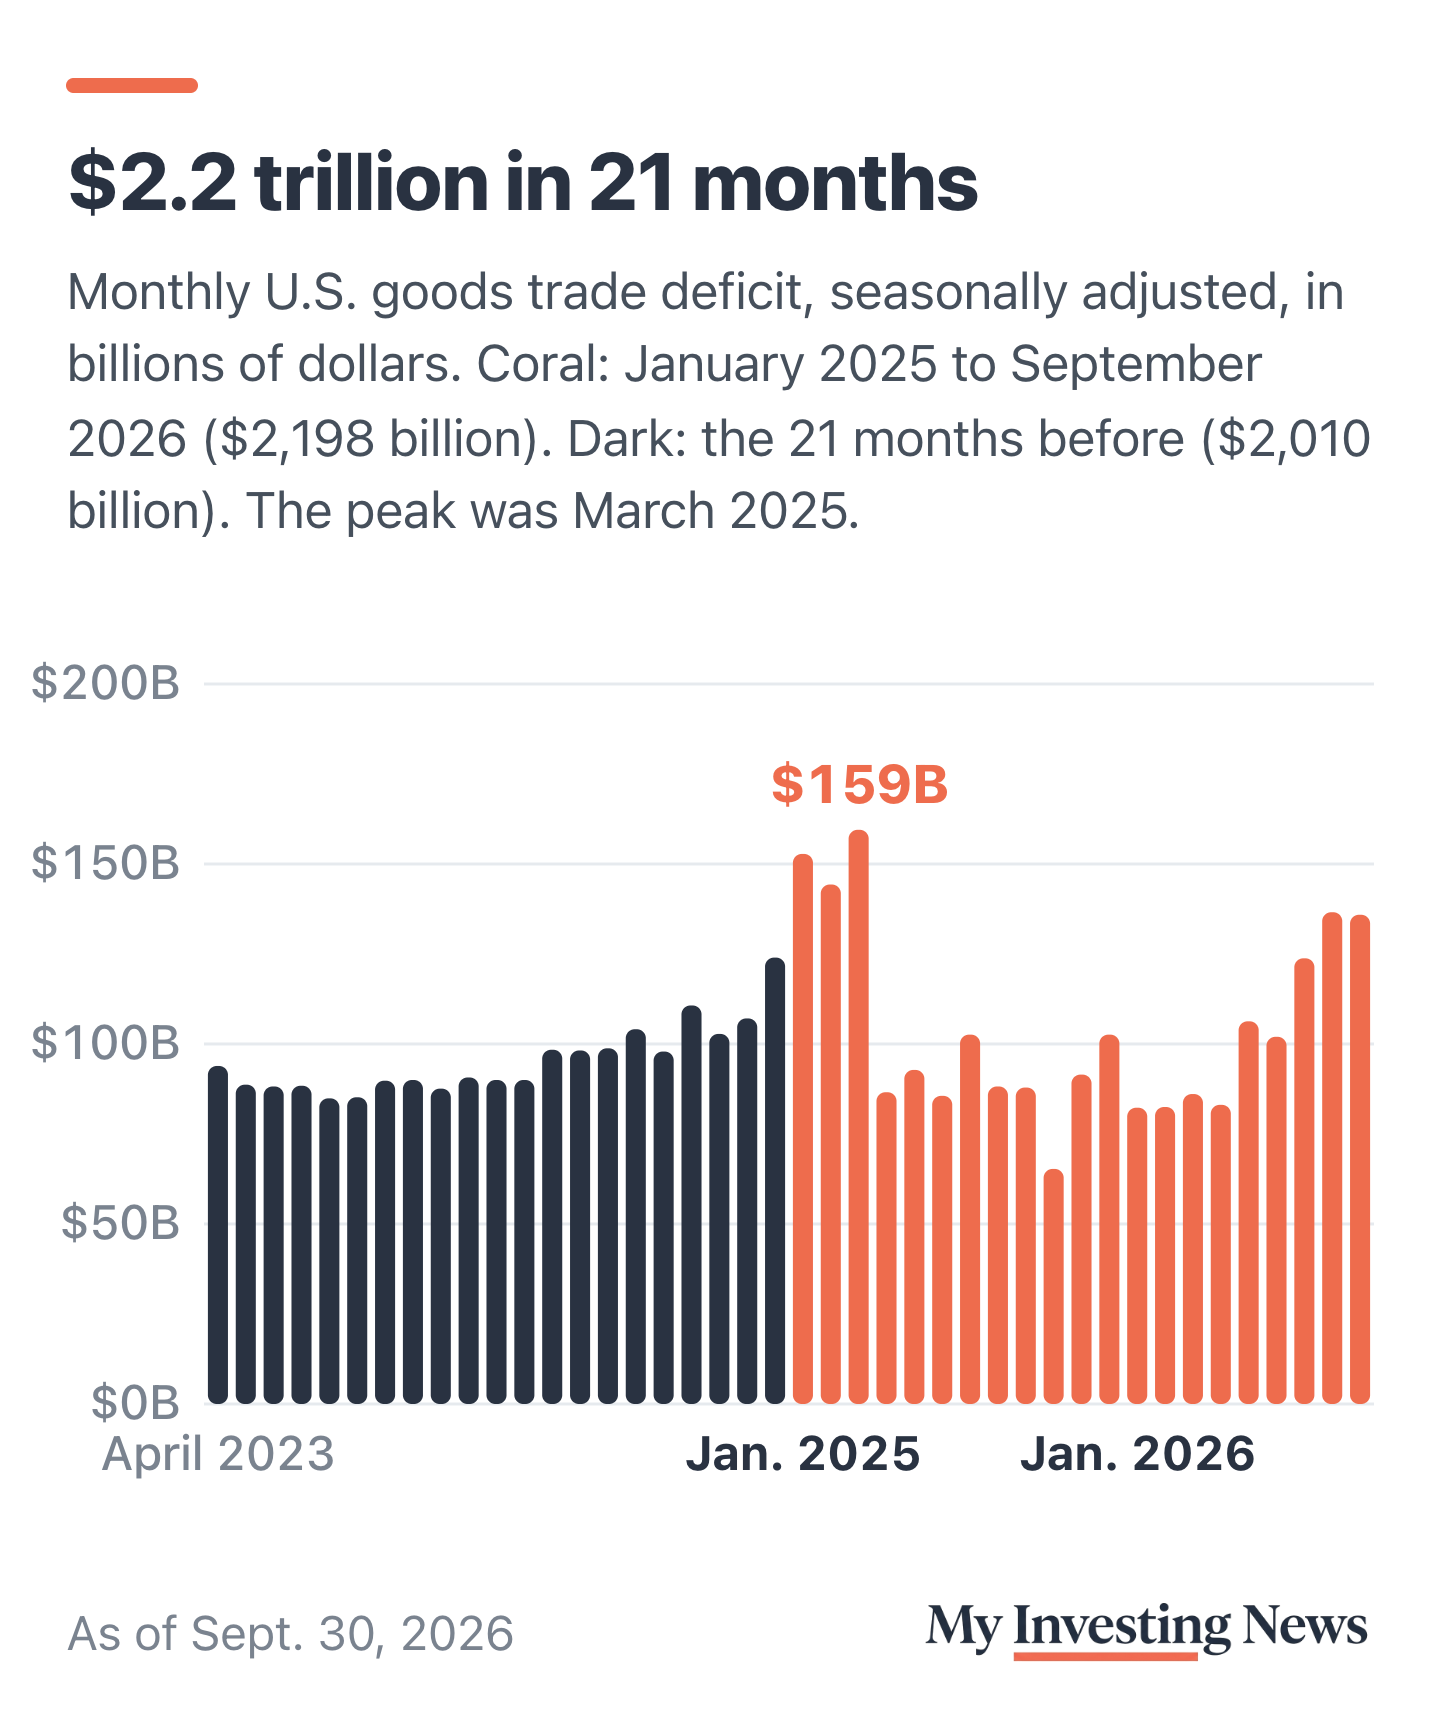
The monthly bars show where the extra deficit came from. Importers raced to beat the new duties in early 2025: the first quarter alone ran $456.5 billion, and March set the record at $159.5 billion. From April 2025 through June 2026, the deficit averaged $89.7 billion a month, below the $95.7 billion average of the earlier window. Then it jumped. July through September 2026 averaged $132.1 billion a month, and goods imports reached $346.9 billion in September, a monthly record above even March 2025’s $342.3 billion. Tariffs did narrow the gap for a stretch. The front-running at the start and the surge this summer more than made up for it.
The goods deficit, two 21-month windows, as of Sept. 30, 2026
Measured Against the Economy, the Deficit Held Steady
A bigger economy buys more from abroad, so the dollar total tells only part of the story. Nominal GDP over the seven quarters of the recent window was 9.6% larger than over the seven quarters before. Measured that way, the goods deficit was 3.99% of GDP in the earlier window and 3.98% in the recent one. In other words, it grew about as fast as the economy did. Tariffs did not make it smaller, which is Bilello’s point, and the deficit did not balloon either.
The administration’s own paperwork says much the same. On Feb. 20, 2026, the Supreme Court ruled that the International Emergency Economic Powers Act does not authorize the president to impose tariffs, ending the duties built on it. The same day, President Trump signed a proclamation placing a 10% surcharge on most imports for 150 days under a 1974 trade law, citing the deficit. “In 2025, the United States goods trade deficit remained at approximately $1.2 trillion,” the proclamation said. Our sum of the monthly data puts it at $1.26 trillion in 2025, up from $1.21 trillion in 2024.
Sixty-Six Years of Tariffs and Trade
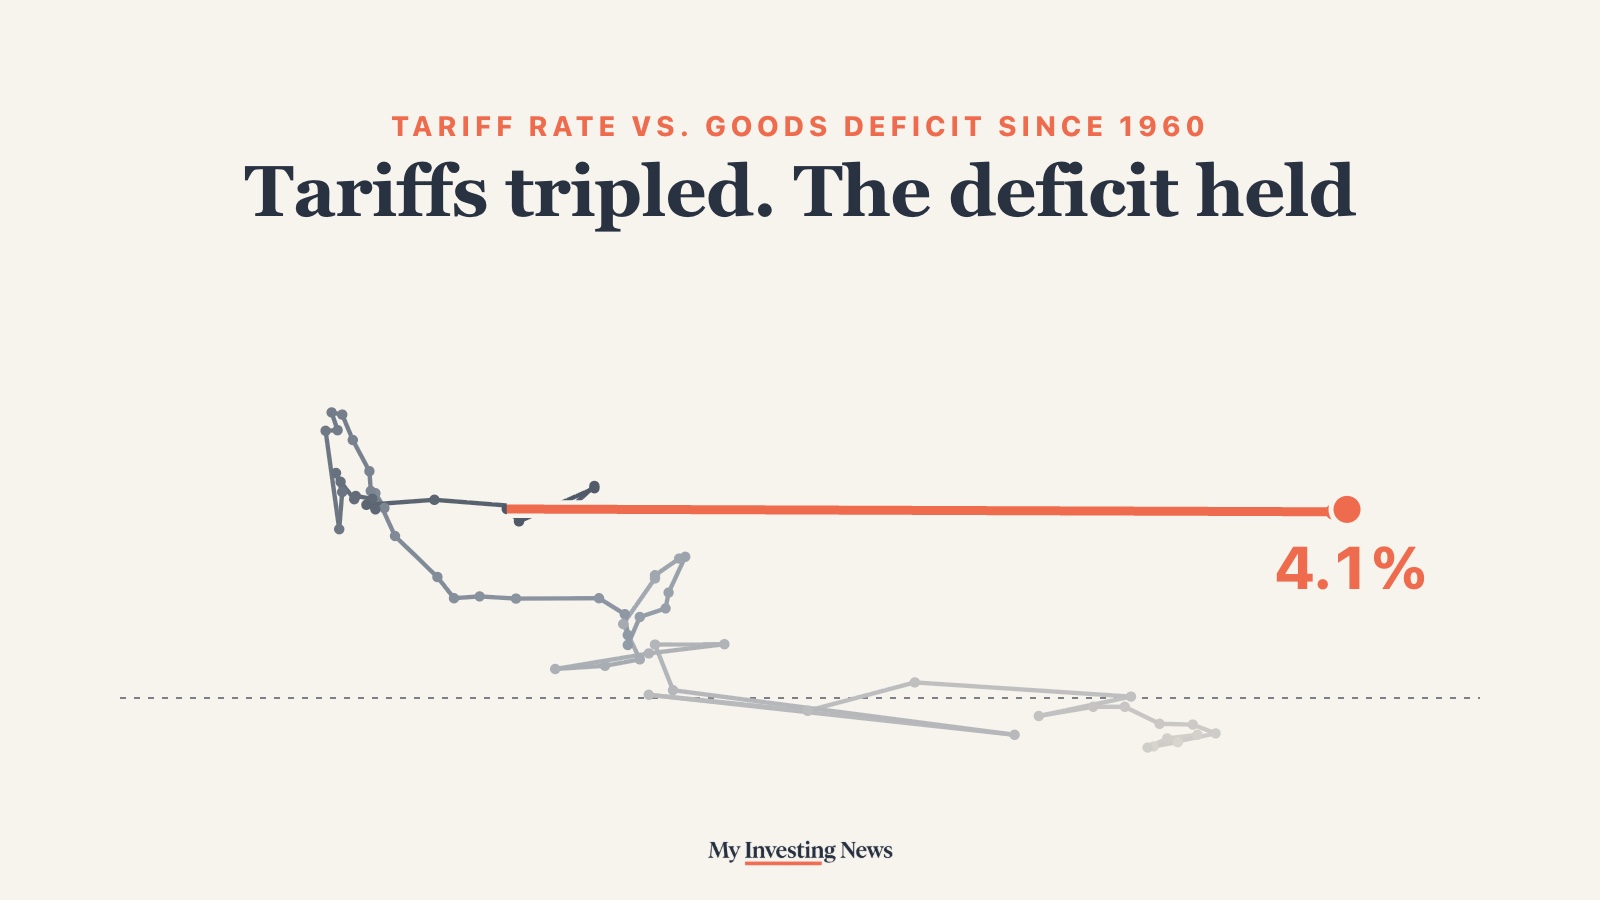
Over the long run, tariffs and the goods deficit have moved in opposite directions. In 1960, customs duties came to 7.0% of the value of goods imports, and the U.S. sold more goods abroad than it bought. The first annual deficit in that record came in 1971. By 2006, the tariff rate had fallen to 1.4% and the goods deficit had reached 6.2% of GDP, the widest in the series.
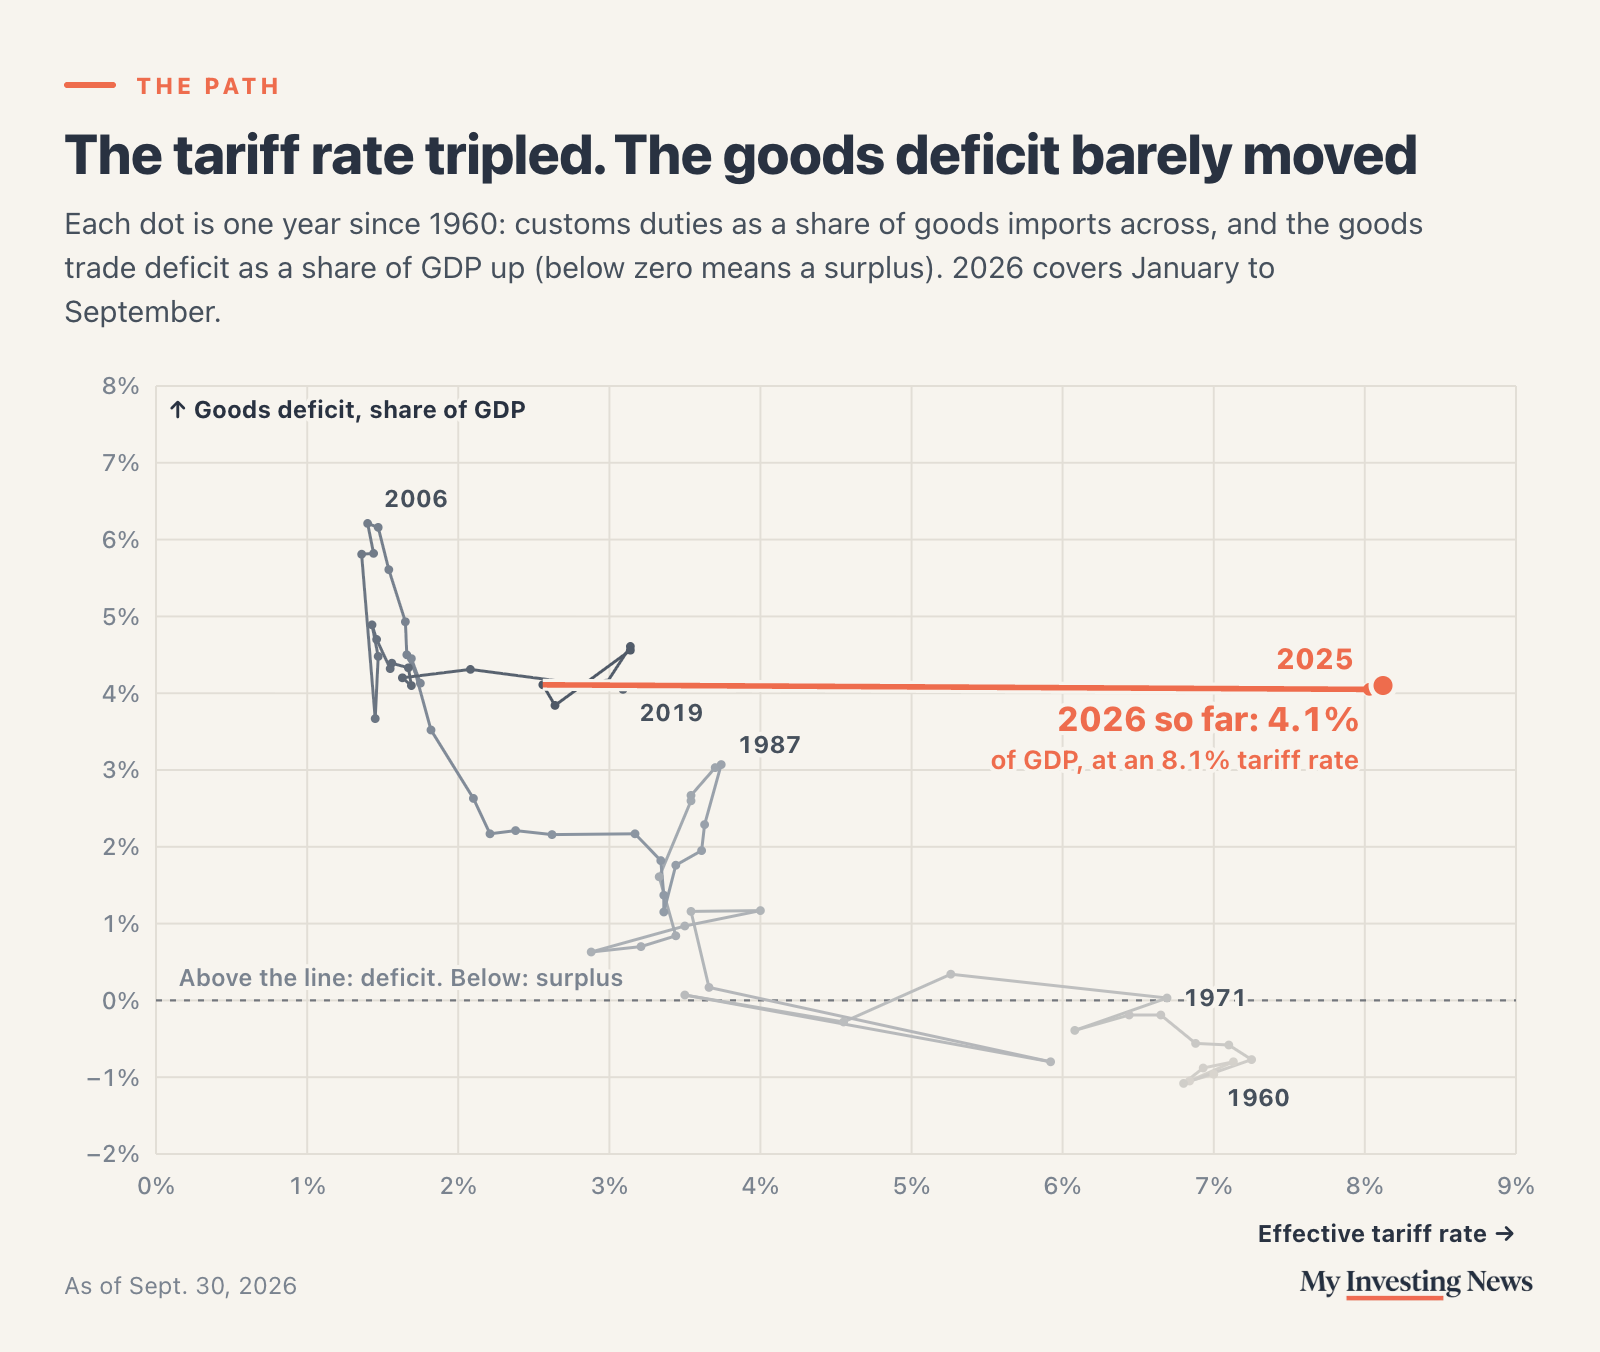
Running that history backward has not worked so far. The 2018 and 2019 tariffs roughly doubled the rate, from 1.6% in 2017 to 3.1% in 2019, while the deficit stayed between 4% and 4.3% of GDP. This round tripled it, from 2.6% in 2024 to 8.0% in 2025 and 8.1% in the first nine months of 2026. That is the highest in BEA’s data, which start in 1959. By another measure that reaches back further, the rate is the highest since 1946. The deficit sat at 4.1% of GDP in 2024, 4.0% in 2025 and 4.1% so far in 2026.
Tariff collections have also slipped since the court ruling. Duties peaked at 11.3% of goods imports in the fourth quarter of 2025 and fell to 6.8% in the third quarter of 2026, when the goods deficit widened to 4.8% of GDP, the most since the front-running quarter of early 2025. Rates have kept changing product by product, too; CNBC’s Eamon Javers called one late-October set of Canada changes a roughly even swap. Who ends up paying is a separate question. Jim Cramer has called tariff-driven price increases a regressive tax on households earning $30,000 to $60,000.
What to Watch
The Census Bureau’s advance report on October goods trade is scheduled for Nov. 27, and the full October report for Dec. 8. Those will show whether the summer surge in imports carried into the fall. The test of Bilello’s point is simple: if the tariffs are working the way they were sold, the 21-month total should start to fall. So far, measured in dollars or against the economy, it has not.
Bilello’s math checks out: the goods deficit in the 21 months since January 2025 was 9.4% larger than in the 21 months before, at $2.20 trillion. Against a growing economy, it held at about 4% of GDP while the tariff rate tripled. Front-running in early 2025 and a record import month in September 2026 did most of the damage, so the next few trade reports will show whether the summer jump was a blip.