Where we heard itThe Clark Howard Podcast, “Ask an Advisor With Wes Moss,” Oct. 27, 2026. Wes Moss of Capital Investment Advisors, with host Christa DiBiase. Checked against S&P 500 data through the Oct. 27 close.
With October ending, Wes Moss took on the market’s calendar folklore. On The Clark Howard Podcast on Oct. 27, he said his firm had tested “sell in May and go away,” the idea that stocks do well from November to April and poorly from May to October. “A dollar grew to 20 bucks” for investors who sold in May and sat in Treasury bills, he said, while staying invested the whole time “grows to 41 bucks.” He also cited the January barometer: after a positive January, the rest of the year was positive 87% of the time.
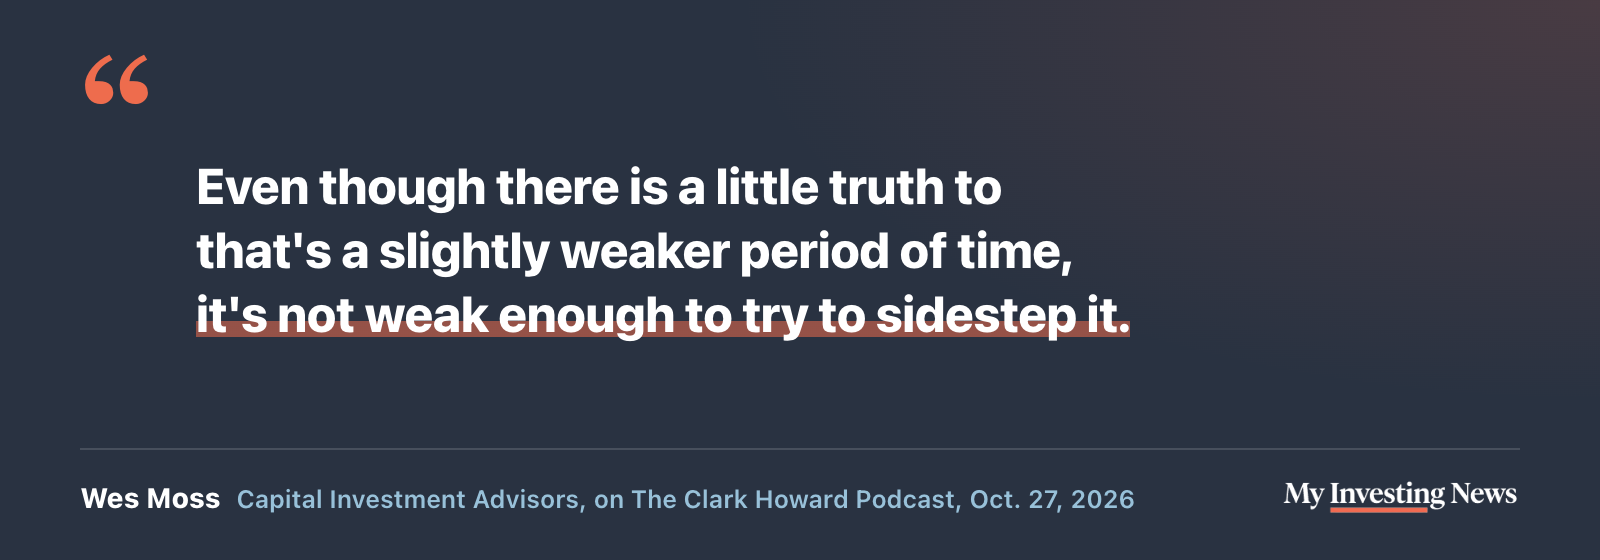
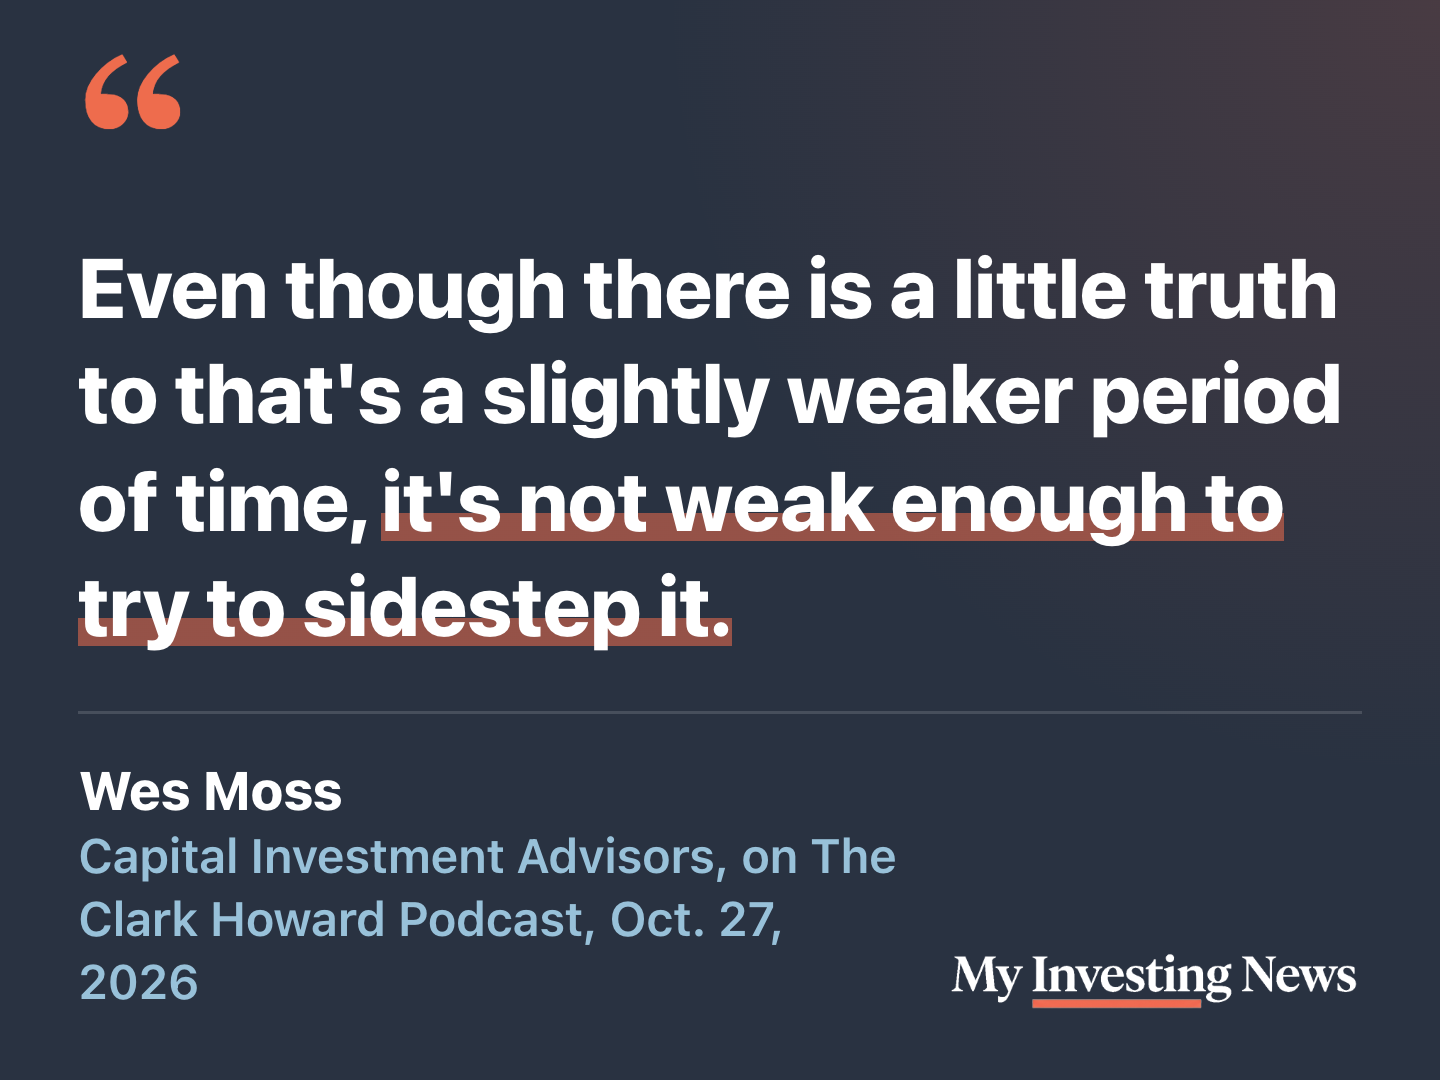
Moss’s point was that the seasonal pattern is real but too small to trade on. We rebuilt both tests from S&P 500 data, then ran them over the full record since 1950 and over the years after the pattern became famous.
Rebuilding the $1-to-$41 Test
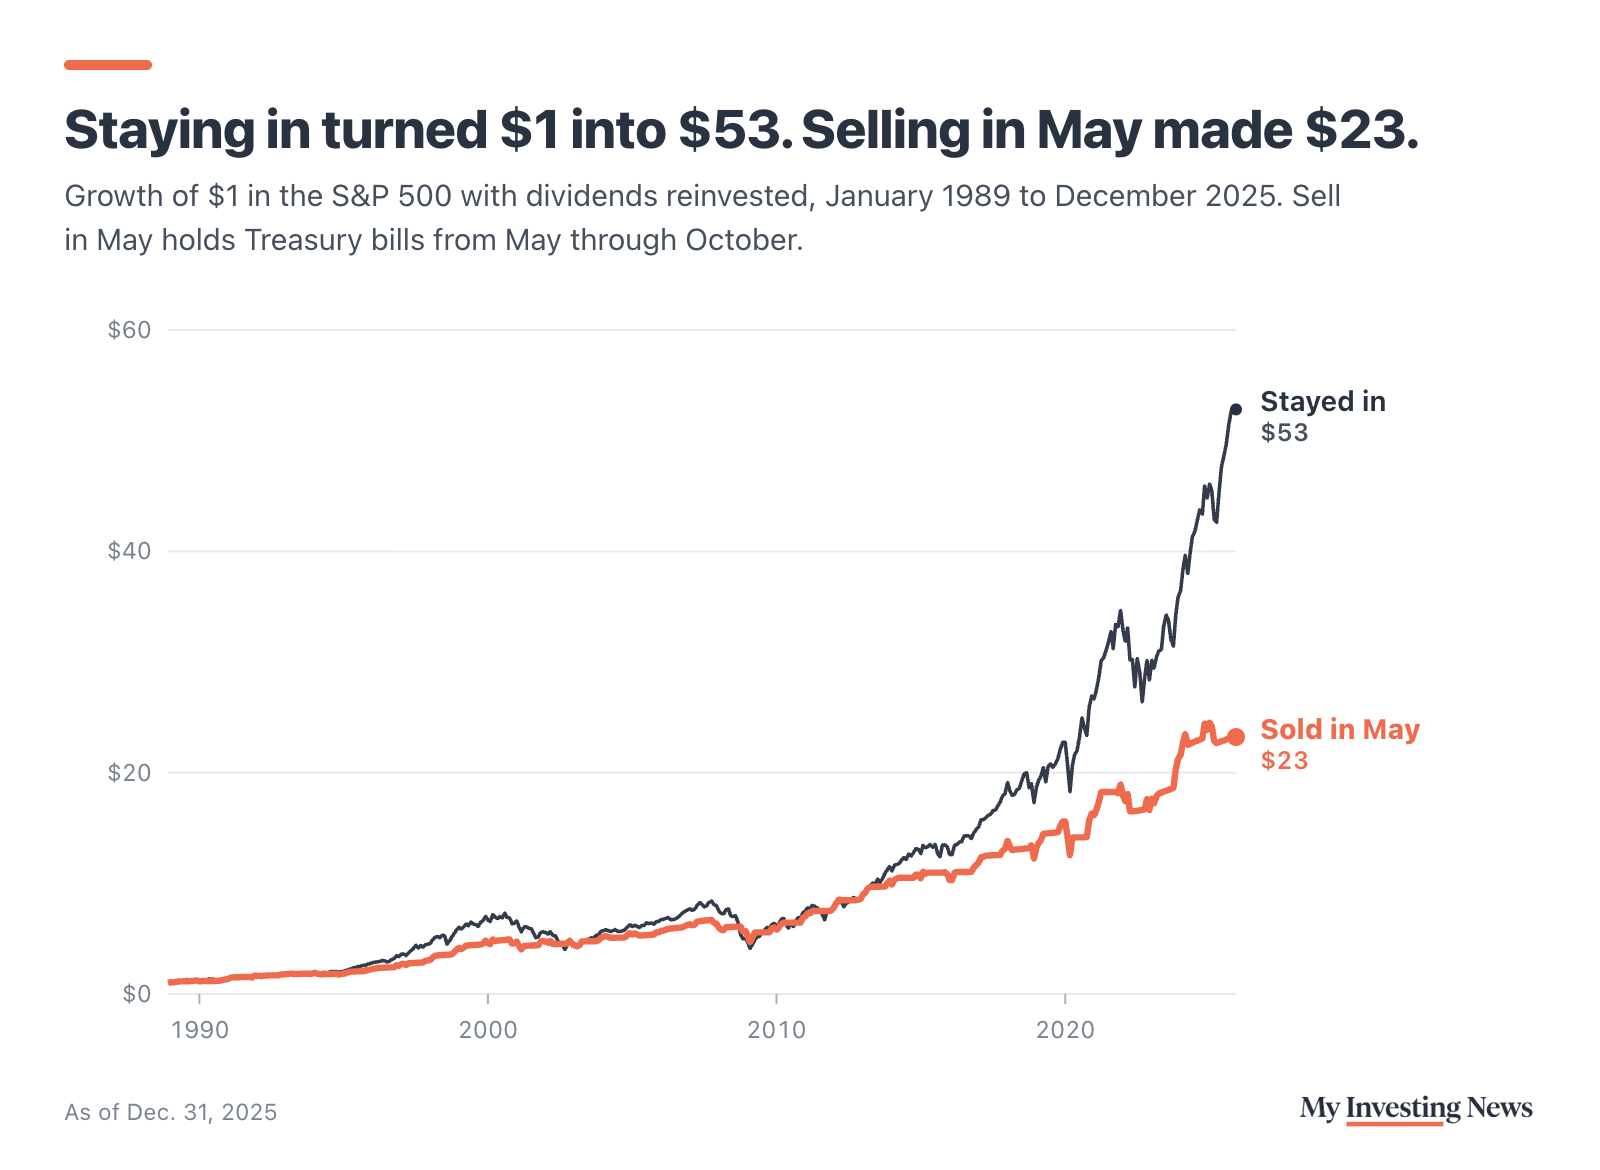
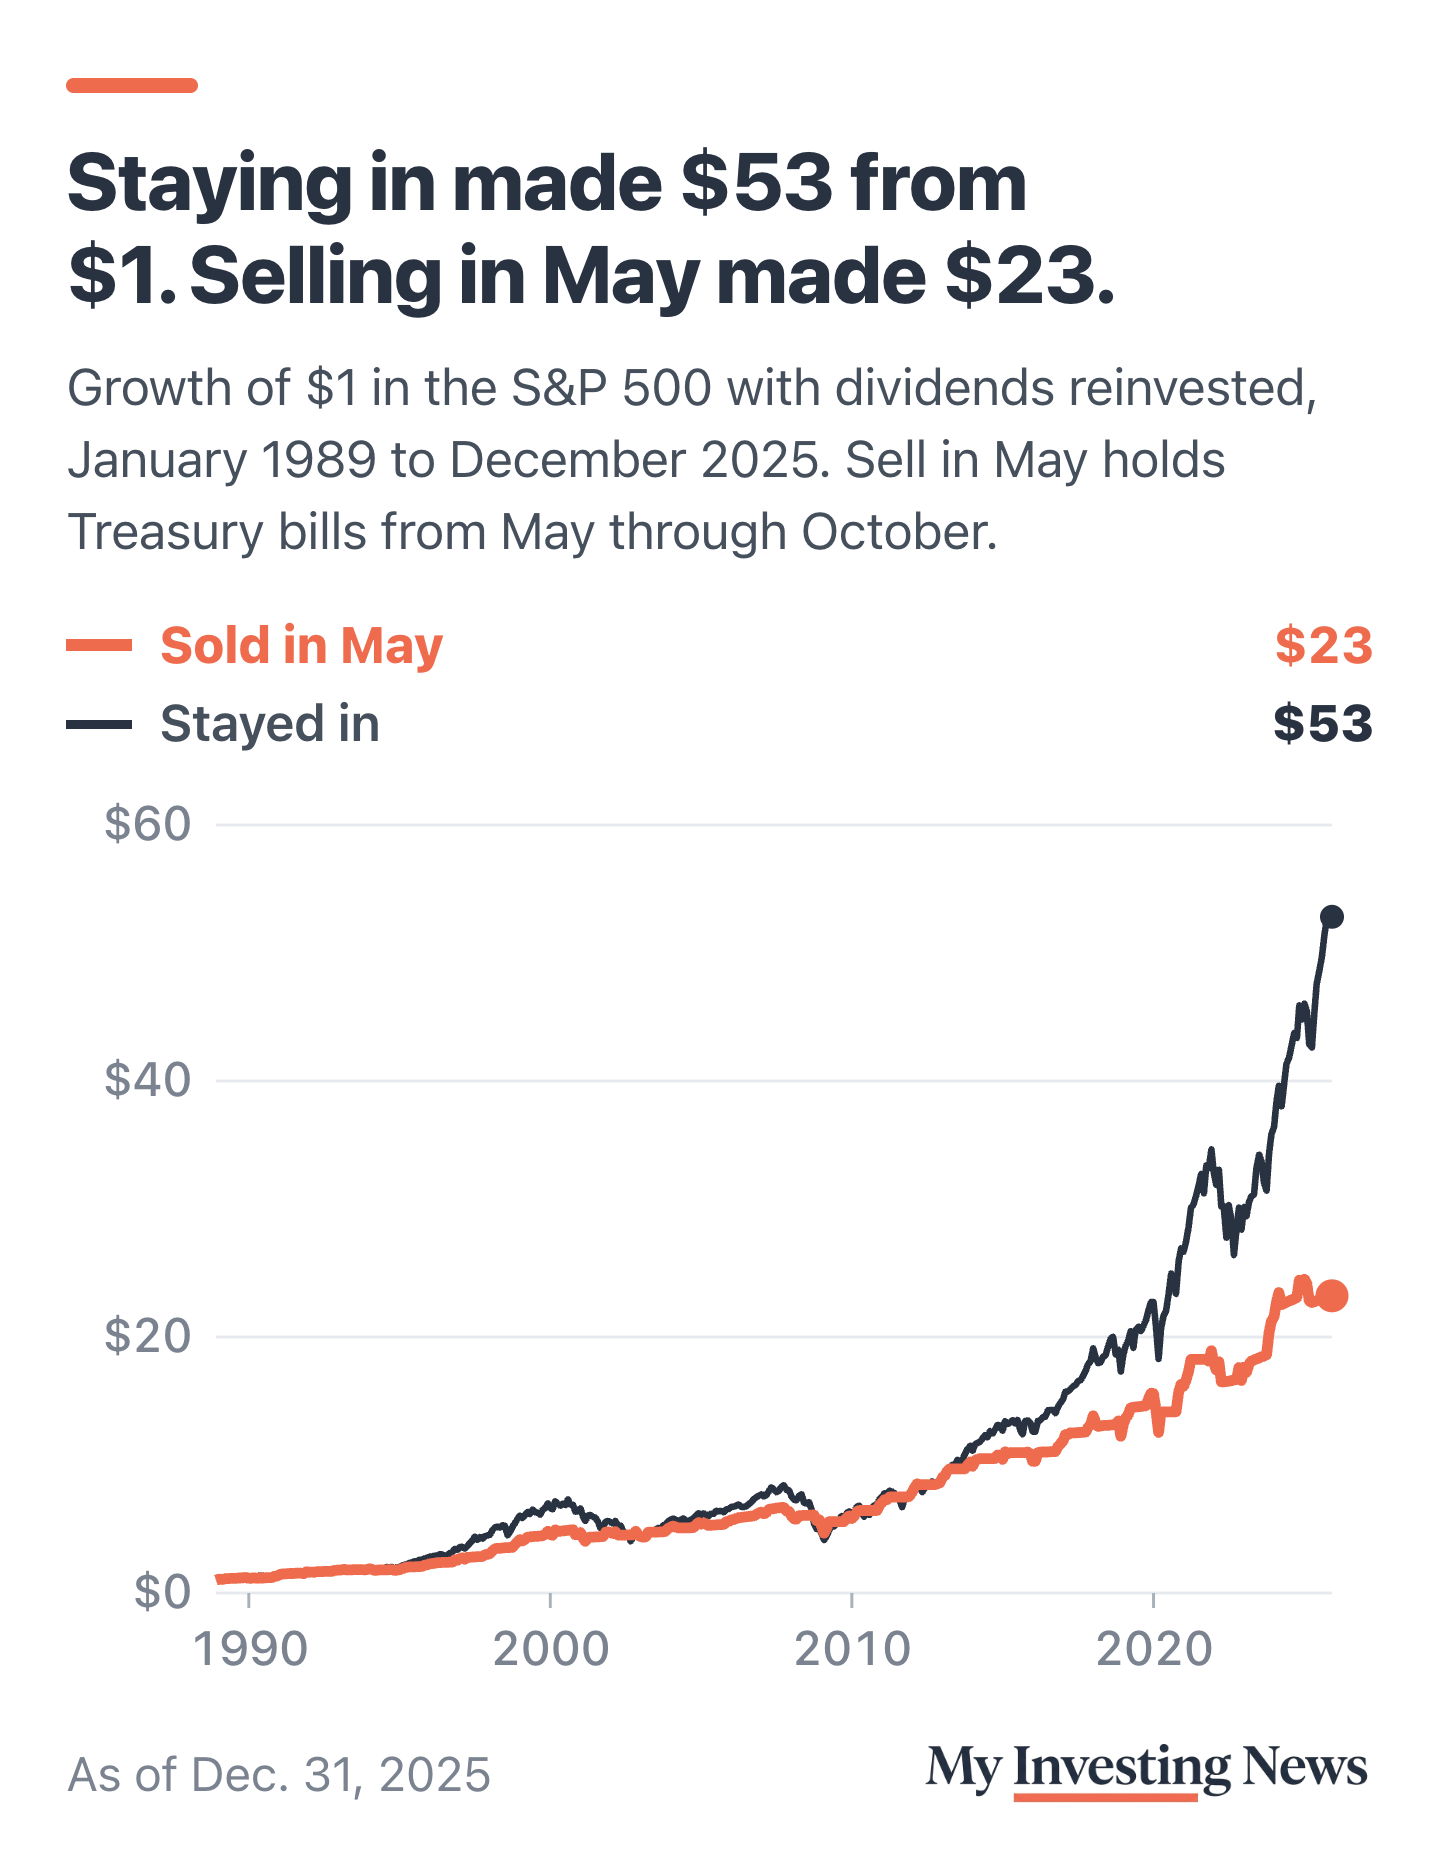
Moss said the sell-in-May numbers covered 1989 through 2025, with money parked in Treasury bills from May through October. We ran that exact test on the S&P 500SPY with dividends reinvested and the three-month Treasury bill rate for the months out of the market. Staying in all year turned $1 into $52.80, a compound return of 11.3% a year. Selling in May turned it into $23.20, or 8.9% a year.
Those yearly returns sit close to the “about 11%” and 8.6% averages Moss cited. We could not reproduce his dollar figures exactly, and they are low for his own averages: at 11% a year for 37 years, $1 grows to about $48. The gap may come from a different index or window. On price alone, without dividends, the results were $24.60 and $15.90. Every version we ran agrees with his conclusion: over his period, staying in left an investor with more than twice as much.
The Full Record Since 1950
Moss’s “little truth” holds up over a longer stretch. From November 1950 through October 2025, a span of 75 years, the S&P 500’s price rose an average of 7.0% from November to April and 2.0% from May to October. The winter half beat the summer half in 54 of those 75 years.
The weaker half still made money in most years, so selling had a cost. Once dividends are counted, the summer months beat Treasury bills in 49 of the 75 years. Over the whole stretch, $1 left in all year grew to about $3,451, versus $1,603 for an investor who sold every May and bought back every November.
Moss’s comments on the fall months also check out. From 1928 through 2024, the window he cited, September was the S&P 500’s weakest month on average, −1.2%, and one of only two with an average loss, along with February. October averaged a gain of 0.5% and rose in 57 of 97 years, even with the 21.8% drop of October 1987 and the 16.9% drop of October 2008 in the record.
Moss’s numbers, rechecked
After the Research Came Out
The best test of a market pattern is what happens after people learn about it. Economists Sven Bouman and Ben Jacobsen documented the effect in a 2002 paper in the American Economic Review, using data from 1970 through 1998. So we split the record there.
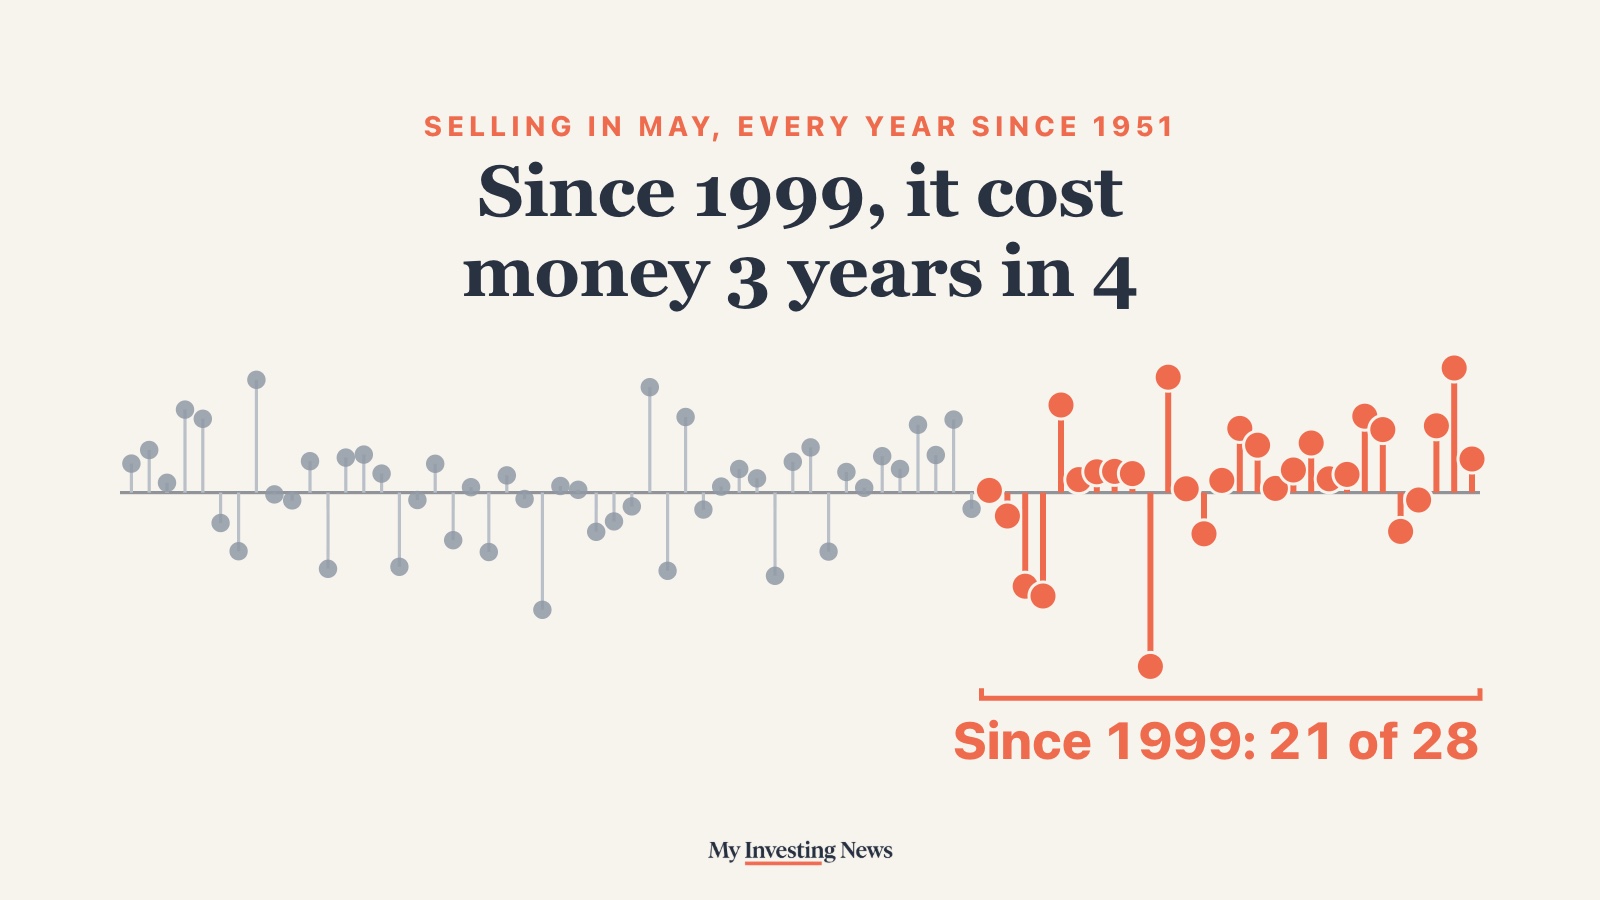
Through 1998, staying in from May to October beat Treasury bills in 29 of 48 years. From 1999 on, it did in 21 of 28, counting 2026 through Oct. 27. The winter half still did better on average after 1998, 5.6% against 2.4%, so the pattern didn’t vanish. What changed was the alternative: Treasury bills paid an average of 1.0% over each May-to-October stretch after 1998, against 2.7% before, so sitting out the summer cost more.
Since 1999, staying in from May to October beat Treasury bills in 21 of 28 years. Before that, it did 29 times in 48.
Each dot is one year: the S&P 500’s May-to-October total return minus what Treasury bills paid. Above zero, selling in May cost money. Coral: 1999 on, after the years the 2002 Halloween study tested. 2026 runs through Oct. 27.
The worst summer to stay in was 2008, when stocks trailed Treasury bills by 30 points from May to October. Years like that keep the idea alive, but they have been rare. Cboe’s JJ Kinahan has said the first question for a cautious investor is how much they can lose. In the summer months, sitting out has usually cost more than staying in.
The January Barometer, Checked
Moss’s January numbers match the record exactly. From 1950 through 2025, January rose in 46 years, and the S&P 500 gained from February through December in 87% of them, by an average of 12.2%. After the 30 down Januaries, the rest of the year rose 60% of the time, by an average of 2.1%.
The pattern has also held since Yale Hirsch of the Stock Trader’s Almanac devised the barometer in 1972. From 1972 through 2025, an up January was followed by a positive rest of the year 84% of the time and a down January 64% of the time. The catch is the down Januaries: the rest of the year still rose in 18 of those 30 years since 1950, so a bad January has been a weak sell signal.
What to Watch
This year fits the barometer and breaks the summer rule. January 2026 rose 1.4%, and from the end of January through Oct. 27 the S&P 500 gained another 11.3%. From the April 30 close through Oct. 27 it rose 7.1%, more than the 5.4% it gained from November 2025 through April. Carson Group’s Ryan Detrick still expected record highs by year end in mid-October; the index set its latest record close, 7,818.93, on Oct. 6.
These figures run through the Oct. 27 close, before the Fed’s Oct. 28 decision, the Nov. 3 midterms and the Nov. 6 jobs report. November starts the stronger half of the calendar, and midterm-year history points the same way. Moss’s advice is to know the patterns and not trade on them.
Moss’s conclusion holds: from 1989 through 2025, selling in May left an investor with less than half as much, $23.20 against $52.80 by our count. The seasonal gap is real, but stocks still beat Treasury bills in most summers, more often since 1998 than before. The January barometer’s numbers check out, though a down January has still been followed by gains 60% of the time.