Where we heard itThe Clark Howard Podcast, “Ask an Advisor With Wes Moss,” Nov. 10, 2026. Wes Moss of Capital Investment Advisors, with host Christa DiBiase. Checked against S&P 500 data through the Nov. 9 close.
The bull market just had a birthday, and Wes Moss doesn’t want anyone to treat it as a deadline. “The bull market has turned four years old,” he said on The Clark Howard Podcast on Nov. 10, noting that the average bull runs closer to five years, so “people start to get nervous around this year four.” His answer was to zoom out. If you don’t count every drop of 20%, he argued, the market has been rising since the 2009 low. Did the 2020 crash end a bull market? “Technically it does,” he said.
Moss added that the market has been “averaging a little over 16% per year” since 2009. We checked that figure and counted every decline of 10% or more from a record close since the March 9, 2009 low, with and without dividends and after inflation, to see how many times the “technically” rule would have ended the run and how long each drop took to heal.
The 16% a Year, Checked
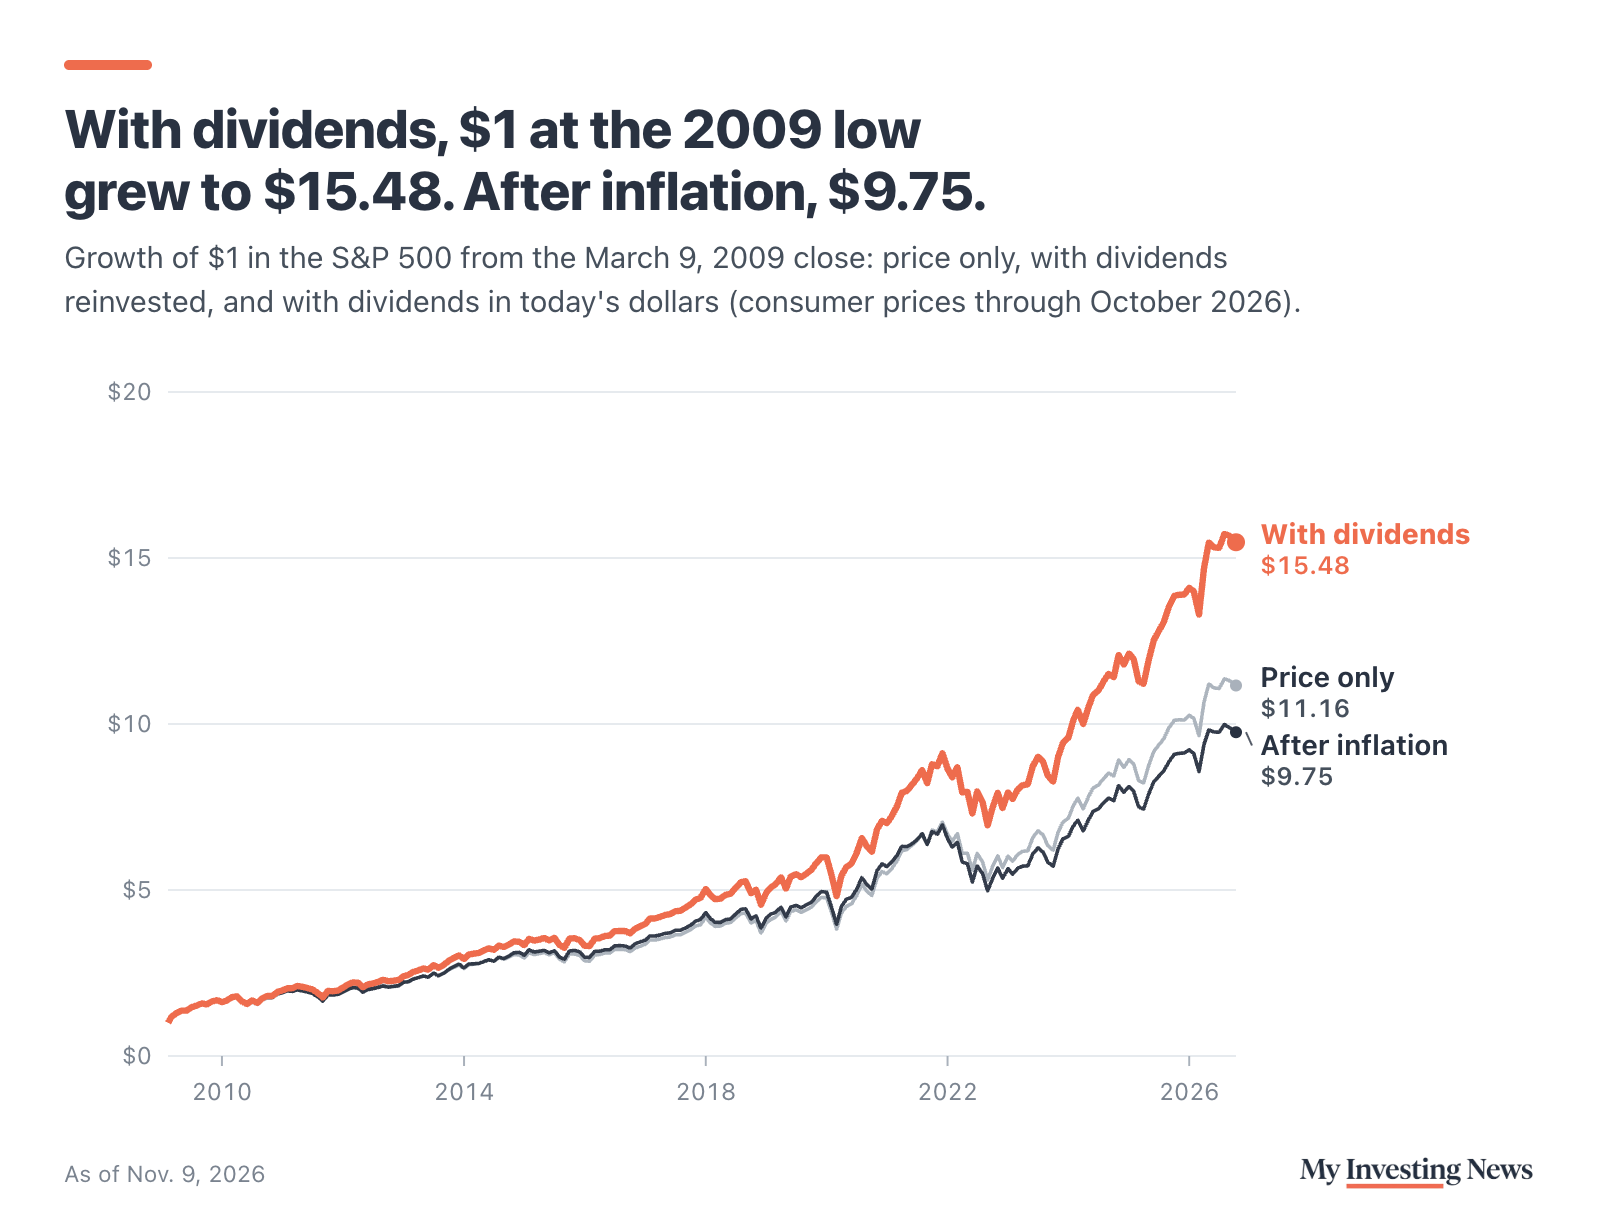
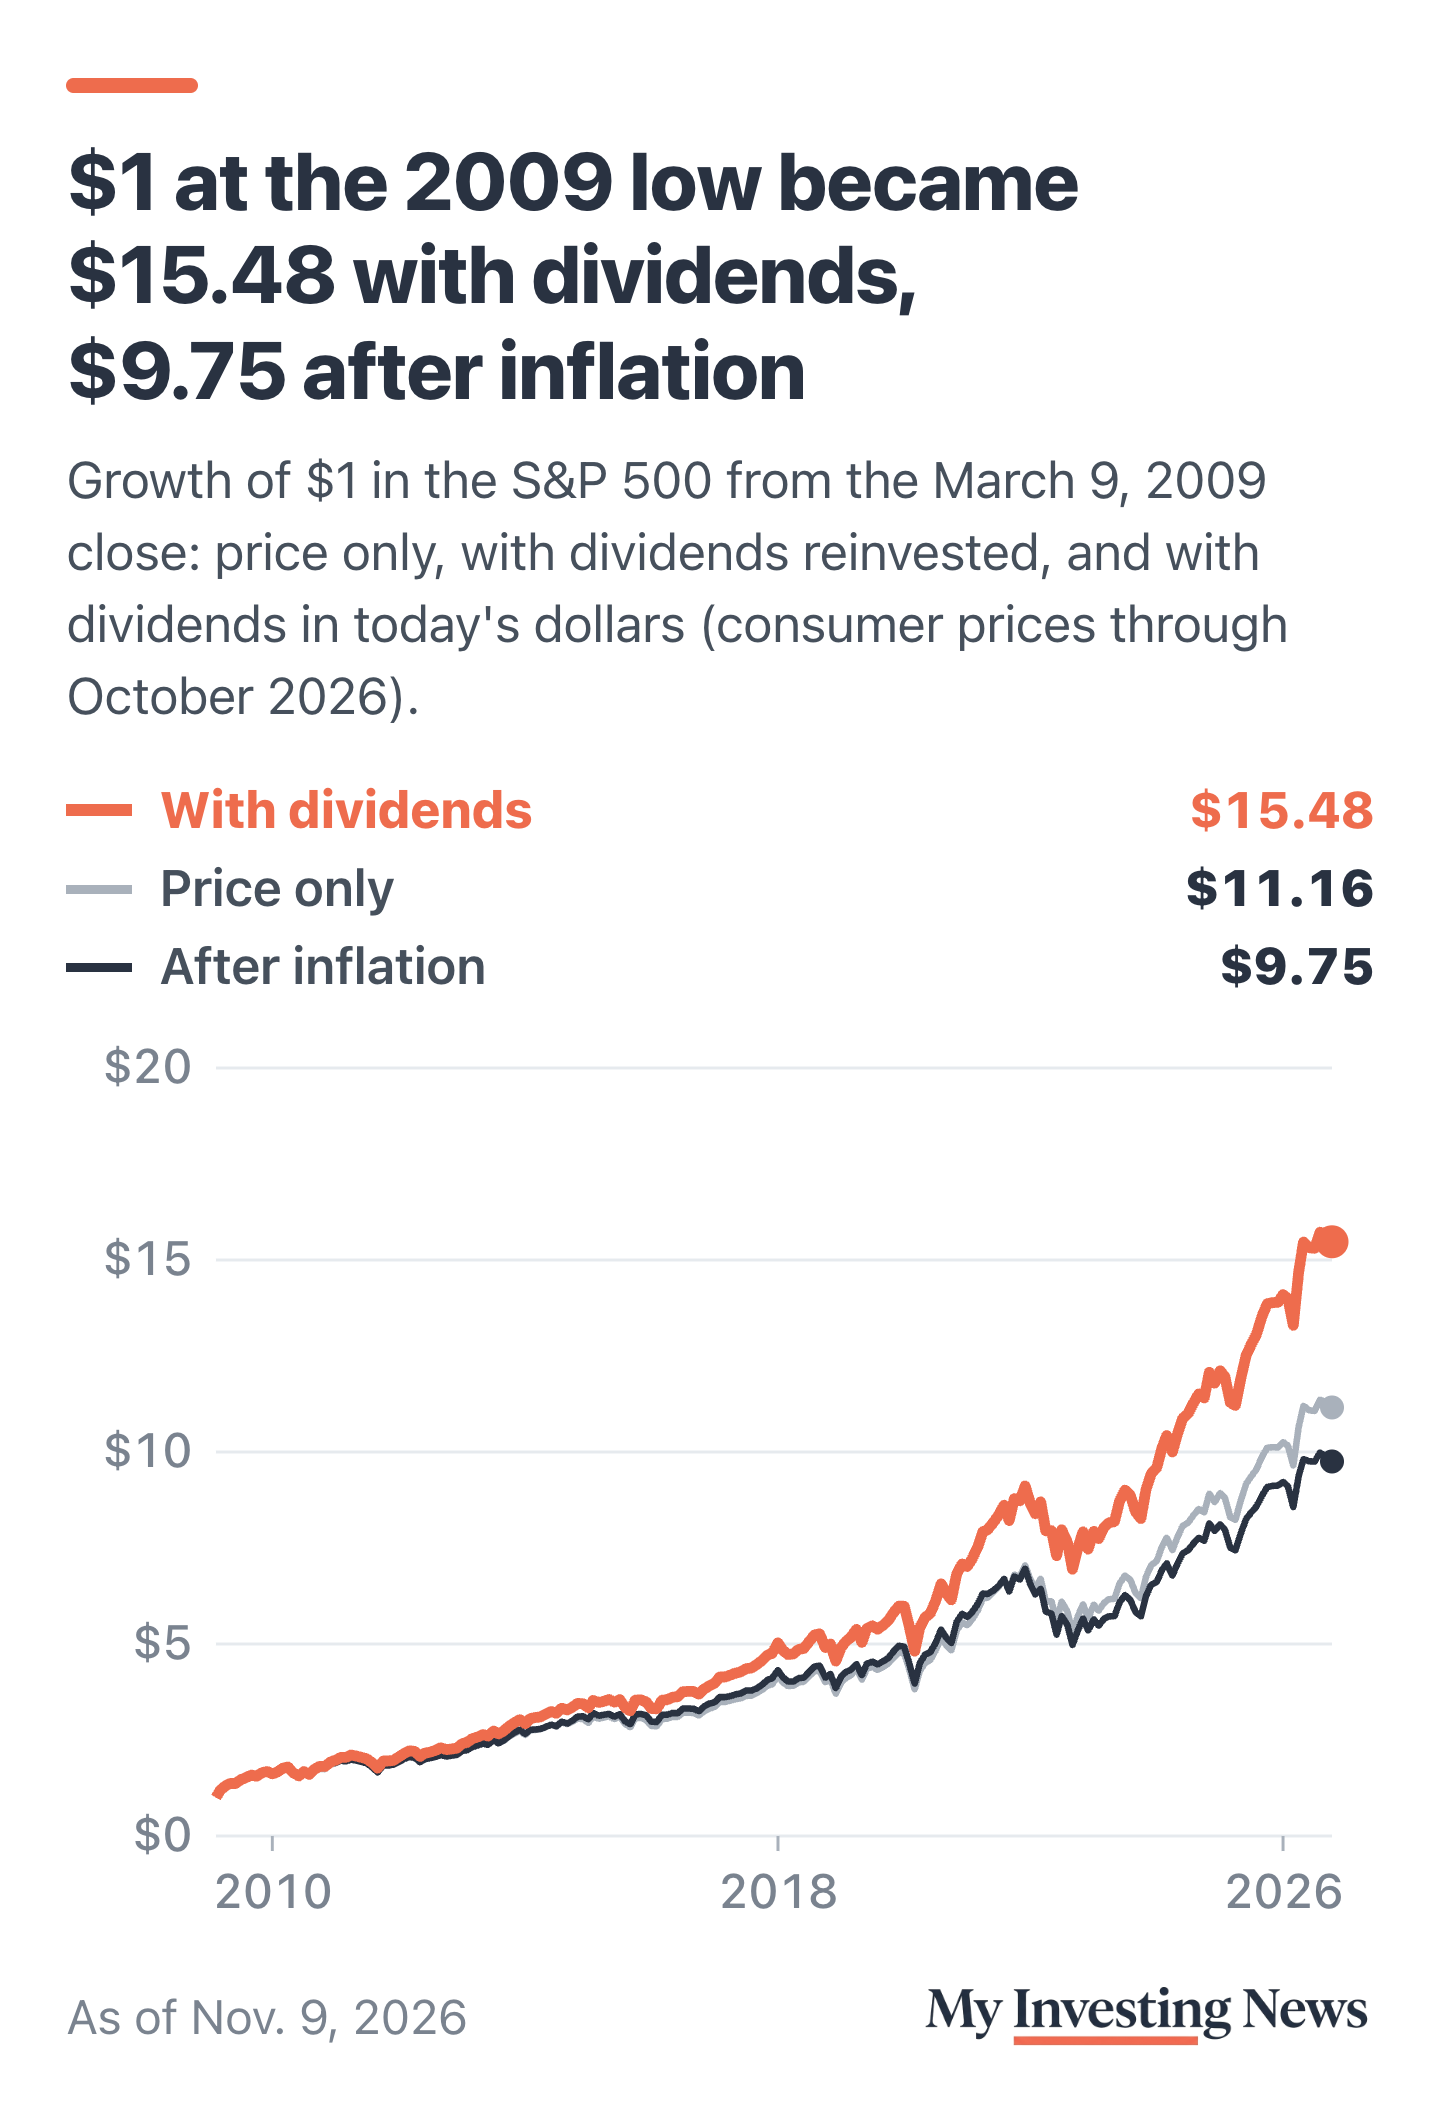
The S&P 500SPY closed at 676.53 on March 9, 2009, and at 7,549.94 on Nov. 9, 2026, a gain of 1,016%. On price alone that works out to 14.6% a year. With dividends reinvested, $1 grew to $15.48, or 16.8% a year, so Moss’s “a little over 16%” holds once dividends are counted.
Inflation takes a bigger bite. Consumer prices rose 59% from March 2009 through October 2026, the latest reading, which leaves $1 worth $9.75 in today’s dollars, about 13.8% a year. That is still well above the long-run 10% to 11% Moss used as his yardstick.
Moss also said a stricter reading would start the run in 2013. That checks out on price: the index didn’t close above its Oct. 9, 2007 record of 1,565.15 until March 28, 2013. With dividends, investors were back above the 2007 peak a year earlier, on April 2, 2012.
Two Bear Markets, Three Near Misses
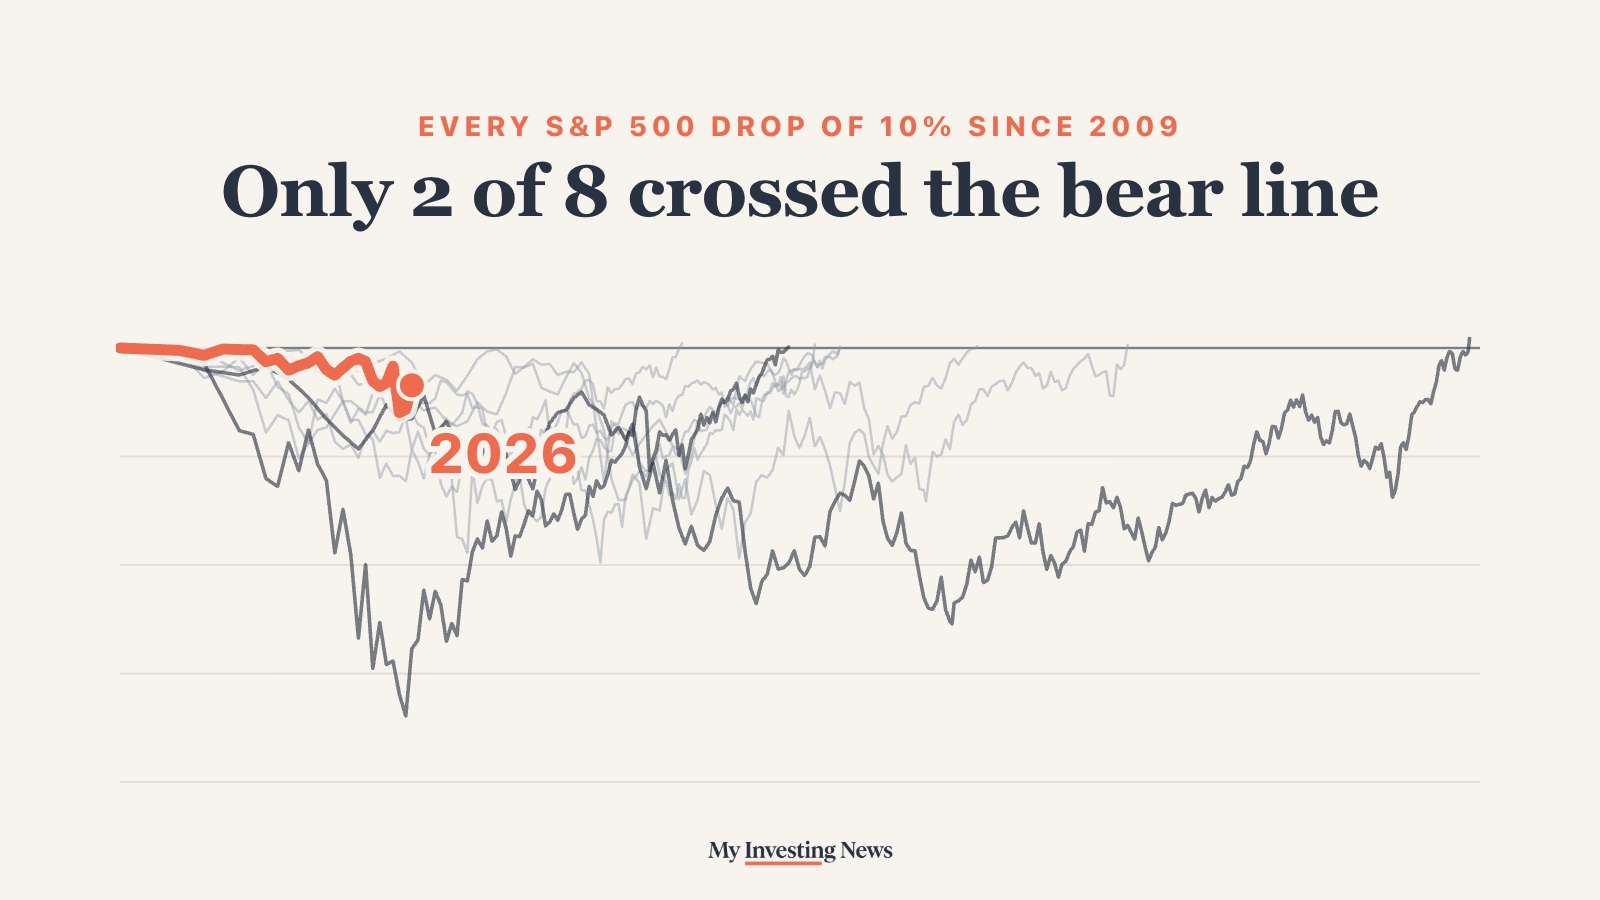
By the usual rule, a bear market is a drop of 20% or more from a record close. Since the 2009 low, the S&P 500 has had 8 declines of 10% or more from a record. Two crossed 20%: the 33.9% slide from Feb. 19 to March 23, 2020, and the 25.4% decline from Jan. 3 to Oct. 12, 2022. The current bull dates from that 2022 low, which is why it turned four in October. The index is up 111% since.
Three more stopped just short on a closing basis: 19.4% in 2011, 19.8% into Christmas Eve 2018 and 18.9% in the April 2025 tariff selloff. All three went past 20% during the trading day, by 21.6%, 20.2% and 21.3%. Count those swings and the 17 years hold five bear markets. The median decline of the 8 was 19.1%, a hair from the line.
Dividends and inflation don’t change the count. With dividends, and with dividends after inflation, the same two declines crossed 20% and the same three fell short. After inflation, 2022 was the deeper one, 29.3%. Diane Swonk recently looked at which bear markets came with a recession; of these two, only 2020 did.
17 years of S&P 500 declines
How Long Each Took to Heal
The two bear markets healed at very different speeds. The 2020 drop was the deepest and among the quickest: the S&P 500 set a new record on Aug. 18, 2020, 6 months after the old one and 5 months after the low. The 2022 decline took 24.5 months from record to record, ending Jan. 19, 2024, and 15 months from the low. With dividends it was 23.3 months. After inflation it was 26.7 months, into March 2024.
Of the S&P 500’s 8 drops of 10% or more since 2009, 2 crossed 20%. Three stopped just short.
Every S&P 500 decline of 10% or more from a record close since March 2009, drawn from the record until the index set a new one. The two that crossed 20% are dark. The current dip, from the Oct. 6 record, is coral.
None of the other six took longer than the 14 months of the 2015 to 2016 slump, and the 2025 drop was erased in about 4. That matters for the cash cushion Moss described in the same episode. A caller said Moss often talks about holding three years of “dry powder.” Moss said a 5% drop is “totally normal, garden variety,” that at 10% retirees can “start to lean on your dry powder at least a little bit,” and that the cushion is “really meant for that 20% or greater decline.” Since 2009, no trip back to a record has taken longer than three years, even after inflation.
Moss’s own example of a true bear market is the counterpoint. The S&P 500’s March 24, 2000 record close wasn’t topped until May 30, 2007, more than seven years later, and the 2007 peak took until 2013. Moss also told listeners to watch the S&P 500 rather than the tech-heavy Nasdaq, whose declines have run deeper: the Nasdaq-100 fell 35.6% from its November 2021 record in the 2022 bear market.
What to Watch
The index set its latest record close, 7,818.93, on Oct. 6. It fell 6.0% by the Nov. 5 close, after the midterm elections, and finished Nov. 9 3.4% below the record. That is well short of the 10% Moss treats as the point to start drawing on cash. On Wednesday, Nov. 11, Veterans Day, the stock market is open while the bond market is closed, following SIFMA’s holiday schedule.
Two weeks earlier, Moss put another piece of market folklore, sell in May, up against the record. By the strict rule, this bull is four years old. By his measure it is 17. The data supports both readings: two bear markets, three near misses, and a new record within about two years after every drop.
Moss’s 16% a year holds with dividends: $1 at the March 2009 low became $15.48 by Nov. 9, 2026, or $9.75 after inflation. The run had two closing drops of 20% or more and three that missed by less than 1.2 points, and the longest wait for a new record was 24.5 months. The risk is that the 17-year view starts at a historic low: from the 2000 record, the wait was more than seven years.