Where we heard itSteve Eisman, host of The Real Eisman Playbook, episode “Why Young Americans Feel Locked Out with the Lemonade Stand Podcast,” Nov. 2, 2026.
Steve Eisman, the investor who bet against subprime mortgages before the 2008 crash, says someone at a speech he gave in Toronto a few weeks ago asked him whether this is a good time to buy a house. “And I said, no,” he told listeners of his podcast on Nov. 2. He went on to say that “the days of buying a house under the assumption that that will be a creator of wealth are done for a very long time.” Then he went a step further:

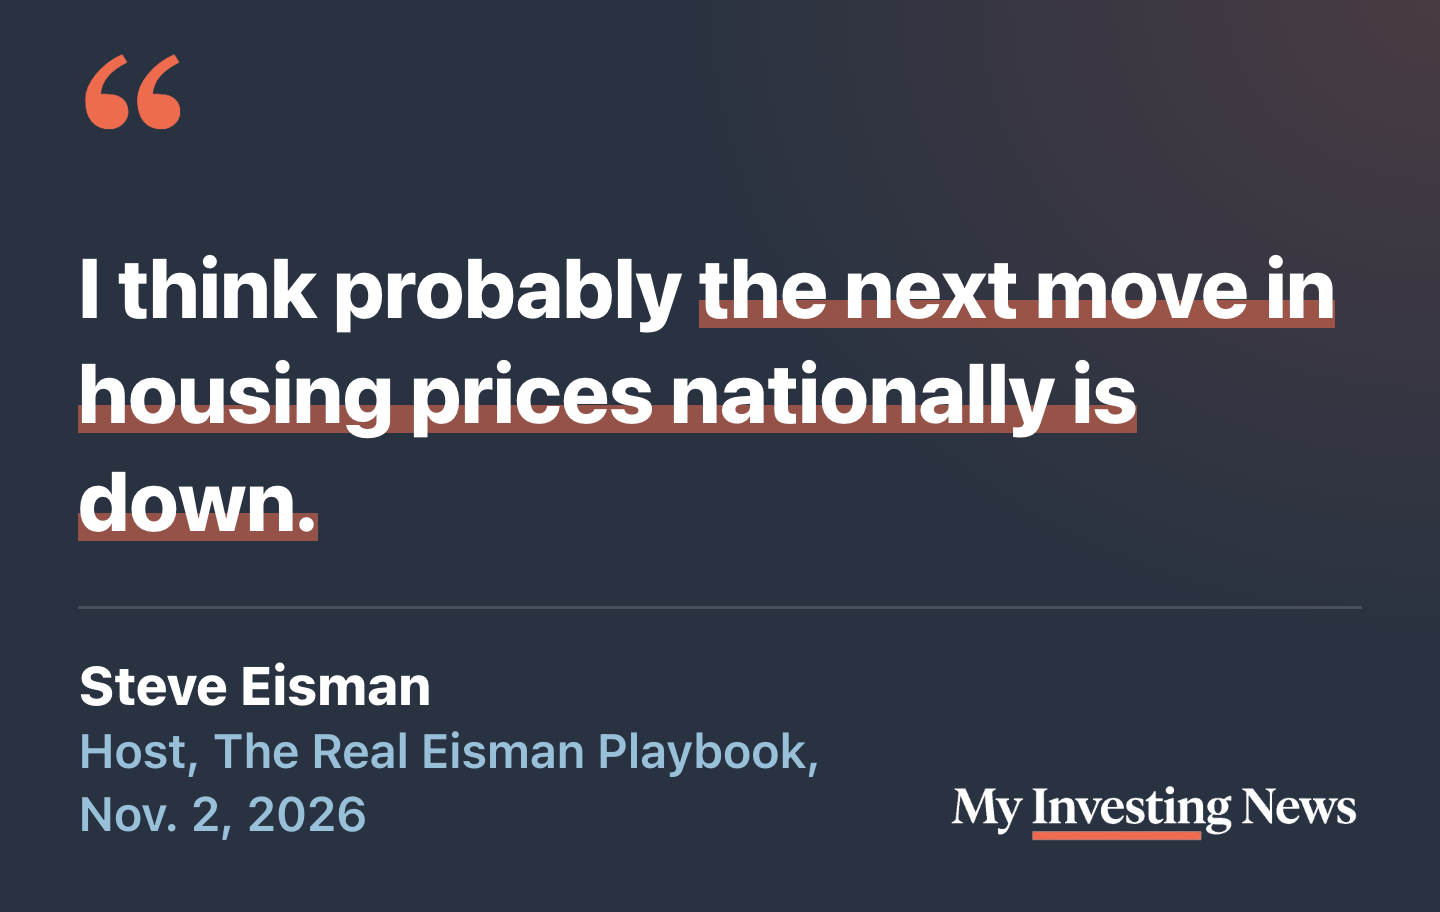
That is a call on something that has rarely happened. We checked it against the record of national home prices back to 1890, his claim about the cost of buying, and the equity owners have built up since the last bust.
Where Prices Stand
The S&P Cotality Case-Shiller U.S. National Home Price Index, the broadest monthly measure, dipped 0.15% in August from its July record. That is the usual late-summer cooling. On a seasonally adjusted basis, the index set another record in August. Prices were up 2.1% from a year earlier and 25.3% over five years.
What has changed is the cost of money. Freddie Mac’s average 30-year mortgage rate was 7.18% as of Nov. 5, after mortgage rates climbed to a 52-week high in early October. It averaged 2.87% in the summer of 2021.
Eight National Declines Since 1890
Yale economist Robert Shiller’s long-run home price series, joined to Case-Shiller data after 1975, shows eight stretches since 1890 when the yearly average of national prices fell 1% or more below an earlier peak. Five of them came before 1925. The deepest ran from 1925 to 1933, a 30.5% drop that took until 1944 to recover.
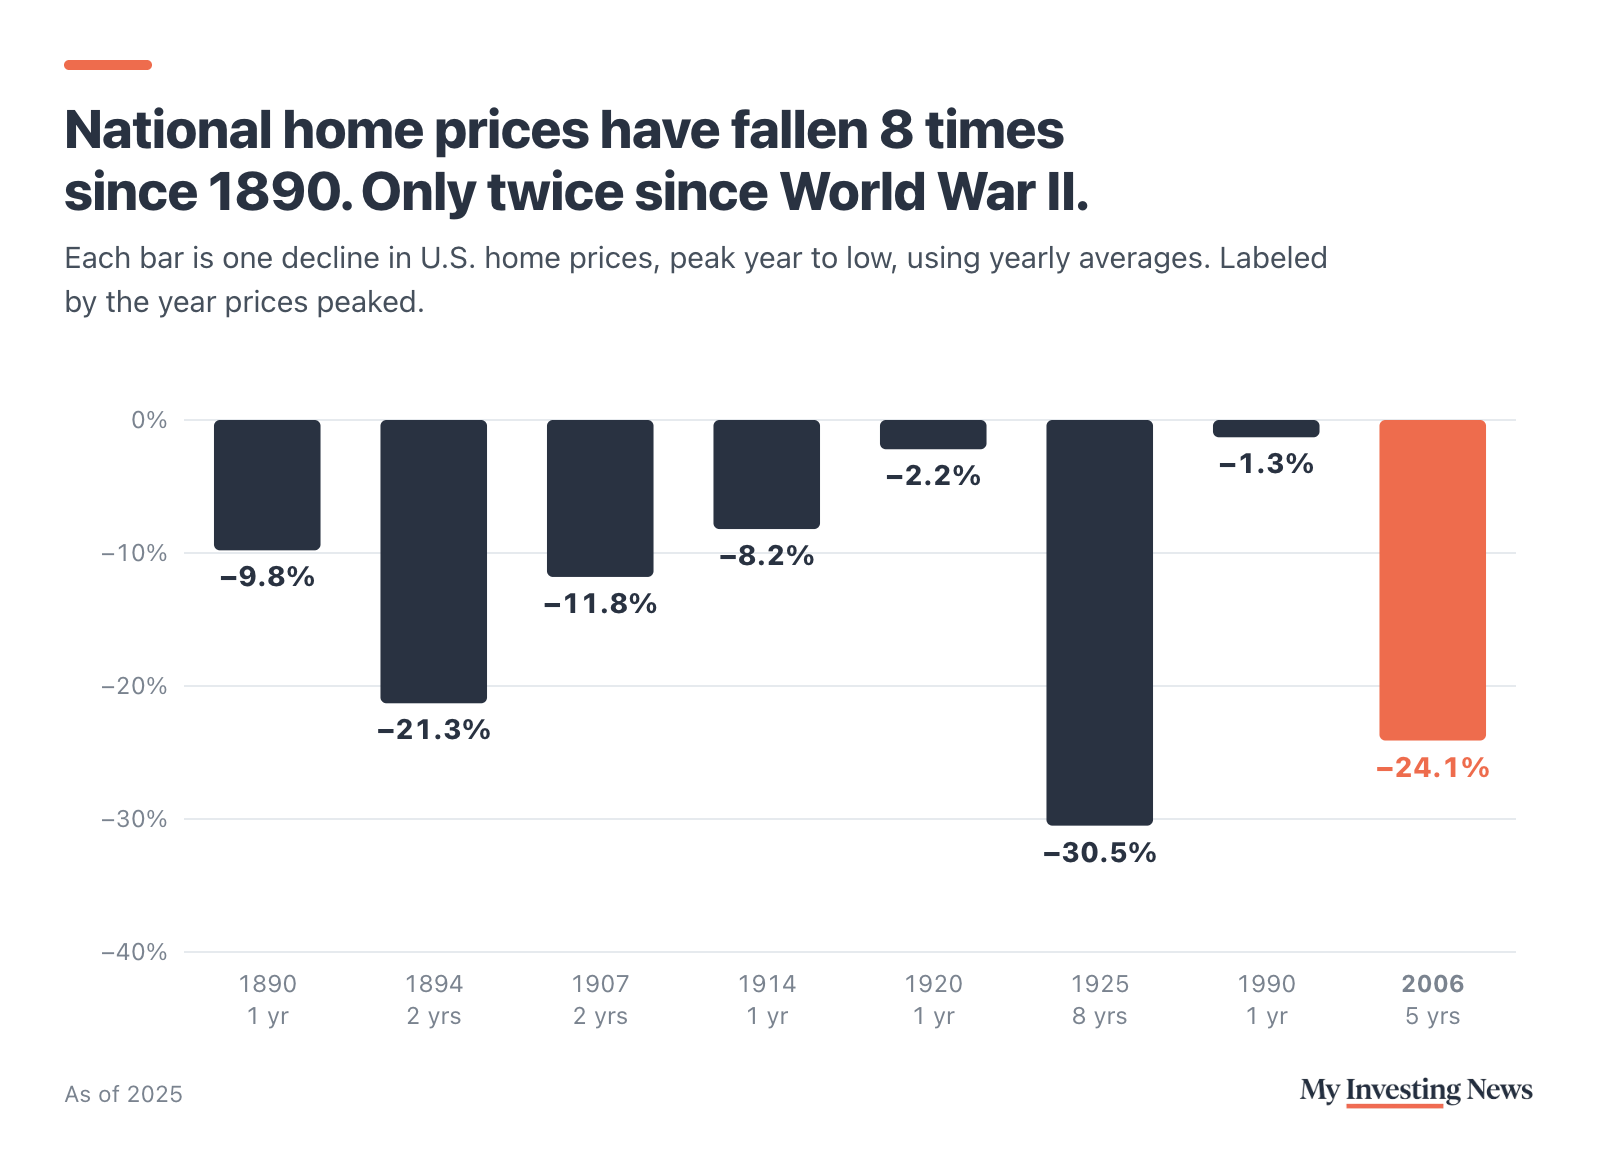
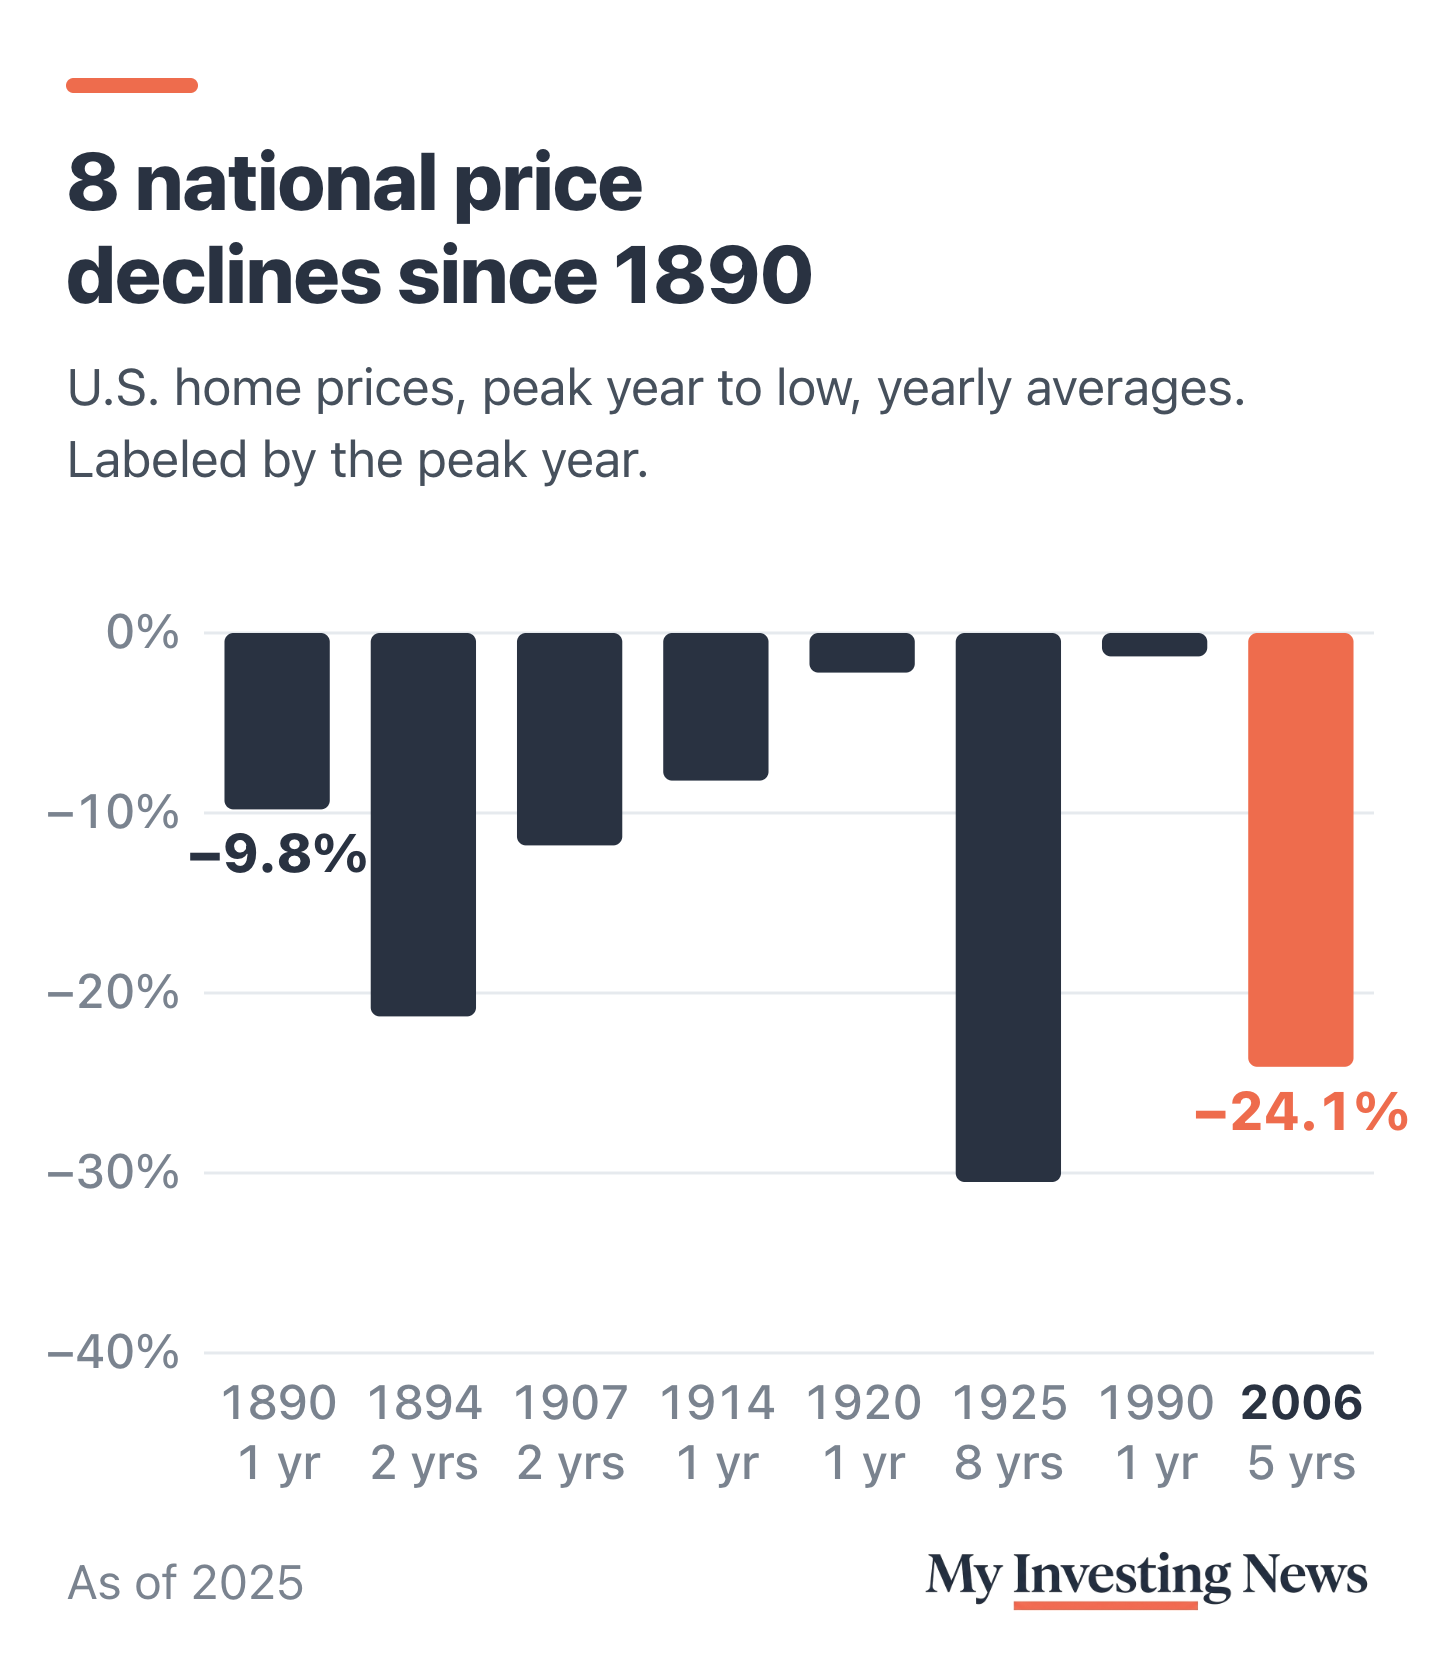
Since World War II, yearly averages have fallen only twice: 1.3% from 1990 to 1991, and 24.1% from 2006 to 2011, the bust Eisman made his name on. The yearly average didn’t get back above its 2006 level until 2017. Monthly figures catch smaller dips that yearly averages smooth over, such as a 2.3% slide in the seasonally adjusted index from June 2022 to January 2023. So a national decline would be unusual. Most of the ones on record were short and shallow.
Is Buying 50% More Expensive?
Eisman’s case rests on more than rates. “Property and casualty insurance has gone up a lot. Your utility bill has gone up a lot. Your property taxes have gone up a lot,” he said. “So leaving aside even the mortgage price, it’s probably 50% more expensive today to buy a house than it was five years ago.”
The Census Bureau’s American Community Survey tracks those costs for homes with no mortgage: property taxes, insurance, utilities and fees. The median rose from $539 a month in 2021 to $703 in 2025, up 30%. Median property tax bills rose 20%. Consumer prices overall rose 18.8% over the same years. Those costs outran inflation, though they fall short of 50% on their own.
Add the mortgage and his number holds up. On the median-priced new home with 20% down, monthly principal and interest came to about $1,311 in the third quarter of 2021. In the third quarter of 2026 it was about $2,026, up 55%. At the Nov. 5 rate it would be about $2,131, up 63%. The price itself barely moved: the median new home sold for $393,300 in the third quarter, against $395,200 five years earlier, as builders cut prices to keep buyers coming.
Housing by the numbers, latest readings
The Cushion Under Prices
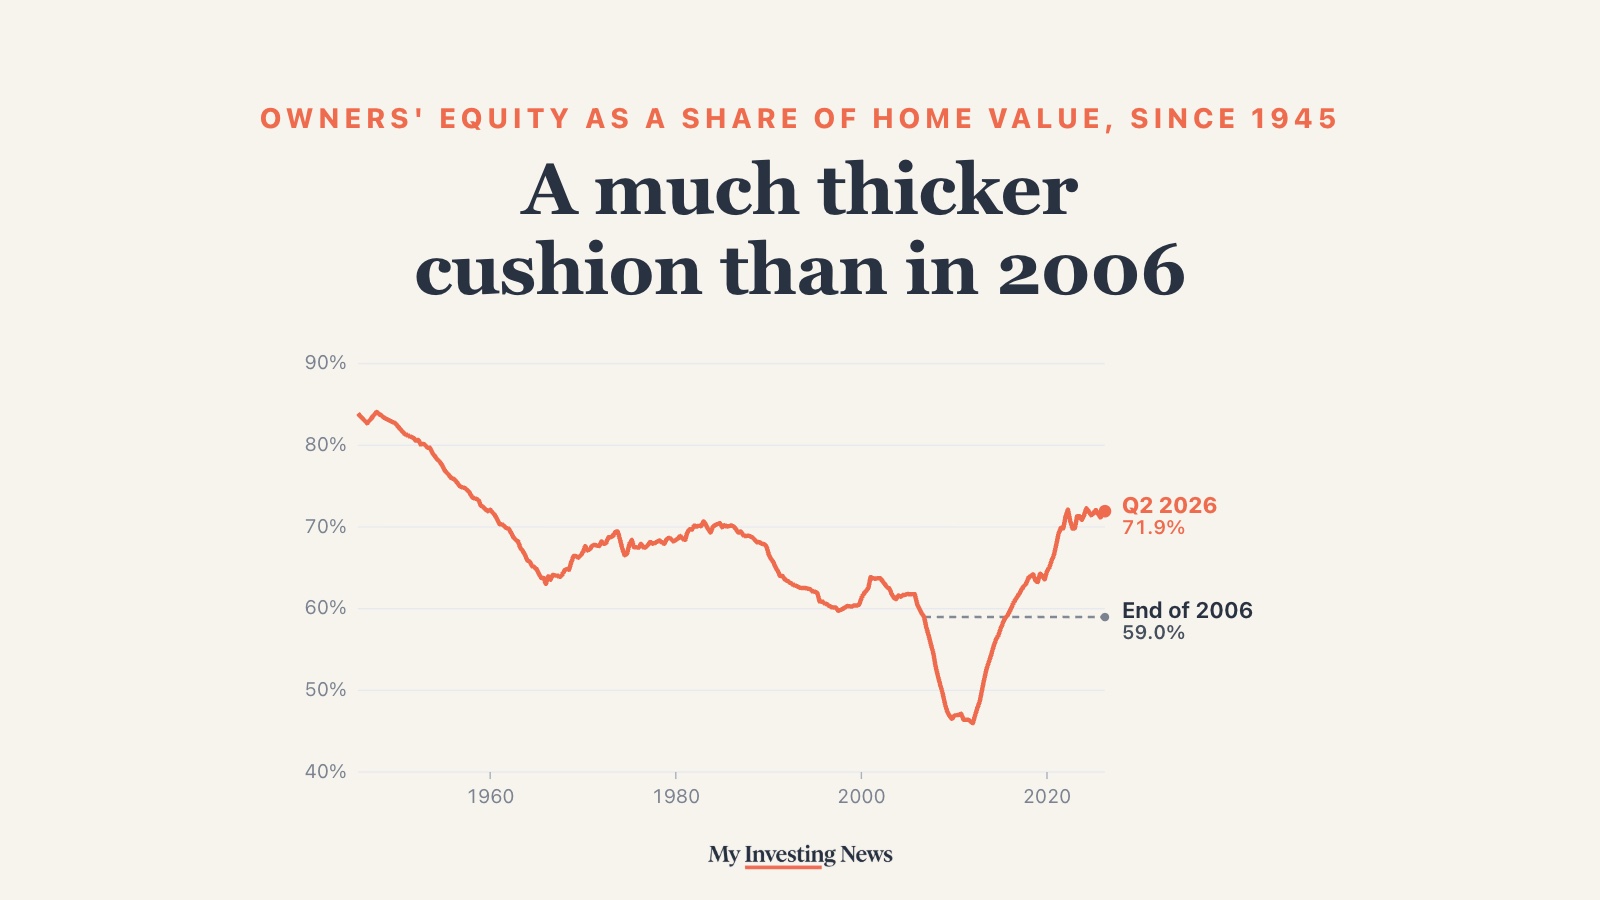
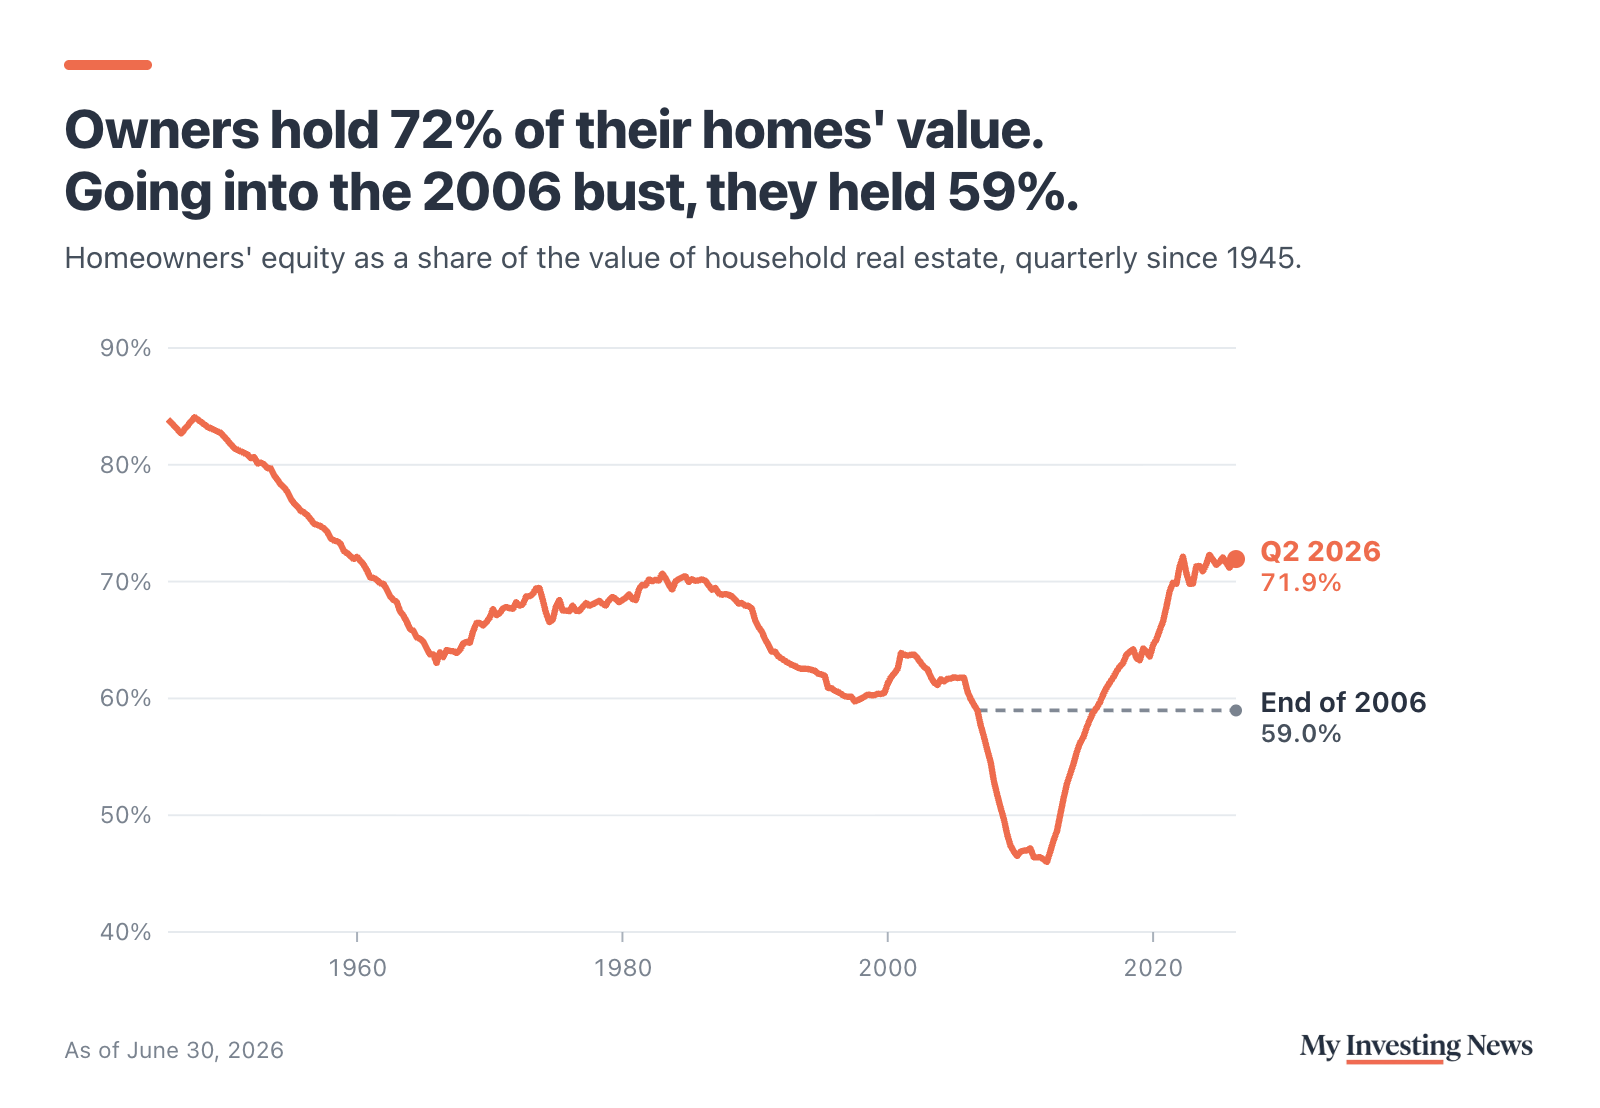
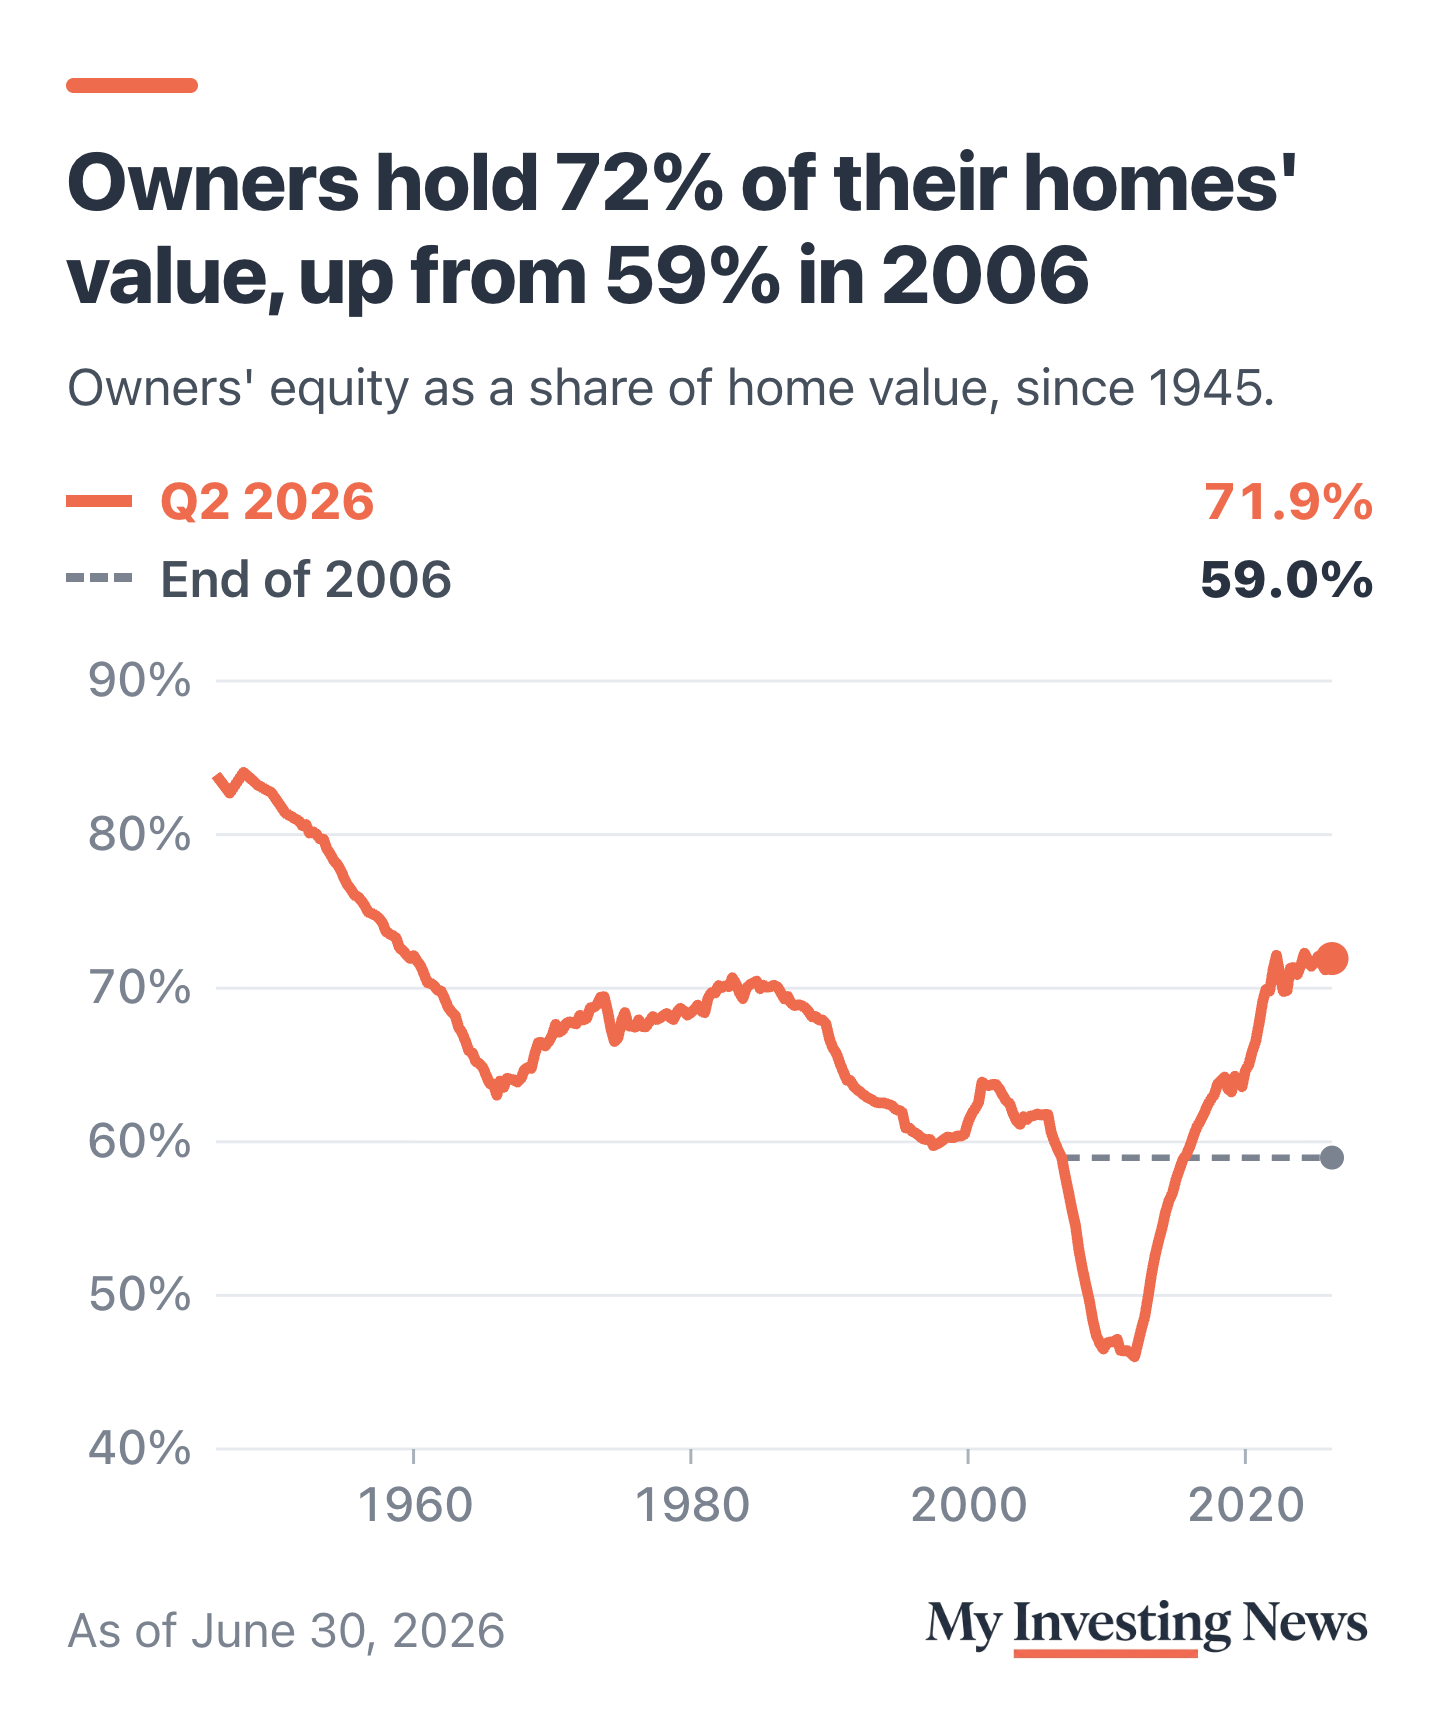
A price decline turns into a crash when owners have to sell. In 2006, many had little equity to fall back on. Today, homeowners’ equity is 71.9% of the value of household real estate, according to the Federal Reserve’s Financial Accounts for the second quarter: about $35.8 trillion of $49.8 trillion. That share was 59.0% at the end of 2006 and bottomed at 46.0% in early 2012. Outside the past few years, it hasn’t been this high since 1960.
The same point came up on The Ramsey Show on Nov. 6, where guest Brian Buffini told Dave Ramsey that 40% of homes are owned free and clear and another 42% have 50% equity. “83% of all homeowners in the United States are either free and clear or 50% equity and above,” Buffini said, and that it is “impossible” for the doom-scrolling crash talk to be true. Census data back up the first figure: 41.0% of owner-occupied homes had no mortgage in 2025, or 35.9 million of 87.5 million, up from 38.7% in 2021. Buffini didn’t give a source for the 42%, and the Census survey doesn’t measure equity for homes with a mortgage.
Eisman sees a different way out of the standoff. Owners who refinanced at 3% won’t sell into 7% rates, he said, so the market stays locked until older owners’ homes pass to their heirs. “Probably over the next 10 years, a lot of houses will come for sale,” he said. That would add supply slowly, over years. He has also warned that AI borrowing is crowding out Treasuries.
What to Watch
Case-Shiller’s September reading is due Nov. 24. Unadjusted prices usually soften in the fall, so the seasonally adjusted index is the better test of Eisman’s call. Freddie Mac publishes its mortgage rate every Thursday. The Fed’s third-quarter Financial Accounts, due Dec. 10, will show whether owners’ equity held up as rates rose.
Eisman expects the next national move in home prices to be down, something yearly averages show only eight times since 1890 and twice since World War II. His cost point holds once the mortgage is counted: payments on a median new home are up 55% in five years. The risk to his call is the cushion: owners hold 71.9% of their homes’ value, far more than the 59.0% they held going into the last bust.