Where we heard itCharlie Bilello, chief market strategist at Creative Planning, in a post on X on Oct. 26, 2026, and in his Week in Charts newsletter on Oct. 23, 2026.
Charlie Bilello, chief market strategist at Creative Planning, keeps a running count. In his Oct. 23 newsletter he wrote that consumer prices “rose 3.7% over the last year, marking the 67th consecutive month above the Fed’s 2% inflation target.” Three days later, he posted on X that pay had fallen behind:
Both claims can be checked against Labor Department records that go back decades. We listed every streak of inflation above 2% since 1947, and every year since 1965 in which hourly pay lost ground to prices. The count holds up. What history says about it is less simple.
The Third-Longest Streak Since 1947
Our rule: a streak is a run of months in which the consumer price index stood more than 2% above its level a year earlier, using the rounded figure the Bureau of Labor Statistics publishes. By that rule, the current run began in March 2021 and reached 67 months with the September report, the same count Bilello gives. The bureau published no October 2025 index because of the government shutdown, and we counted that month in the streak because the readings on either side of it were both near 3%.
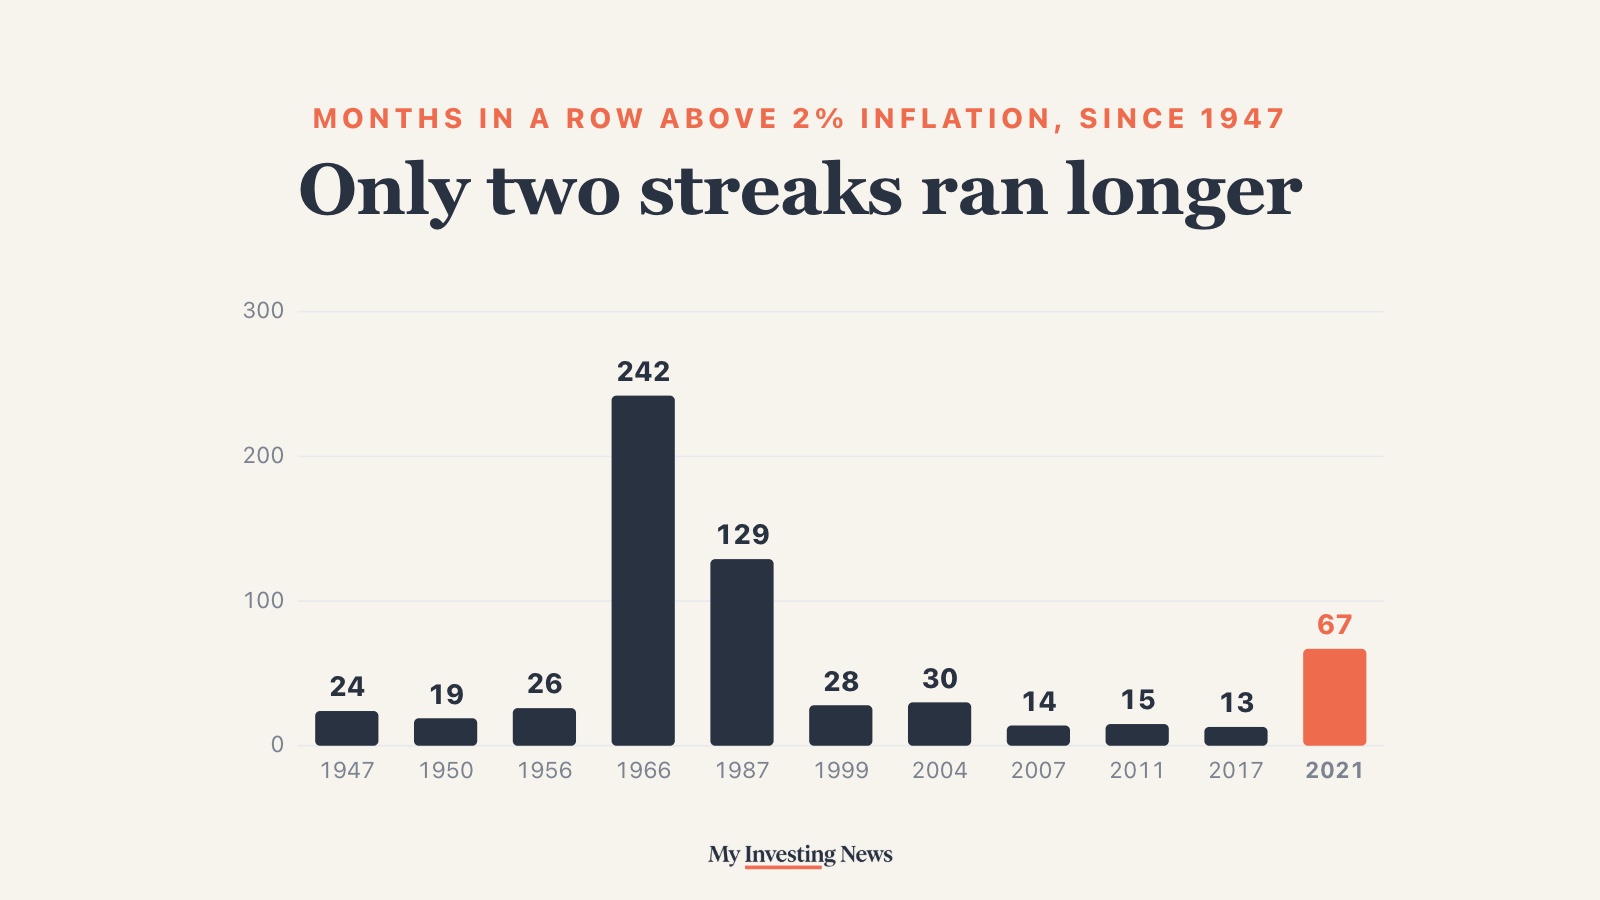
There have been 23 streaks since 1947, this one included. Only two of the 22 earlier ones lasted longer. The first ran 242 months, from February 1966 to March 1986, through 4 recessions, and peaked at 14.8% in March 1980. The second ran 129 months, from February 1987 to October 1997, and peaked at 6.3% in October 1990. After those, the longest was 30 months, from April 2004 to September 2006. Eleven streaks, this one included, lasted a year or more. The median streak lasted 11 months.
Inflation has topped 2% for 67 months in a row. Only 2 of the 22 earlier streaks since 1947 ran longer.
Every run of months with consumer prices more than 2% above a year earlier, drawn from its first month. Dotted line: 2%. The two longer ones are dark. This one is coral.
This streak peaked at 9.1% in June 2022, the highest reading since November 1981, then cooled to 2.4% early this year before rising again to 3.7% in September. It also stands out for what it hasn’t included: a recession. Of the six earlier streaks that lasted two years or more, five ran through at least one month of recession, as the National Bureau of Economic Research dates them. The 2004 to 2006 run was the exception.
One caveat on the yardstick. The Fed’s 2% goal is set on a different gauge, the personal consumption expenditures price index, and the central bank made it official in January 2012. The older streaks are measured against a line the Fed wasn’t formally aiming at then.
Pay Has Trailed Prices Since April
Bilello’s second claim also checks out. Average hourly earnings for all private-sector workers rose 3.0% in the year to September, while prices rose 3.7% on the seasonally adjusted index the bureau uses to compare them. That leaves real hourly pay down 0.7%. Pay has trailed prices on that measure in each of the past 6 months, starting in April. The last month it did before that was April 2023.
Production and nonsupervisory workers, about four in five private-sector employees, saw the same thing. Their pay rose 3.3% while the price index for wage earners rose 3.9%, so their real hourly pay fell 0.6%.
Inflation and pay, as of September 2026
Real Pay Has Fallen Without a Recession Before
Bilello calls the gap “a decline in prosperity for the American worker,” and for the past six months that is what the numbers show. The longer record shows it isn’t rare. We compared each year’s average real hourly pay for production and nonsupervisory workers with the year before, going back to 1965. Real pay fell in 24 of those 61 years. Ten of them had a recession. The other 14 didn’t, which works out to 14 of the 48 years with no recession at all.
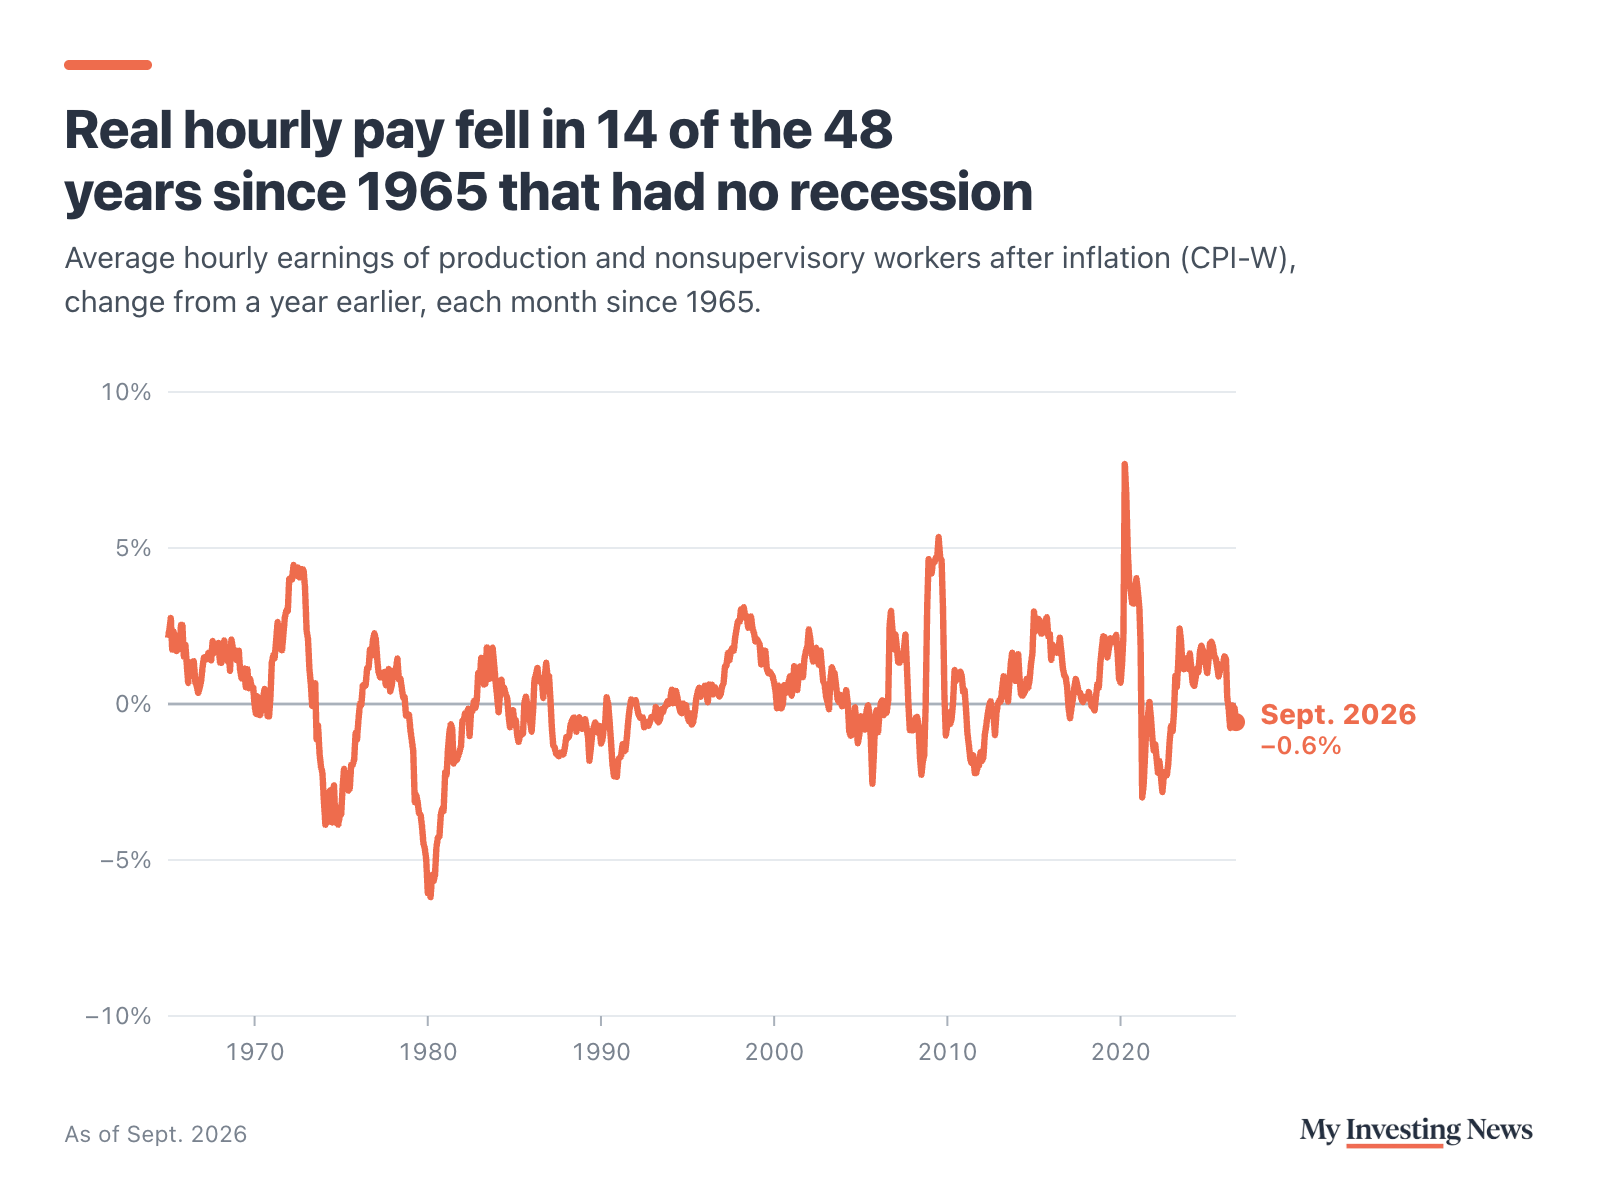
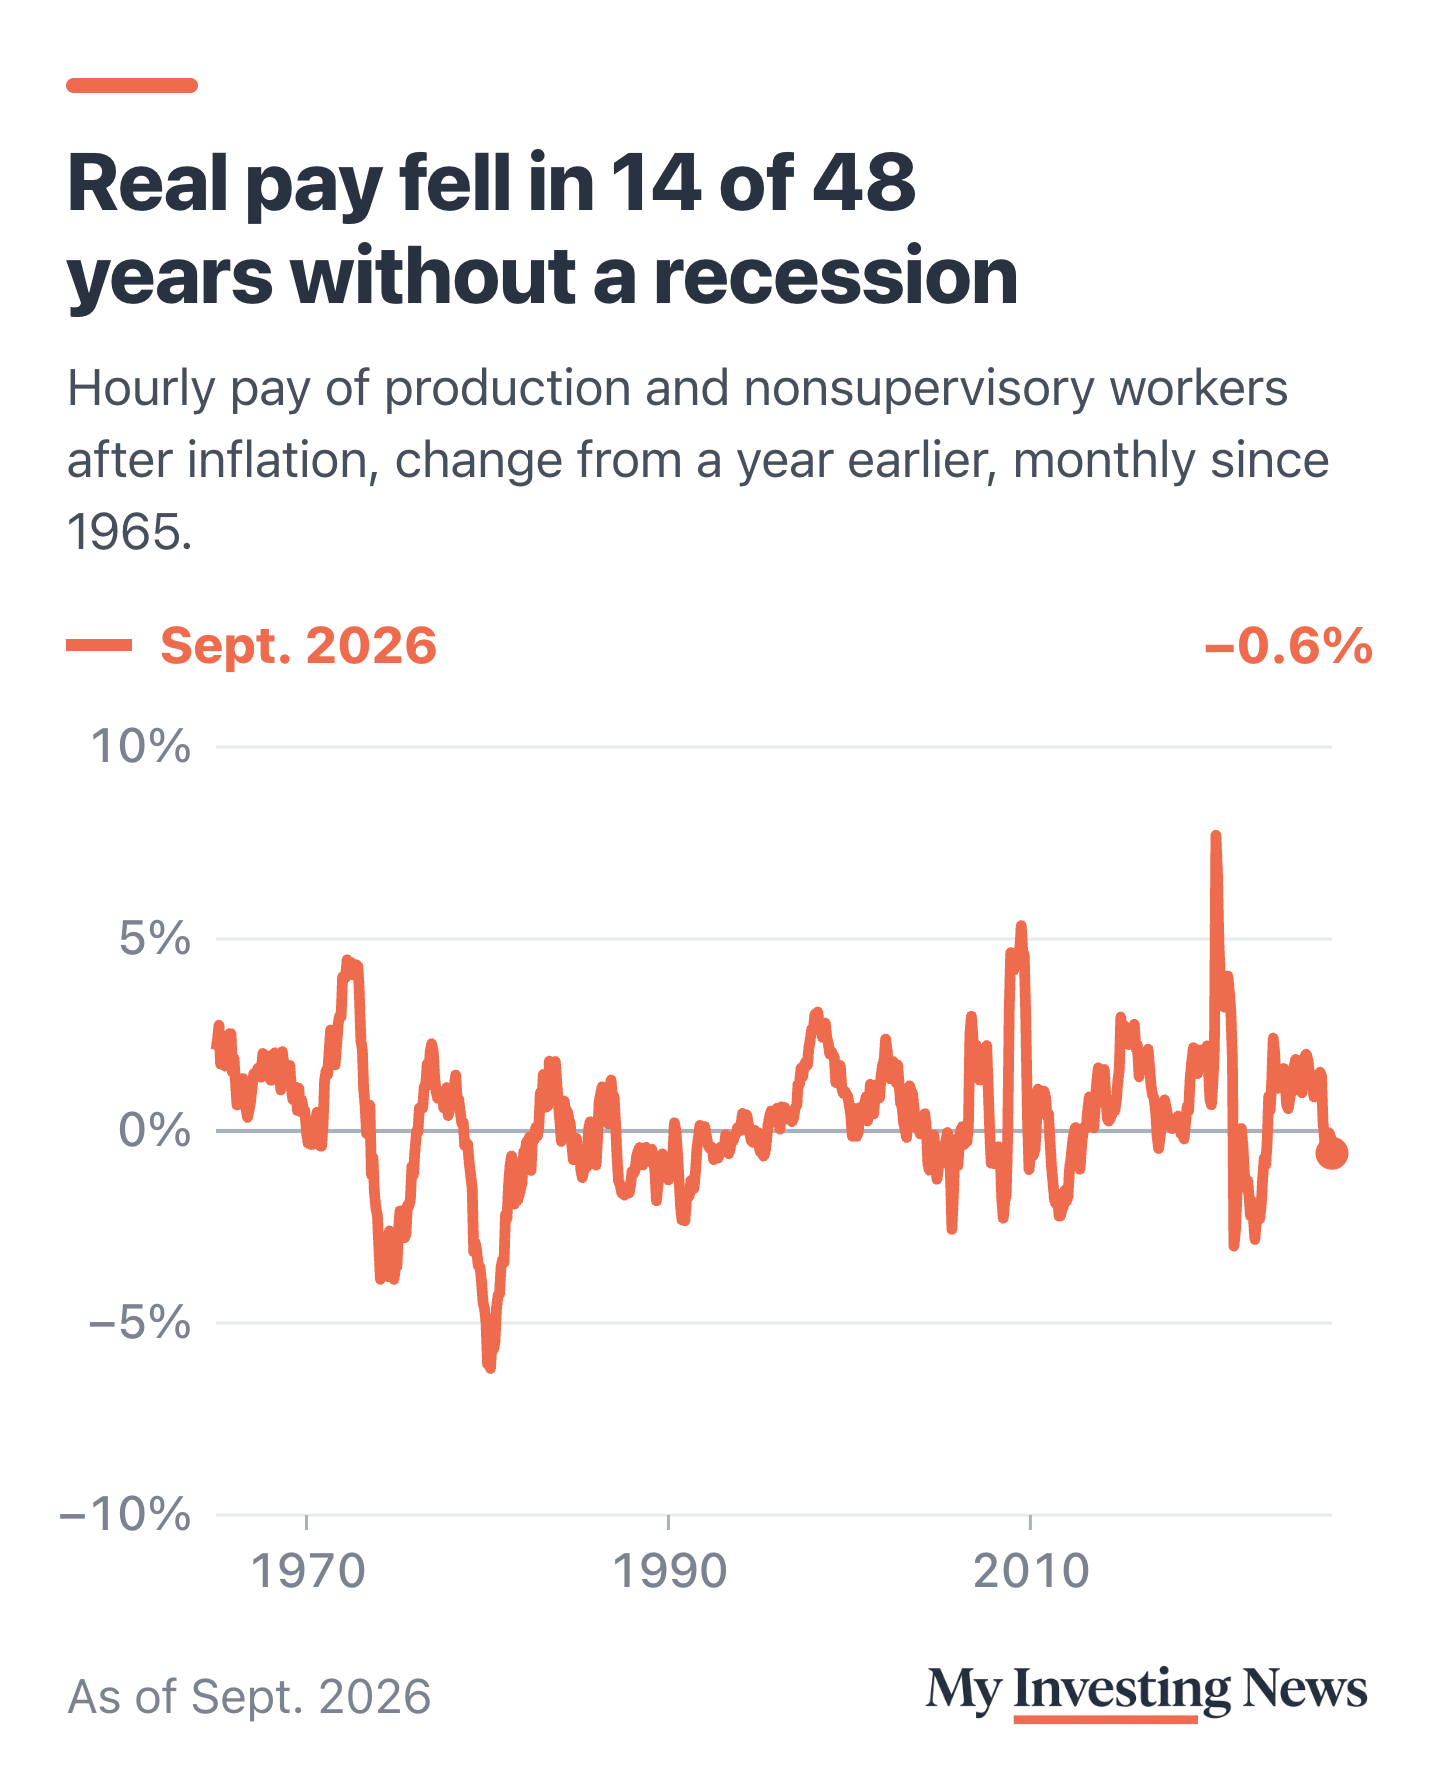
The worst of those was 1979, when real pay fell 3.1% as inflation took off, months before the 1980 recession began. Real pay also slipped every year from 1987 through 1989, and fell in 2021 and 2022, when the current streak was at its hottest. It then rose in 2023, 2024 and 2025 as pay caught up.
The pressure shows up in other data too. Lower earners got raises and still got poorer in the Fed’s latest survey of household finances, and Apollo’s Torsten Slok has argued that Americans now have a savings shortage.
What to Watch
The October jobs report on Nov. 6 brings the next reading on hourly pay, and the October consumer price report follows on Nov. 10. With September at 3.7%, the inflation streak isn’t close to ending, so the question is the pay gap. If wages pick up or prices cool, real pay turns positive again, as it did in 2023. If not, the gap Bilello flagged runs into a seventh month.
Bilello’s count is right: 67 straight months of inflation above 2%, a run only two streaks since 1947 have topped, and both of those lasted a decade or more. His point on pay holds too, with real hourly pay down 0.7% over the past year. History says that alone doesn’t signal a recession, since real pay fell in 14 years without one. The risk is how long the gap lasts.