Where we heard itDiane Swonk, chief economist at KPMG, on Marketplace Morning Report, “The AI sell-off overseas,” Nov. 6, 2026, about 90 minutes before the October jobs report.
Diane Swonk told Marketplace listeners what she would watch first in the October jobs report: average hourly earnings, “the most important issue for most households.” She expected pay to rise 0.3% in the month, which would still leave it only 2.9% above a year earlier. Then she put a number on how long workers have been falling behind:
The report beat her pay forecast. Average hourly earnings of private-sector workers rose 0.4% in October and 3.1% from a year earlier, according to the Bureau of Labor Statistics. Her count of 13 months is harder to match. On the government’s own numbers, the streak is six months long.
What the BLS Numbers Show
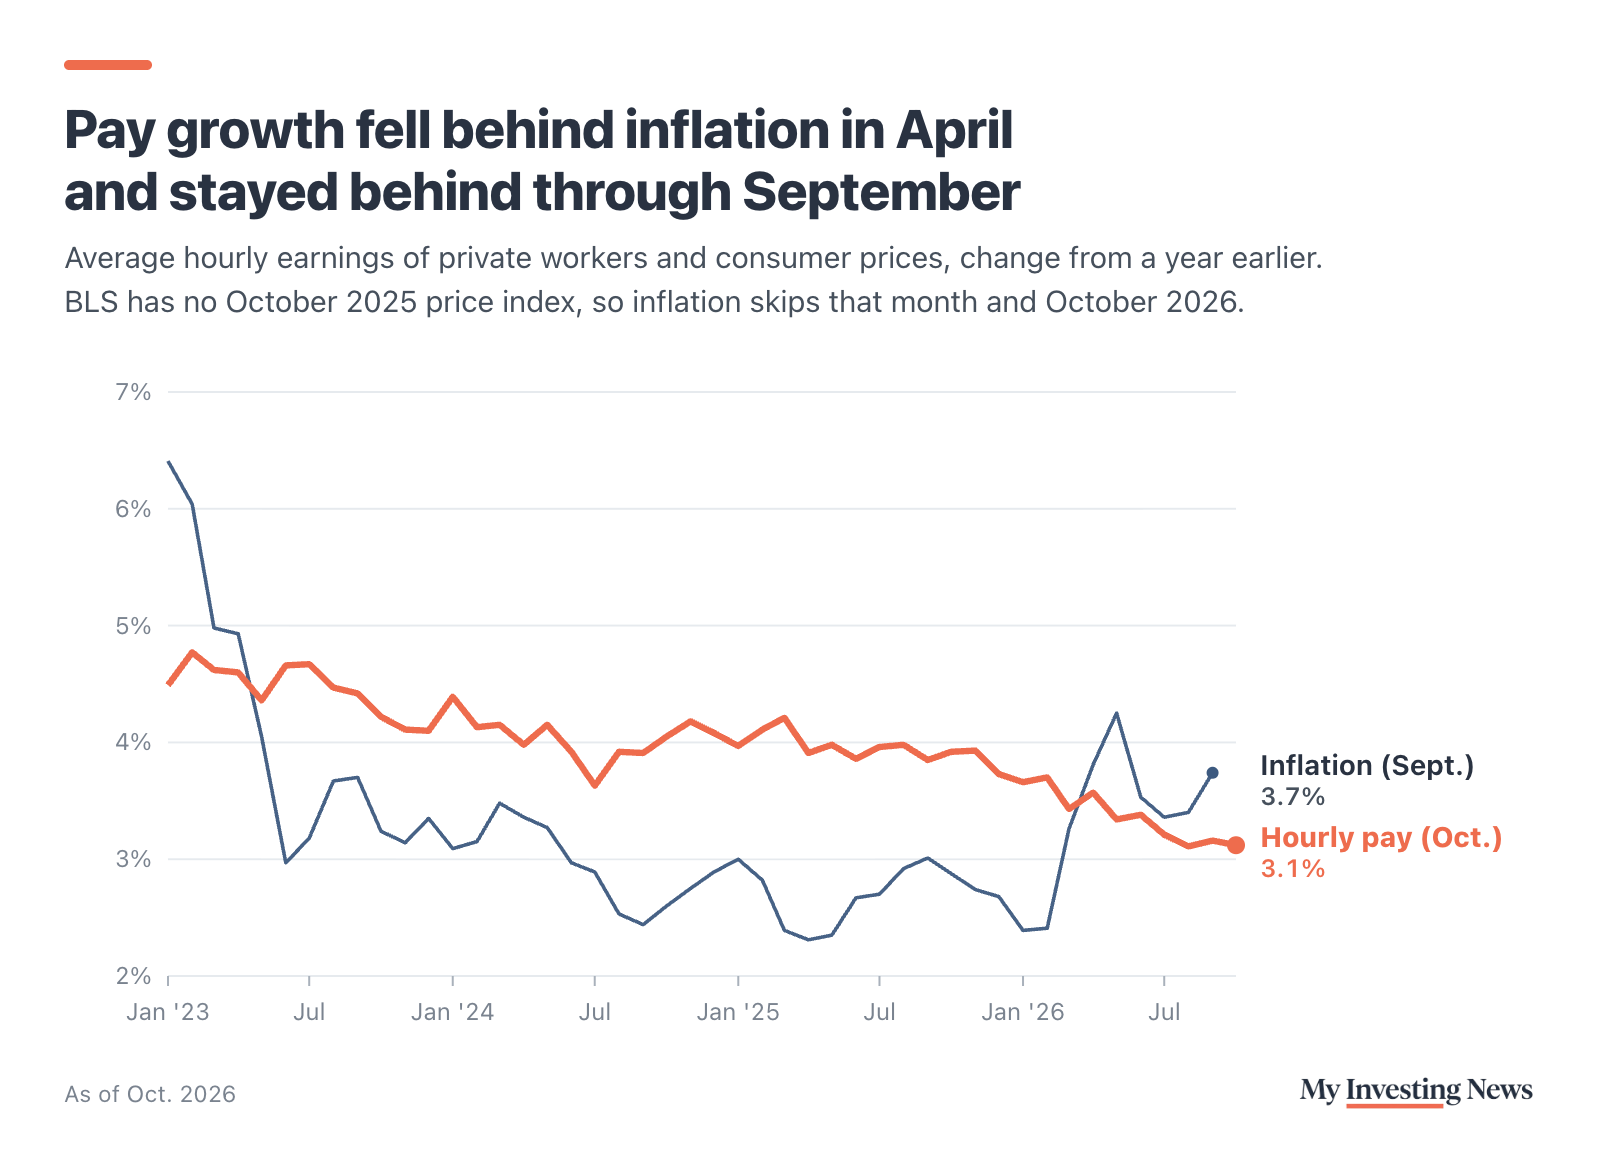
Pay growth fell behind inflation in April 2026, when hourly earnings were up 3.6% from a year earlier and consumer prices were up 3.8%. It stayed behind through September, the latest month with a clean comparison, when pay was up 3.2% and prices 3.7%. That is six months in a row. The count is the same for production and nonsupervisory workers measured against the consumer price index for wage earners, the version the bureau uses in its real earnings report.
Before April, pay outran prices in every month with data going back to May 2023. In September 2025, hourly pay was up 3.8% against 3.0% inflation. In November 2025, it was 3.9% against 2.7%.
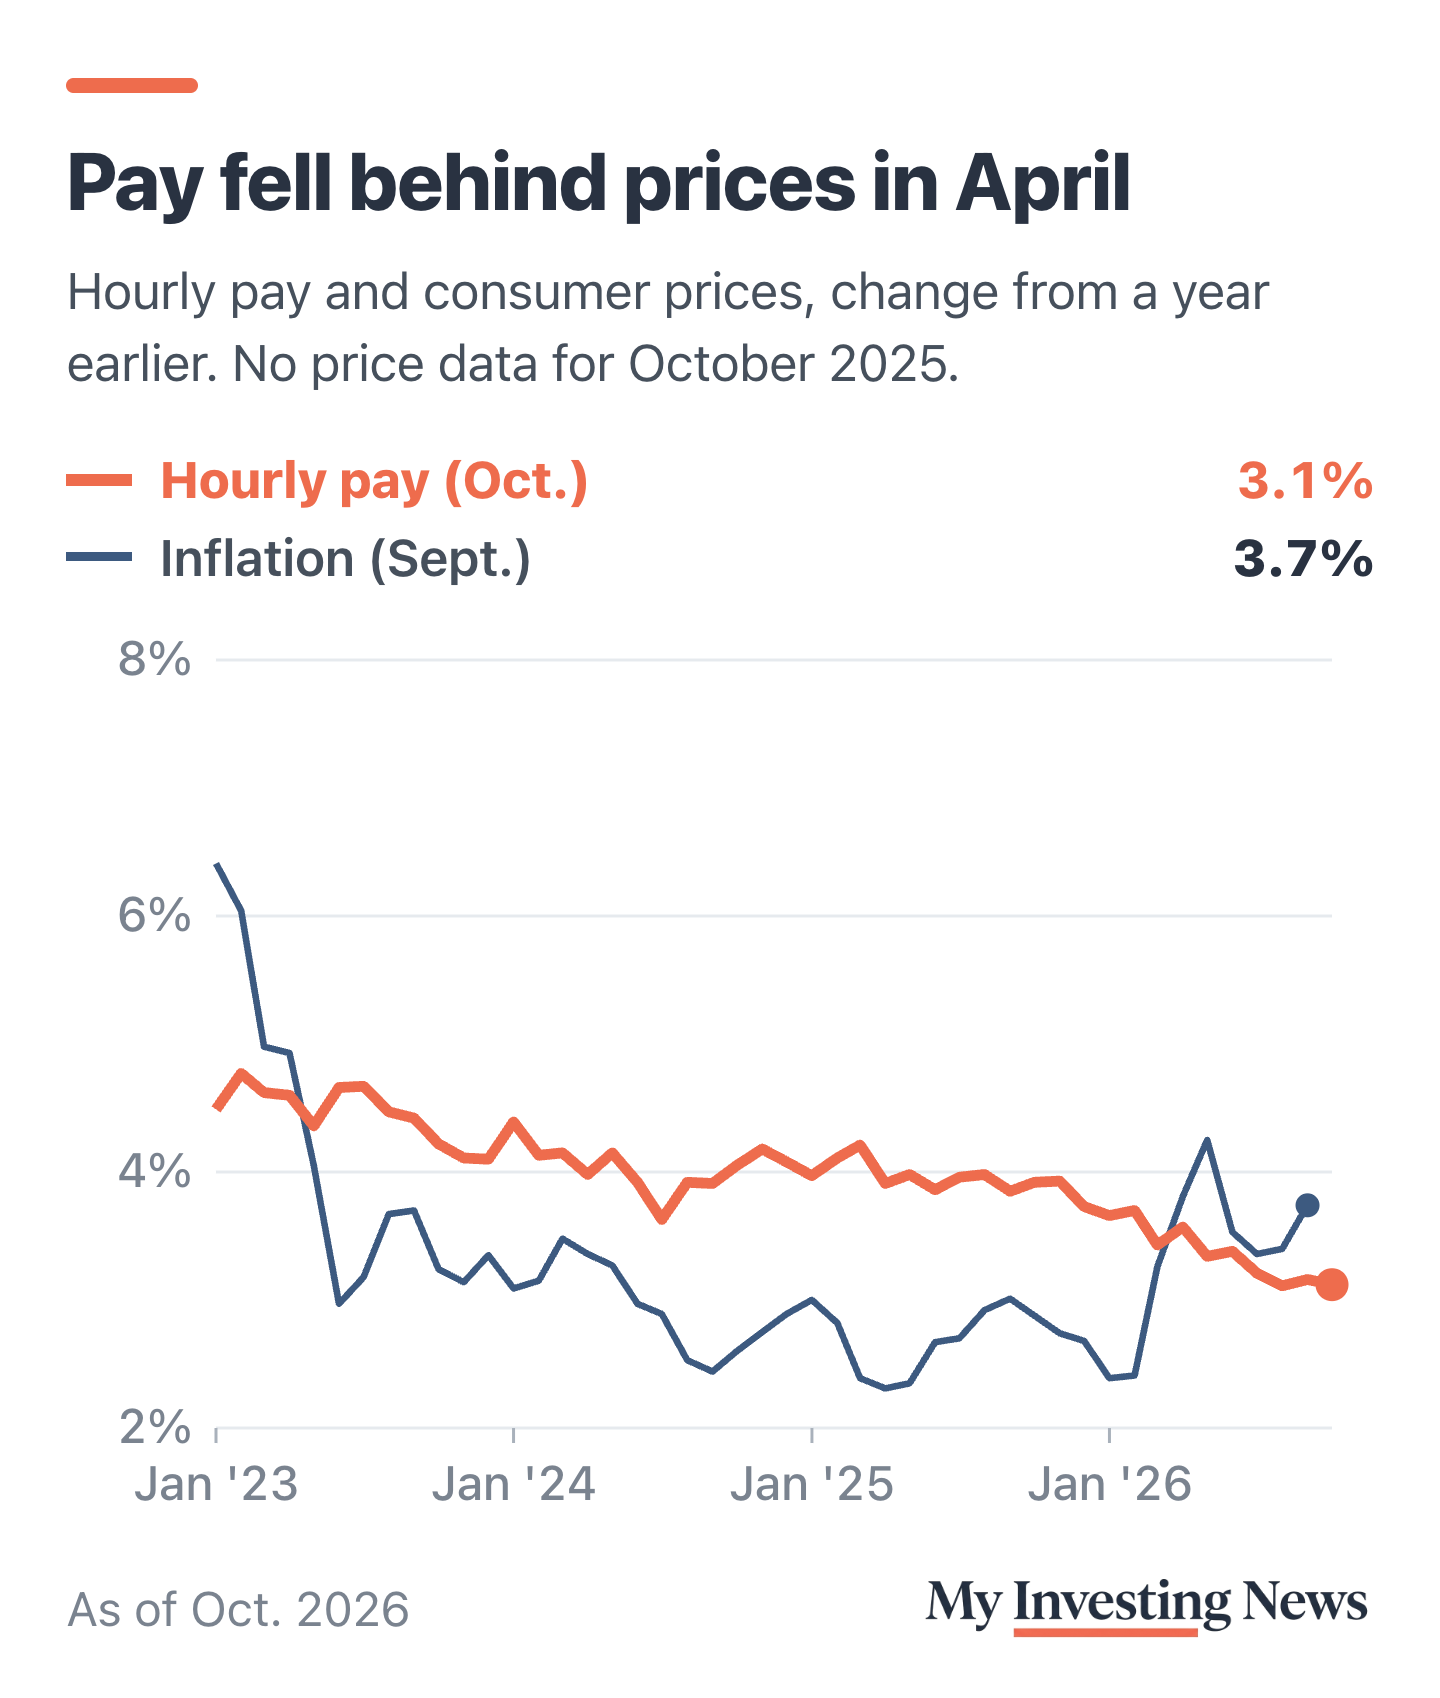
Swonk didn’t say on air which measure she used. Counting back 13 months from October lands on October 2025, the month the bureau collected no prices during the government shutdown. We also checked real weekly earnings, the production-worker series, and pay and prices over three and six months at an annual rate. None of them shows wages behind inflation for 13 straight months.
Her larger point holds up: real individual wage earners have lost ground. October has no 12-month inflation rate, because there is no October 2025 index to compare with. But real average hourly earnings, which the bureau computes in 1982 to 1984 dollars, were $11.26 in October, below both September 2025 ($11.32) and November 2025 ($11.38), the months on either side of the gap. October was very likely a seventh month. That is 1.1% below the $11.38 it reached in November 2025 and again in January and February 2026.
Inflation Sped Up as Pay Growth Cooled
The streak started because prices sped up, while pay growth kept drifting lower. Inflation went from 2.4% in February to 4.2% in May, and it has now run above 2% for more than five years. Hourly pay growth, which ran between 3.7% and 4.2% in 2025, has been between 3.1% and 3.4% every month since May.
A broader gauge of pay, the Employment Cost Index, points the same way. Wall Street Journal reporter Nick Timiraos noted on X on Oct. 30 that “wage growth has slowed to 3.1% as of Q3, while benefit costs are up 3.9%.” Private-sector wages excluding jobs paid by incentive, such as commission sales, rose 3.1% in the year to September, down from 3.4% a year earlier and the slowest since early 2021, BLS data show.
Pay and prices, latest readings as of Nov. 10, 2026
Six Months Is Short by History’s Standards
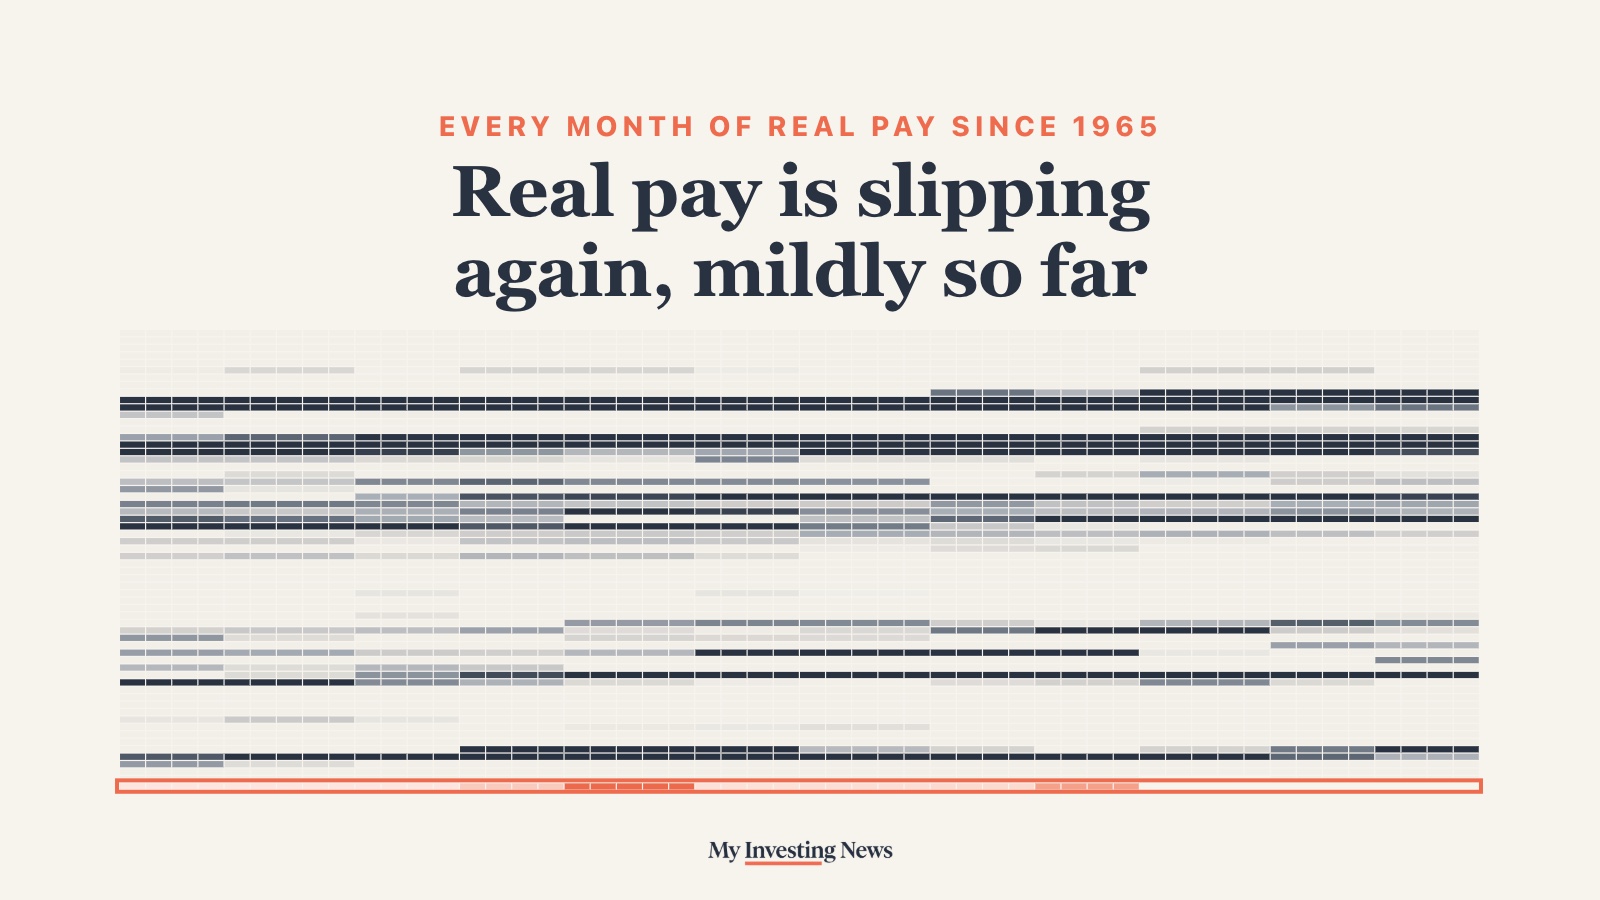
Measured against the record, this slide is real but mild so far. Since 1965, real hourly pay for production and nonsupervisory workers has been below its year-earlier level in 294 of 740 months. There were 31 losing streaks before this one. Eleven lasted six months or more, and nine ran 13 months or longer. The longest ran 47 months, from October 1978 to August 1982, when inflation hit double digits.
Real pay has fallen for six months in a row. Nine streaks since 1965 ran 13 months or more.
Hourly pay of production and nonsupervisory workers after inflation, change from a year earlier. Each row is a year, January to December. Shaded months are declines, darker means steeper. 2026 is the coral row.
The most recent long run lasted 17 months, from October 2021 to February 2023, and real pay was down as much as 2.8% from a year earlier in June 2022. This time the deepest drop so far was 0.8%, in May. For many households that is still a squeeze, coming after a stretch when lower earners got raises and still got poorer. Swonk has been cautious on the economy this fall: she also warned that a prolonged bear market could bring a mild recession.
What to Watch
Pay and prices ran about even in October on a monthly basis: hourly earnings rose 0.4% and consumer prices rose 0.4%, seasonally adjusted. The November jobs report, due Dec. 4, and the November consumer price index, due Dec. 10, will give the first clean 12-month comparison since September. Pay growth near 3% against inflation near 3.7% would push the streak to eight months, counting October. Closing the gap needs inflation to cool, since pay growth has been slowing, too.
Swonk is right that wages have fallen behind prices, but the government’s data show a six-month streak through September, not 13 months. By the record since 1965, this slide is short and shallow so far, at 0.8% at its worst. The risk is that pay growth keeps cooling while inflation stays near 3.7%, which is how past streaks stretched past a year.