Where we heard itLiz Ann Sonders, chief investment strategist at Charles Schwab, on Schwab’s On Investing podcast, Nov. 6, 2026.
On Schwab’s On Investing podcast on Nov. 6, Liz Ann Sonders flagged an oddity in this year’s stock market. Through Oct. 28, she said, energy and tech were the two best-performing sectors of 2026. Then she added:
Her reasoning: “Normally your top two performers tend to have a similar kind of background story, macro story, fundamental drivers, and that has not been the case this time.” Sonders didn’t say how she measured it. We tested the claim against the longest daily record there is, Ken French’s industry returns back to July 1926. It holds, and it reaches back twice as far as she said.
Energy and Tech, on Opposite Days
The sector funds show the split. Through Oct. 28, the Energy Select Sector SPDR XLE had returned 56.1% this year including dividends and the Technology Select Sector SPDR XLK 33.1%, against 14.1% for the S&P 500 fund SPY. On 108 of the 207 trading days through Oct. 28, the two sector funds closed in opposite directions. The correlation of their daily returns, a measure that runs from 1 for lockstep to minus 1 for mirror images, was -0.26.
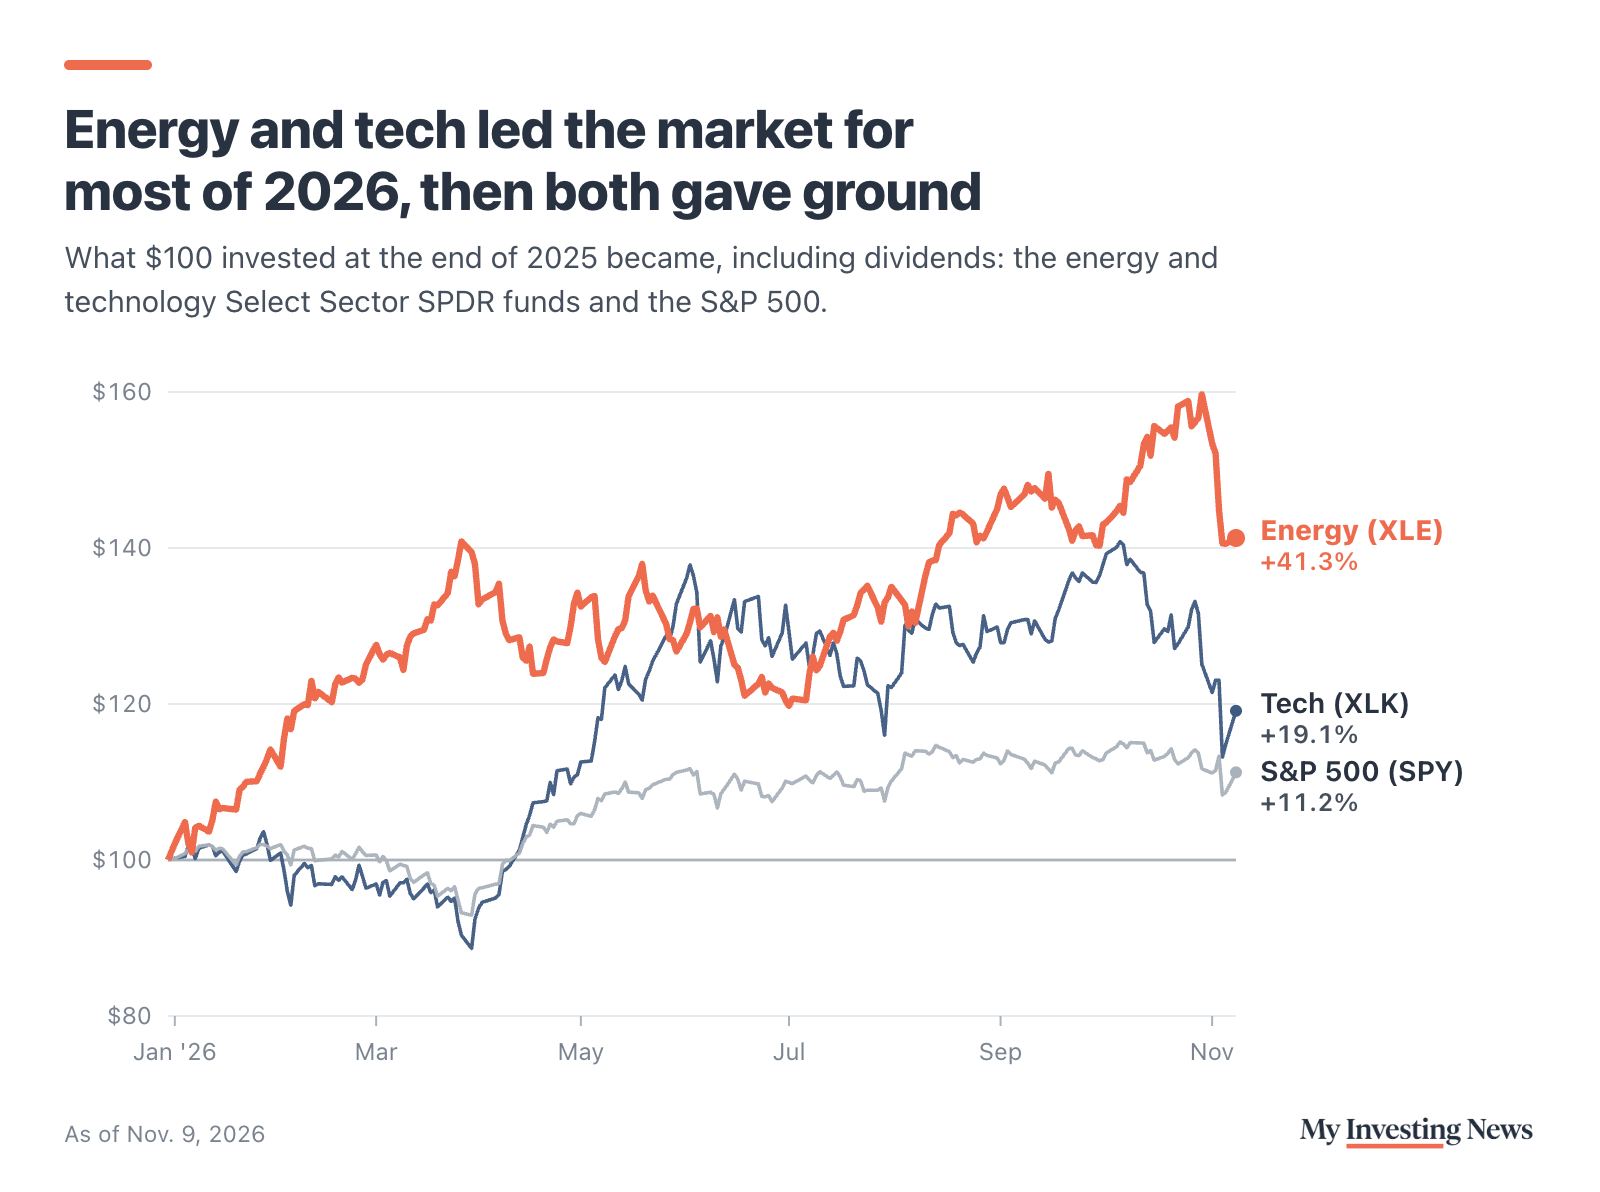
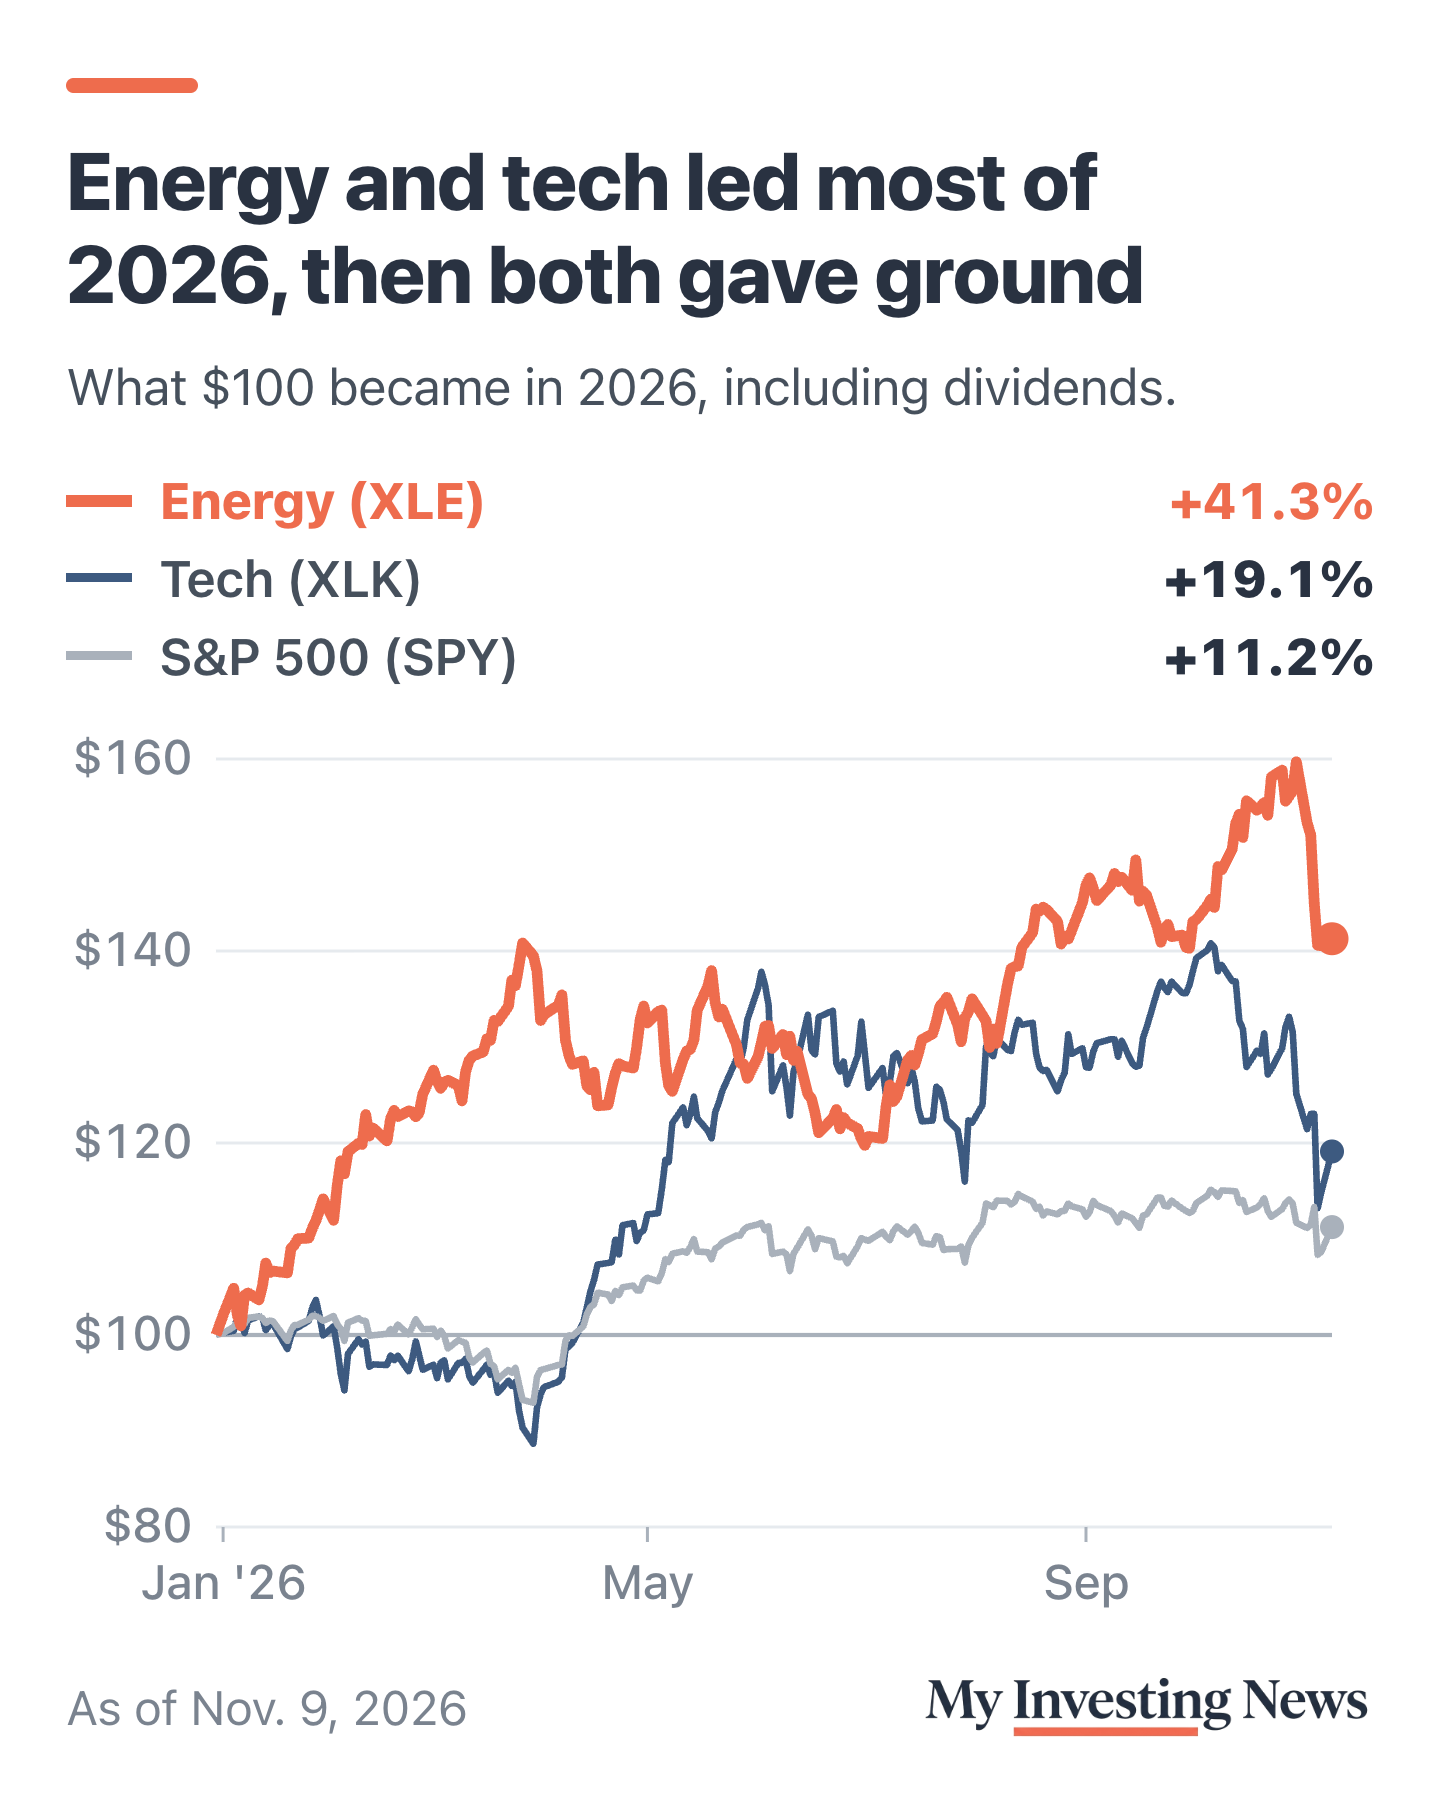
Both have given ground since. On Nov. 5, when the S&P 500 fell 4.4%, the tech fund dropped 8% and the energy fund 3%. By the Nov. 9 close, energy was up 41.3% for the year and tech 19.1%, fourth of the 11 sector funds behind health care at 23.2% and consumer staples at 19.3%. Sonders noted on the podcast that health care had already leapfrogged tech. A futures trader argued in October that energy’s rally had nothing to do with the AI story, which fits her point about different drivers.
Energy and tech in 2026
A First Since at Least 1926
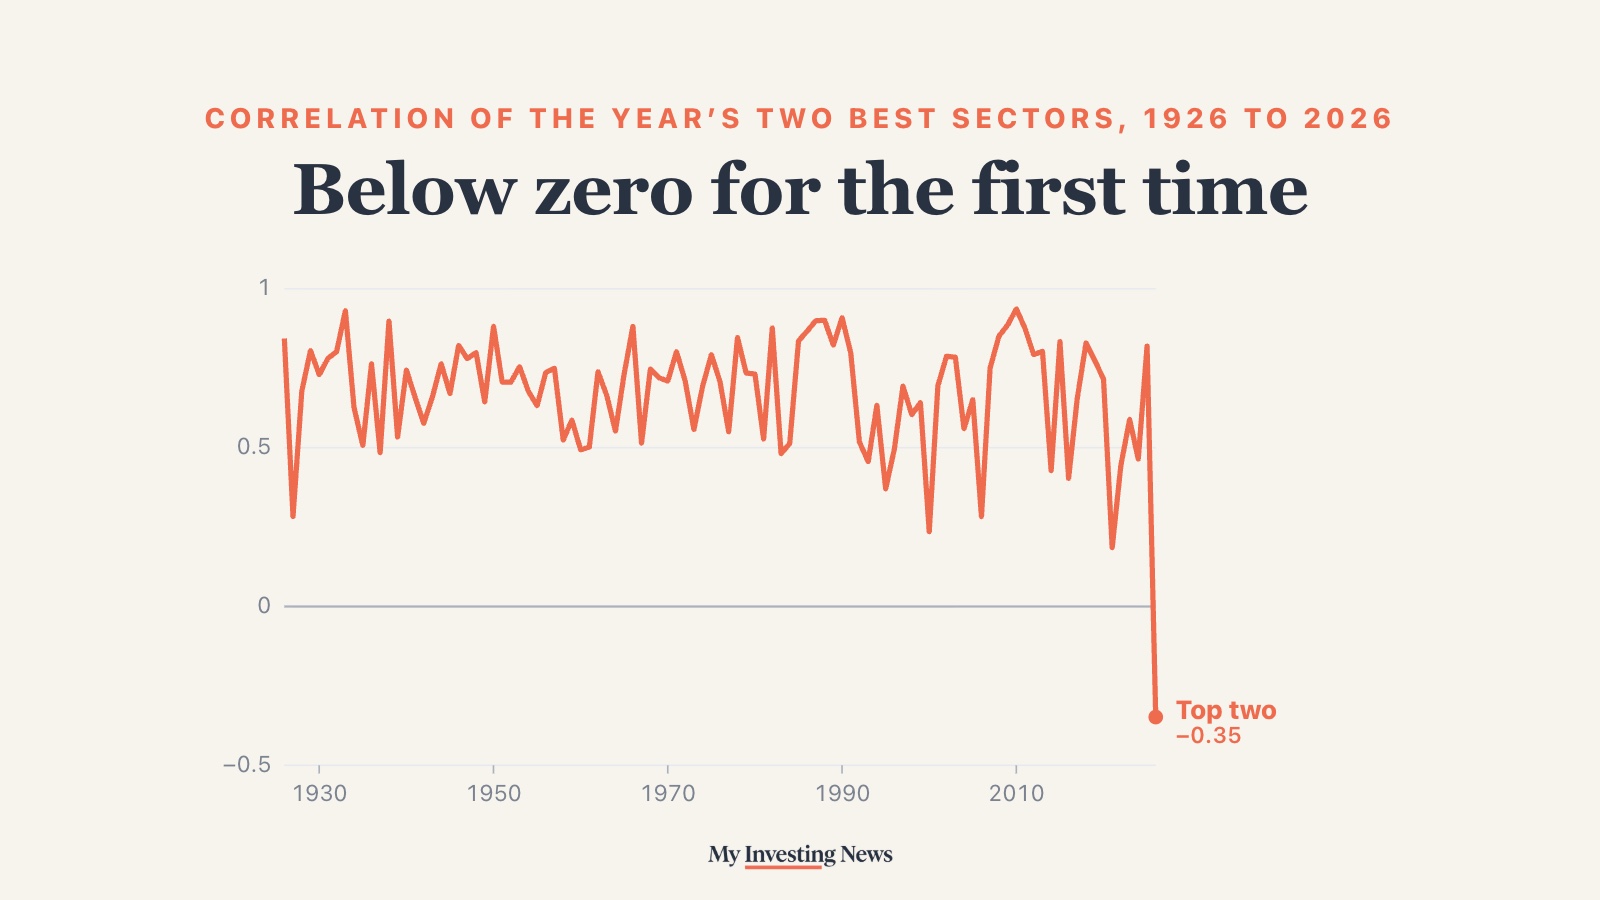
Ken French, the Dartmouth finance professor, publishes daily returns for 12 broad U.S. industry groups going back to 1926, built from NYSE, Amex and Nasdaq stocks. For each year we took the two best-performing groups and measured how closely their daily returns moved together.
Through Sept. 30, the latest month in French’s data, energy was up 42.5% this year and business equipment, his tech group, 22.1%. Their correlation was -0.35. In every year from 1926 to 2025, the year’s top two came in above zero. The typical year was 0.71. The closest calls were 2021, when energy and consumer durables led at 0.19, and 2000, when utilities and health care led at 0.24.
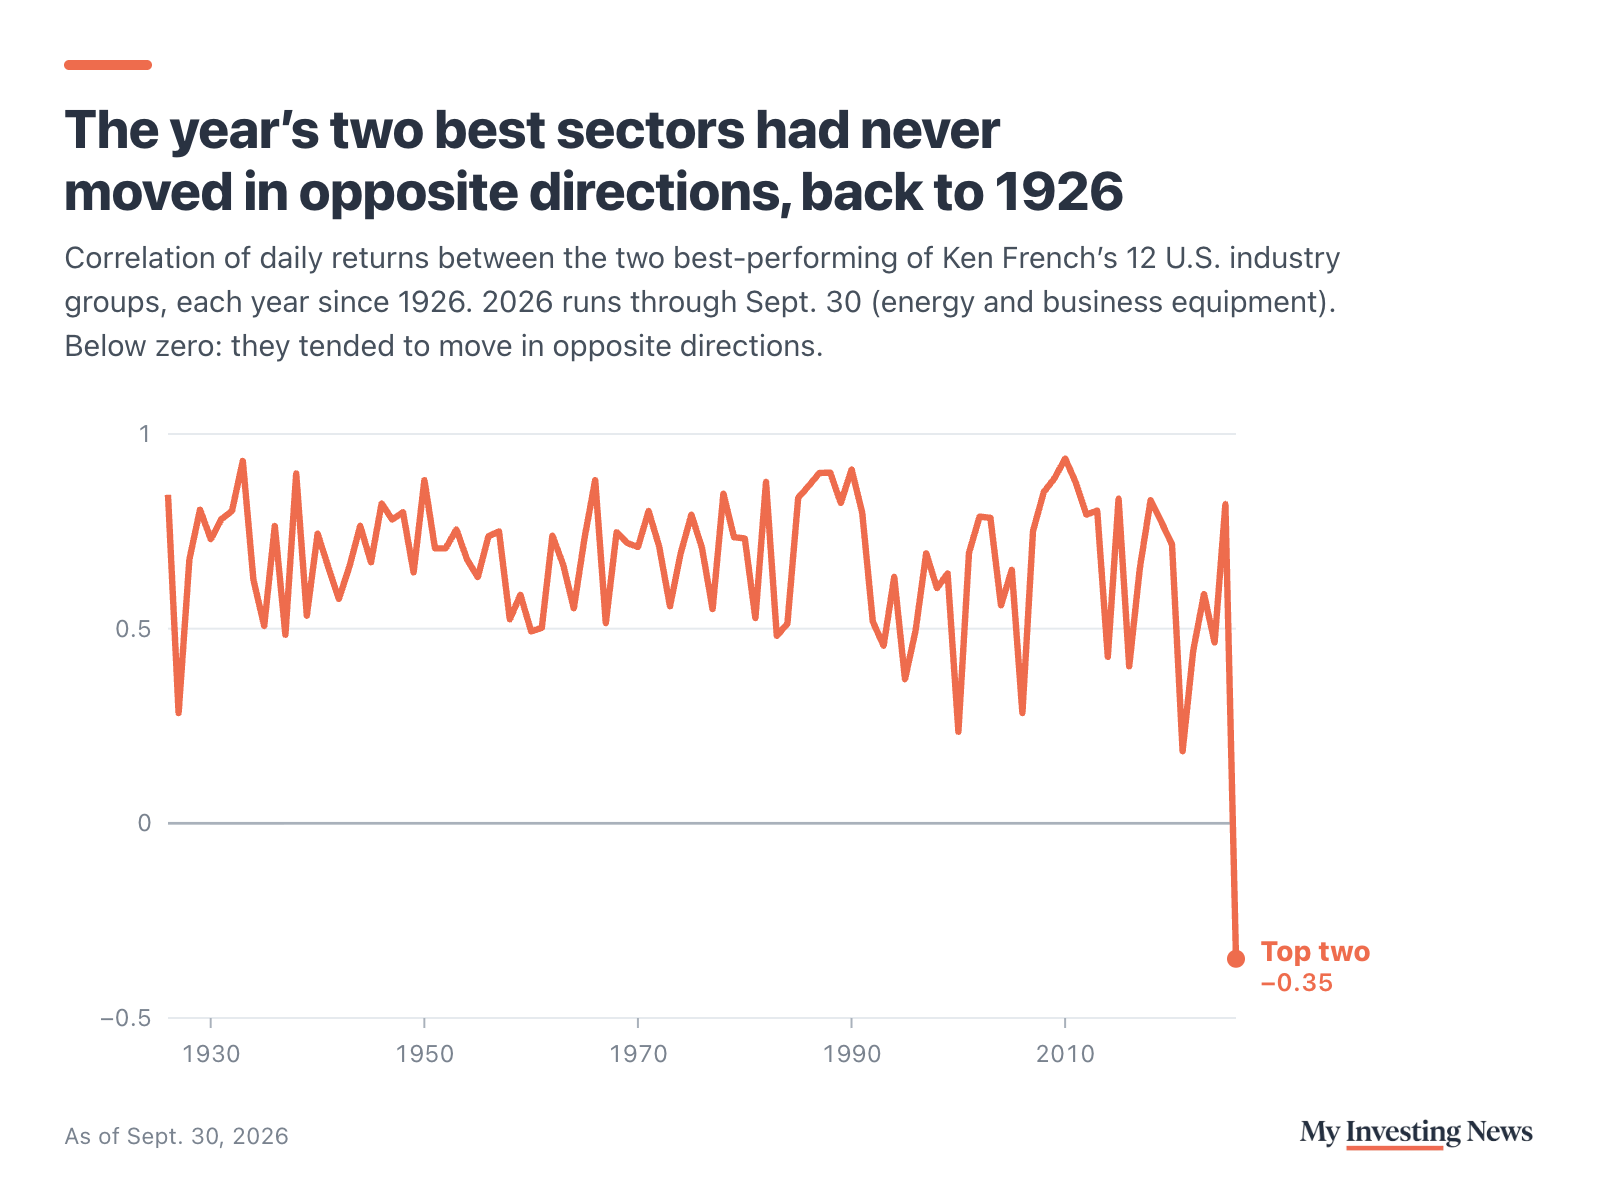
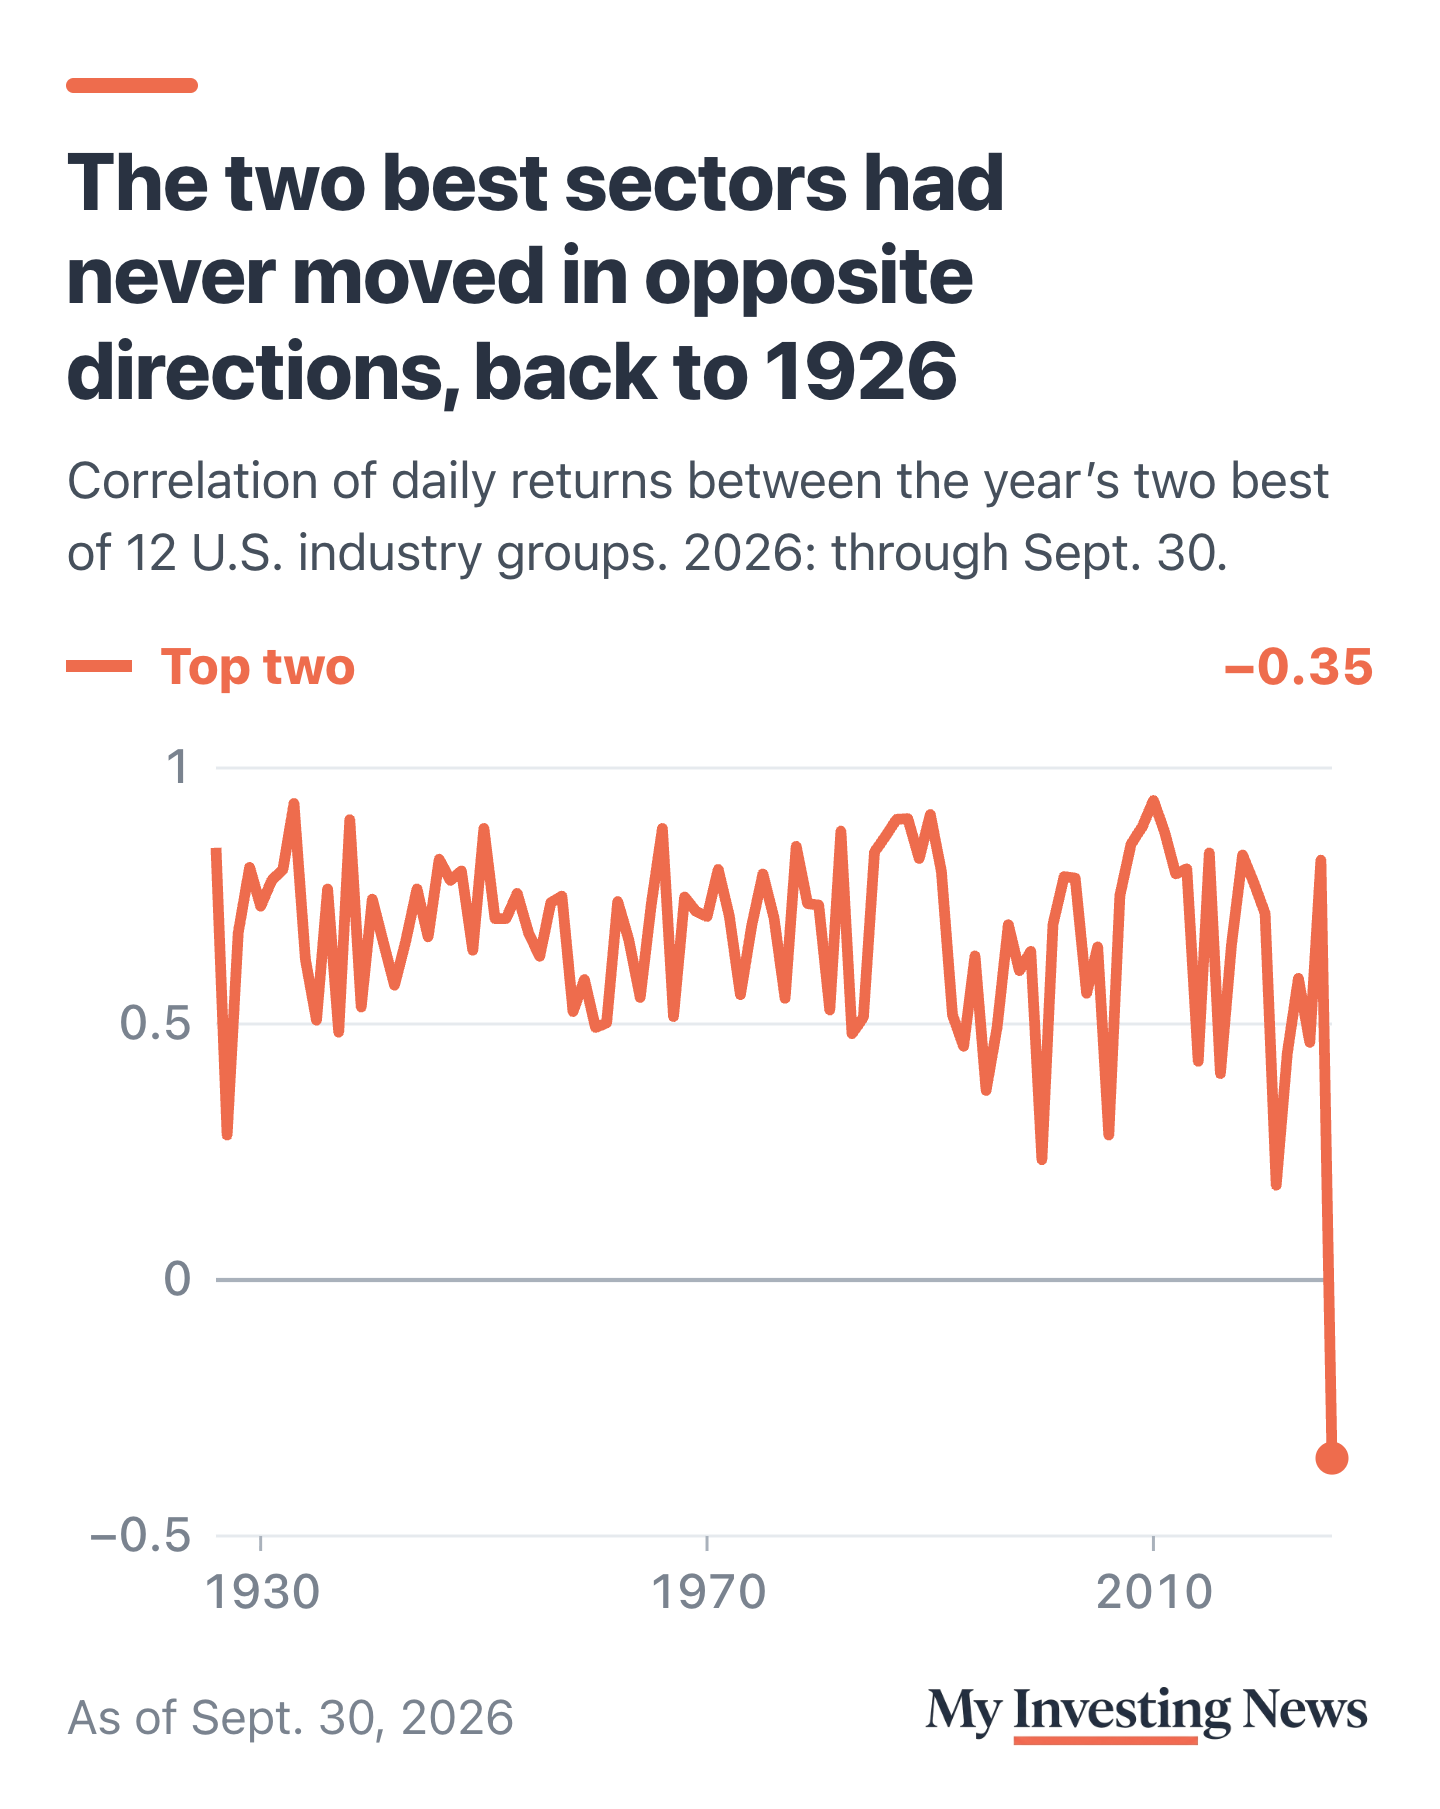
Energy and tech have drifted apart before without both leading. Their correlation slipped just below zero in 2000, at -0.02, as the dot-com bubble burst. In the 2010s it averaged 0.62. This year is the first time the two have both led and moved opposite.
Where the Claim Gets Softer
French’s groups are broad and don’t match the S&P 500’s 11 sectors exactly. Business equipment covers computers, software and chips, and energy covers oil, gas and coal. Slice the market finer and the record is less clean. Using French’s 49 industries, the year’s top two had a slightly negative correlation in four earlier years: 1935, 1979 (gold and construction), 1993 (autos and gold) and 2000 (coal and tobacco). In 2026 the top two of 49 are computer hardware and oil, at -0.04.
The leaders are also shifting. With health care now second among the sector funds, the new top pair also moves in opposite directions: energy and health care funds had a correlation of -0.11 through Nov. 9. Leadership has been widening, too. In October, Sonders pointed out that fewer than half of S&P 500 stocks were above their 200-day average. On the Nov. 6 podcast she said about 75% of the index’s members had beaten it over the past month, up from 17% a few weeks earlier.
What Came Next, the Few Times It Happened
The four narrow-industry precedents don’t point one way. The S&P index rose 27.9% in 1936 and 25.8% in 1980, slipped 1.5% in 1994 and fell 13% in 2001, price only. Four cases is anecdote, and none involved two groups as big as energy and tech. This fall we also checked her point that profitable small caps had retaken the lead, and the numbers backed it.
What to Watch
French’s data library adds a month at a time, so the October update will show whether the negative reading survived the late-October swings. The simpler test is the year-end ranking. If tech stays out of the top two through December, Sonders’ first-in-50-years pair becomes a first for most of the year, and the question shifts to whether energy and health care keep moving apart too.
Sonders’ claim checks out, and then some: in French’s 12 industry groups, 2026 is the first year since at least 1926 that the two leaders moved in opposite directions, at -0.35 through September. Finer cuts of the market show a few close precedents, with mixed results the next year. Tech has slipped since Oct. 28, so the record may hold for most of 2026 rather than all of it.