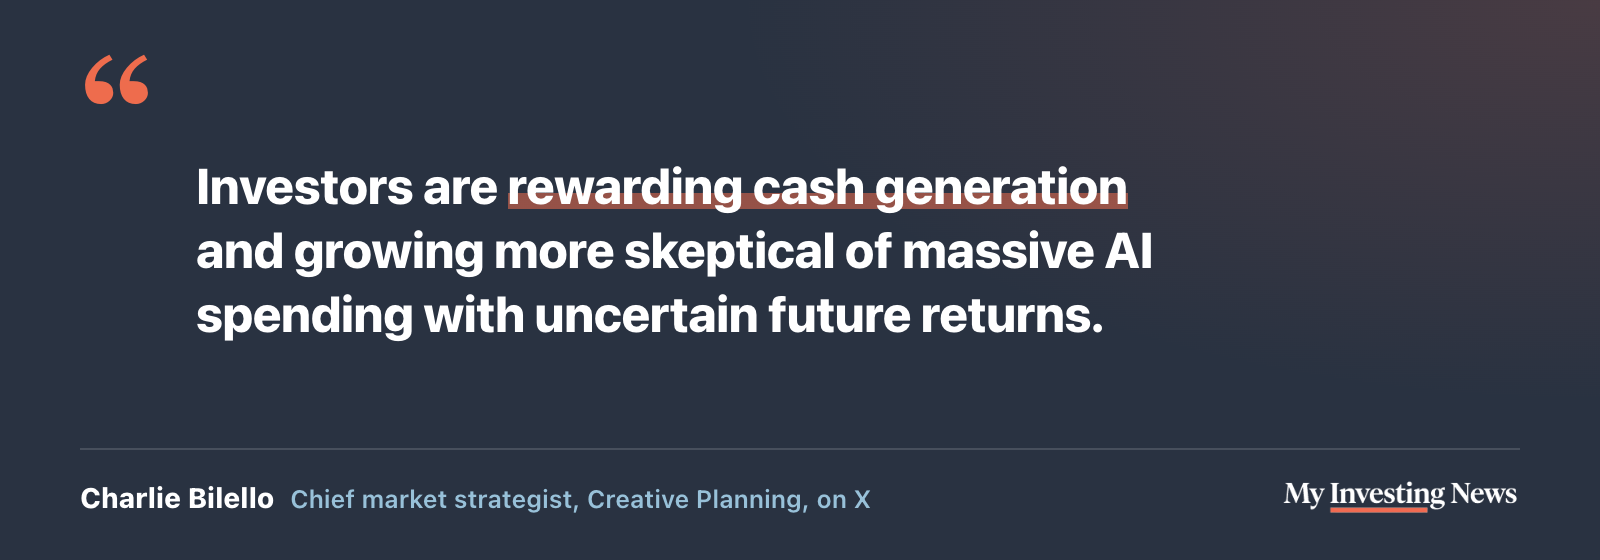
Where we heard itTwo posts on X, Oct. 27, 2026. Charlie Bilello, chief market strategist at Creative Planning, on the Magnificent Seven’s returns and cash flow (post), and The Kobeissi Letter, a markets newsletter, on Apple’s correlation with the Nasdaq 100 (post).
AppleAAPL has spent the fall going its own way. From Aug. 10 through the Oct. 27 close, the stock rose 12.6% while the Nasdaq 100 gained 0.1%. Two widely followed accounts on X flagged the split on Oct. 27, from different angles.
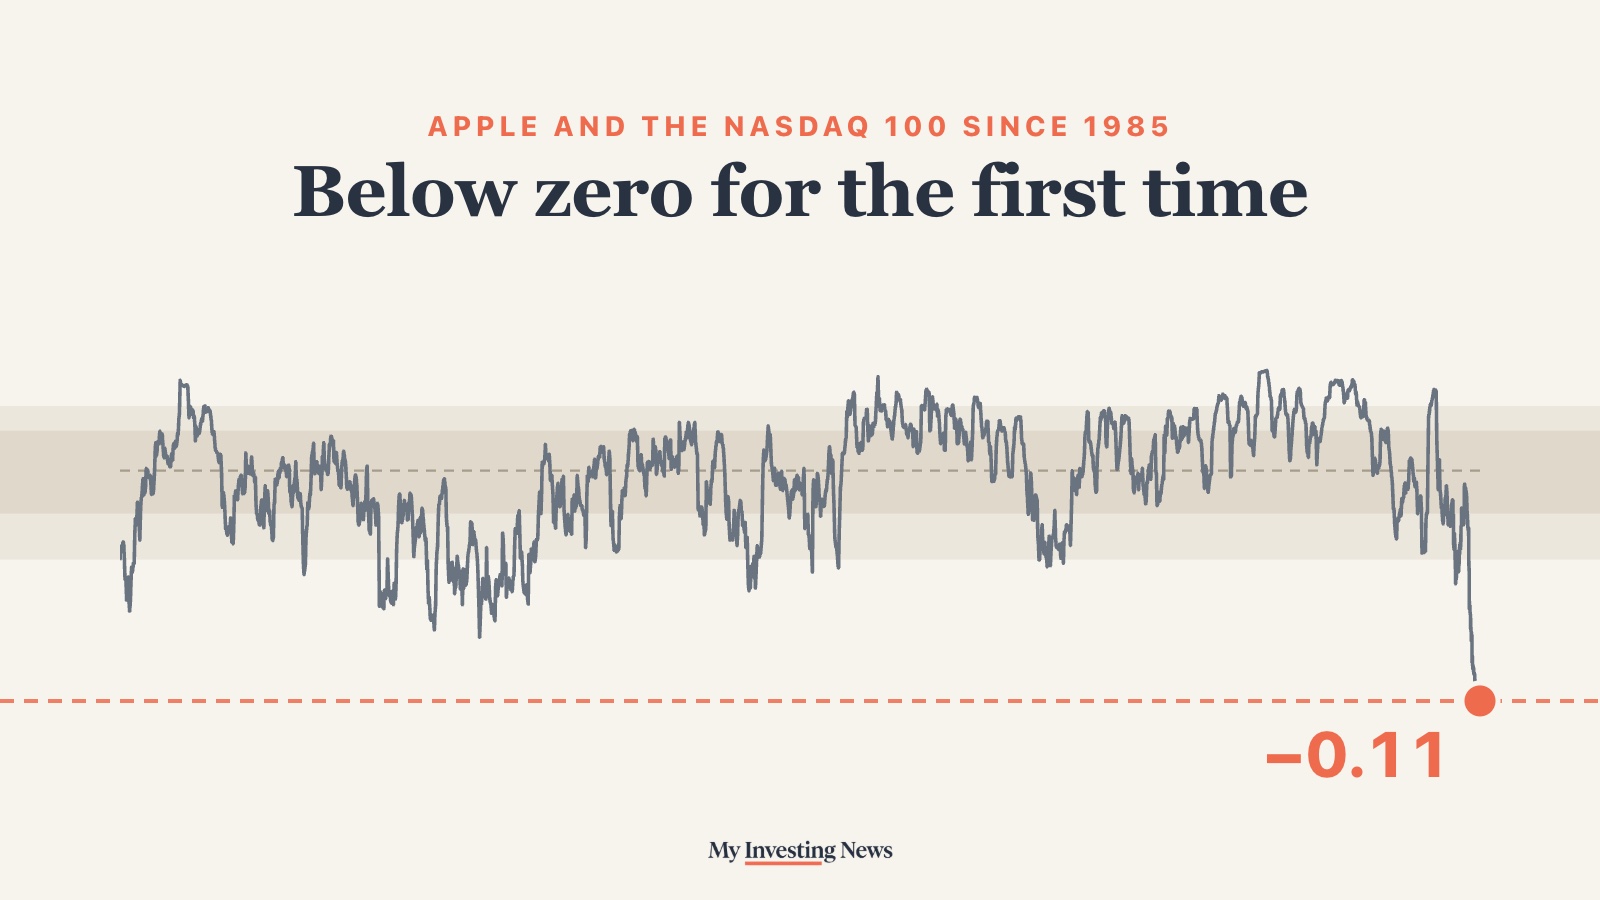
The Kobeissi Letter posted that the three-month correlation between Apple and the Nasdaq 100 had fallen to −0.12, “turning negative for the first time on record in data going back to the early 1980s.” Charlie Bilello, chief market strategist at Creative Planning, posted that only two of the Magnificent Seven were beating the market this year, Apple and NvidiaNVDA, and that “they rank #1 and #2 in free cash flow.” His explanation:

A Link That Held for 40 Years
We checked the correlation claim with Yahoo Finance daily closes. For every trading day since Dec. 31, 1985, we measured how closely Apple’s daily price moves tracked the Nasdaq 100’s over the prior 63 trading days, about three months. A reading of 1 means the two move in lockstep, 0 means no relationship, and a negative number means they tend to move in opposite directions.
The measure first dropped below zero on Aug. 10, 2026, and had stayed there for 56 straight trading days through Oct. 27, when it stood at −0.11. It bottomed at −0.17 on Sept. 22. In more than four decades of daily readings before that run, it never went negative. The lowest was +0.10 on Oct. 18, 1996, and the typical reading was +0.64. Kobeissi’s other markers check out: the measure peaked at +0.91 in June 2025, and from 2006 through 2025 its low was 0.298 in July 2007, a hair under the +0.30 floor Kobeissi cited.
Apple’s three-month link to the Nasdaq 100 fell below zero in August, for the first time since 1985
Correlation of Apple’s daily returns with the Nasdaq 100’s over the prior 63 trading days, about three months. At 1 the two move in step, at 0 there is no link, and below 0 they tend to move in opposite directions. The bands hold the middle half and middle 80% of all 10,285 daily readings since Dec. 31, 1985.
Two caveats keep the record precise. The Nasdaq 100 only dates to 1985, so Kobeissi’s “early 1980s” has to lean on another index. Against the broader Nasdaq Composite, which has data from 1981, Apple’s three-month correlation briefly dipped below zero once before, in late December 1983 and early January 1984, with a low of −0.06. The record also depends a little on the window. Over 42 or 66 trading days the 2026 drop is also a first, while the six-month reading bottomed this year at +0.01 and never turned negative.
Apple’s own earnings did part of the work. The 63-day window that ended Oct. 27 opens with July 30, the day Apple released its June-quarter results after the close. The Nasdaq 100 rose 3.4% that session while Apple slipped 1.4%, and on July 31, the first session after the report, Apple fell 7.4% while the index rose 0.6%. Leave out those two sessions and the correlation from Aug. 3 to Oct. 27 is −0.05. The split holds without them, but it is smaller.
Apple and the Nasdaq 100, as of the Oct. 27 close
Checking Bilello’s Cash Claim
Bilello’s chart used total returns, including dividends, through Oct. 26. Our Yahoo numbers match his to within a tenth of a point for all seven stocks. One more day didn’t change the picture. Through Oct. 27, Apple was up 28.0% and Nvidia 17.1%, against 13.7% for the S&P 500 through the SPDR S&P 500 ETFSPY. The benchmark matters, though. Against the Nasdaq 100, through the Invesco QQQ TrustQQQ at +17.8%, only Apple is ahead.
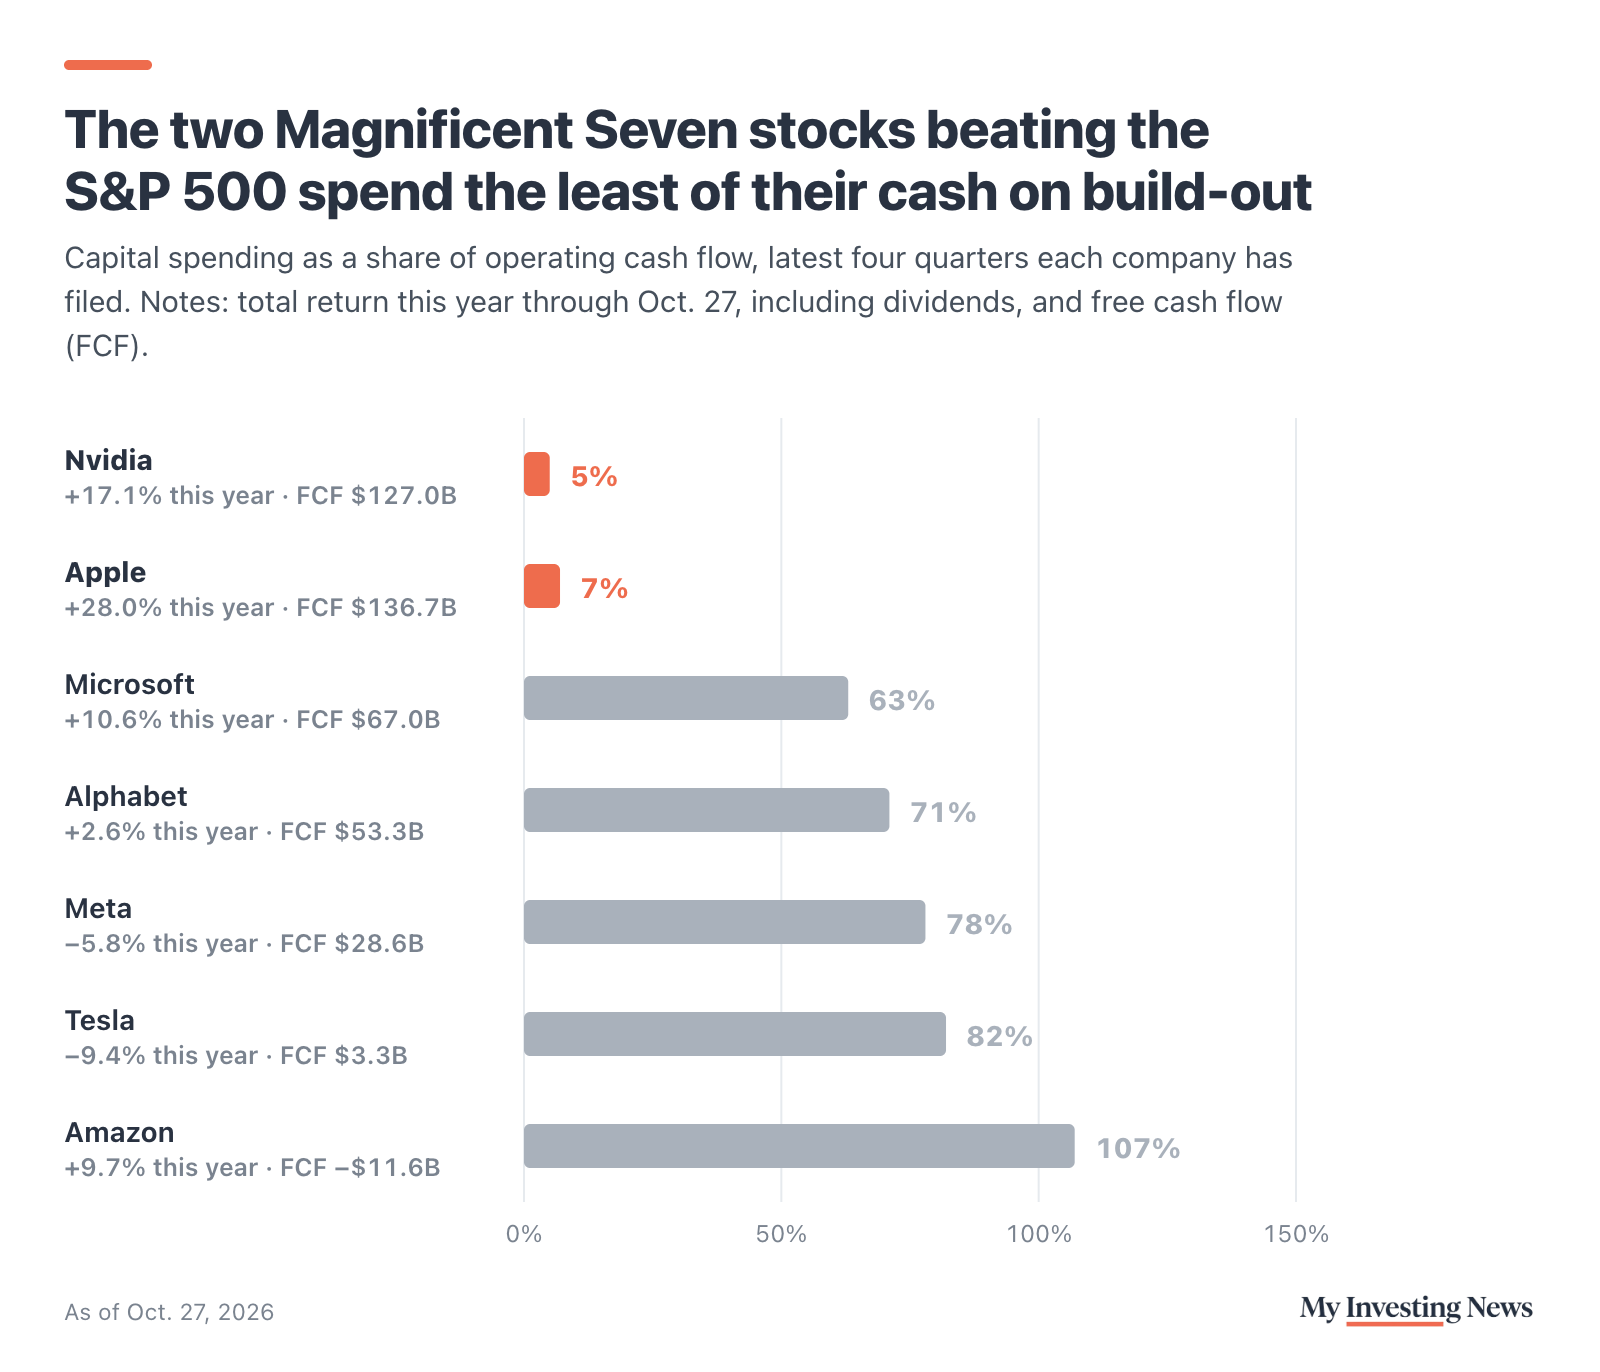
For cash flow, we used each company’s SEC filings: operating cash flow minus capital spending over the latest four quarters each has reported, which end in different months because fiscal years differ. Apple ranks first at $136.7 billion and Nvidia second at $127.0 billion. MicrosoftMSFT is a distant third at $67.0 billion, followed by AlphabetGOOGL at $53.3 billion, MetaMETA at $28.6 billion and TeslaTSLA at $3.3 billion. AmazonAMZN is last, at −$11.6 billion, because it spent more on property and equipment than its operations brought in.
Bilello’s ranking holds up, and the pattern runs deeper than the top two. Six of the seven stocks line up in the same order on free cash flow and on this year’s return. Amazon is the exception: last on cash flow, fourth on return, up 9.7%.
Why the Spending Matters
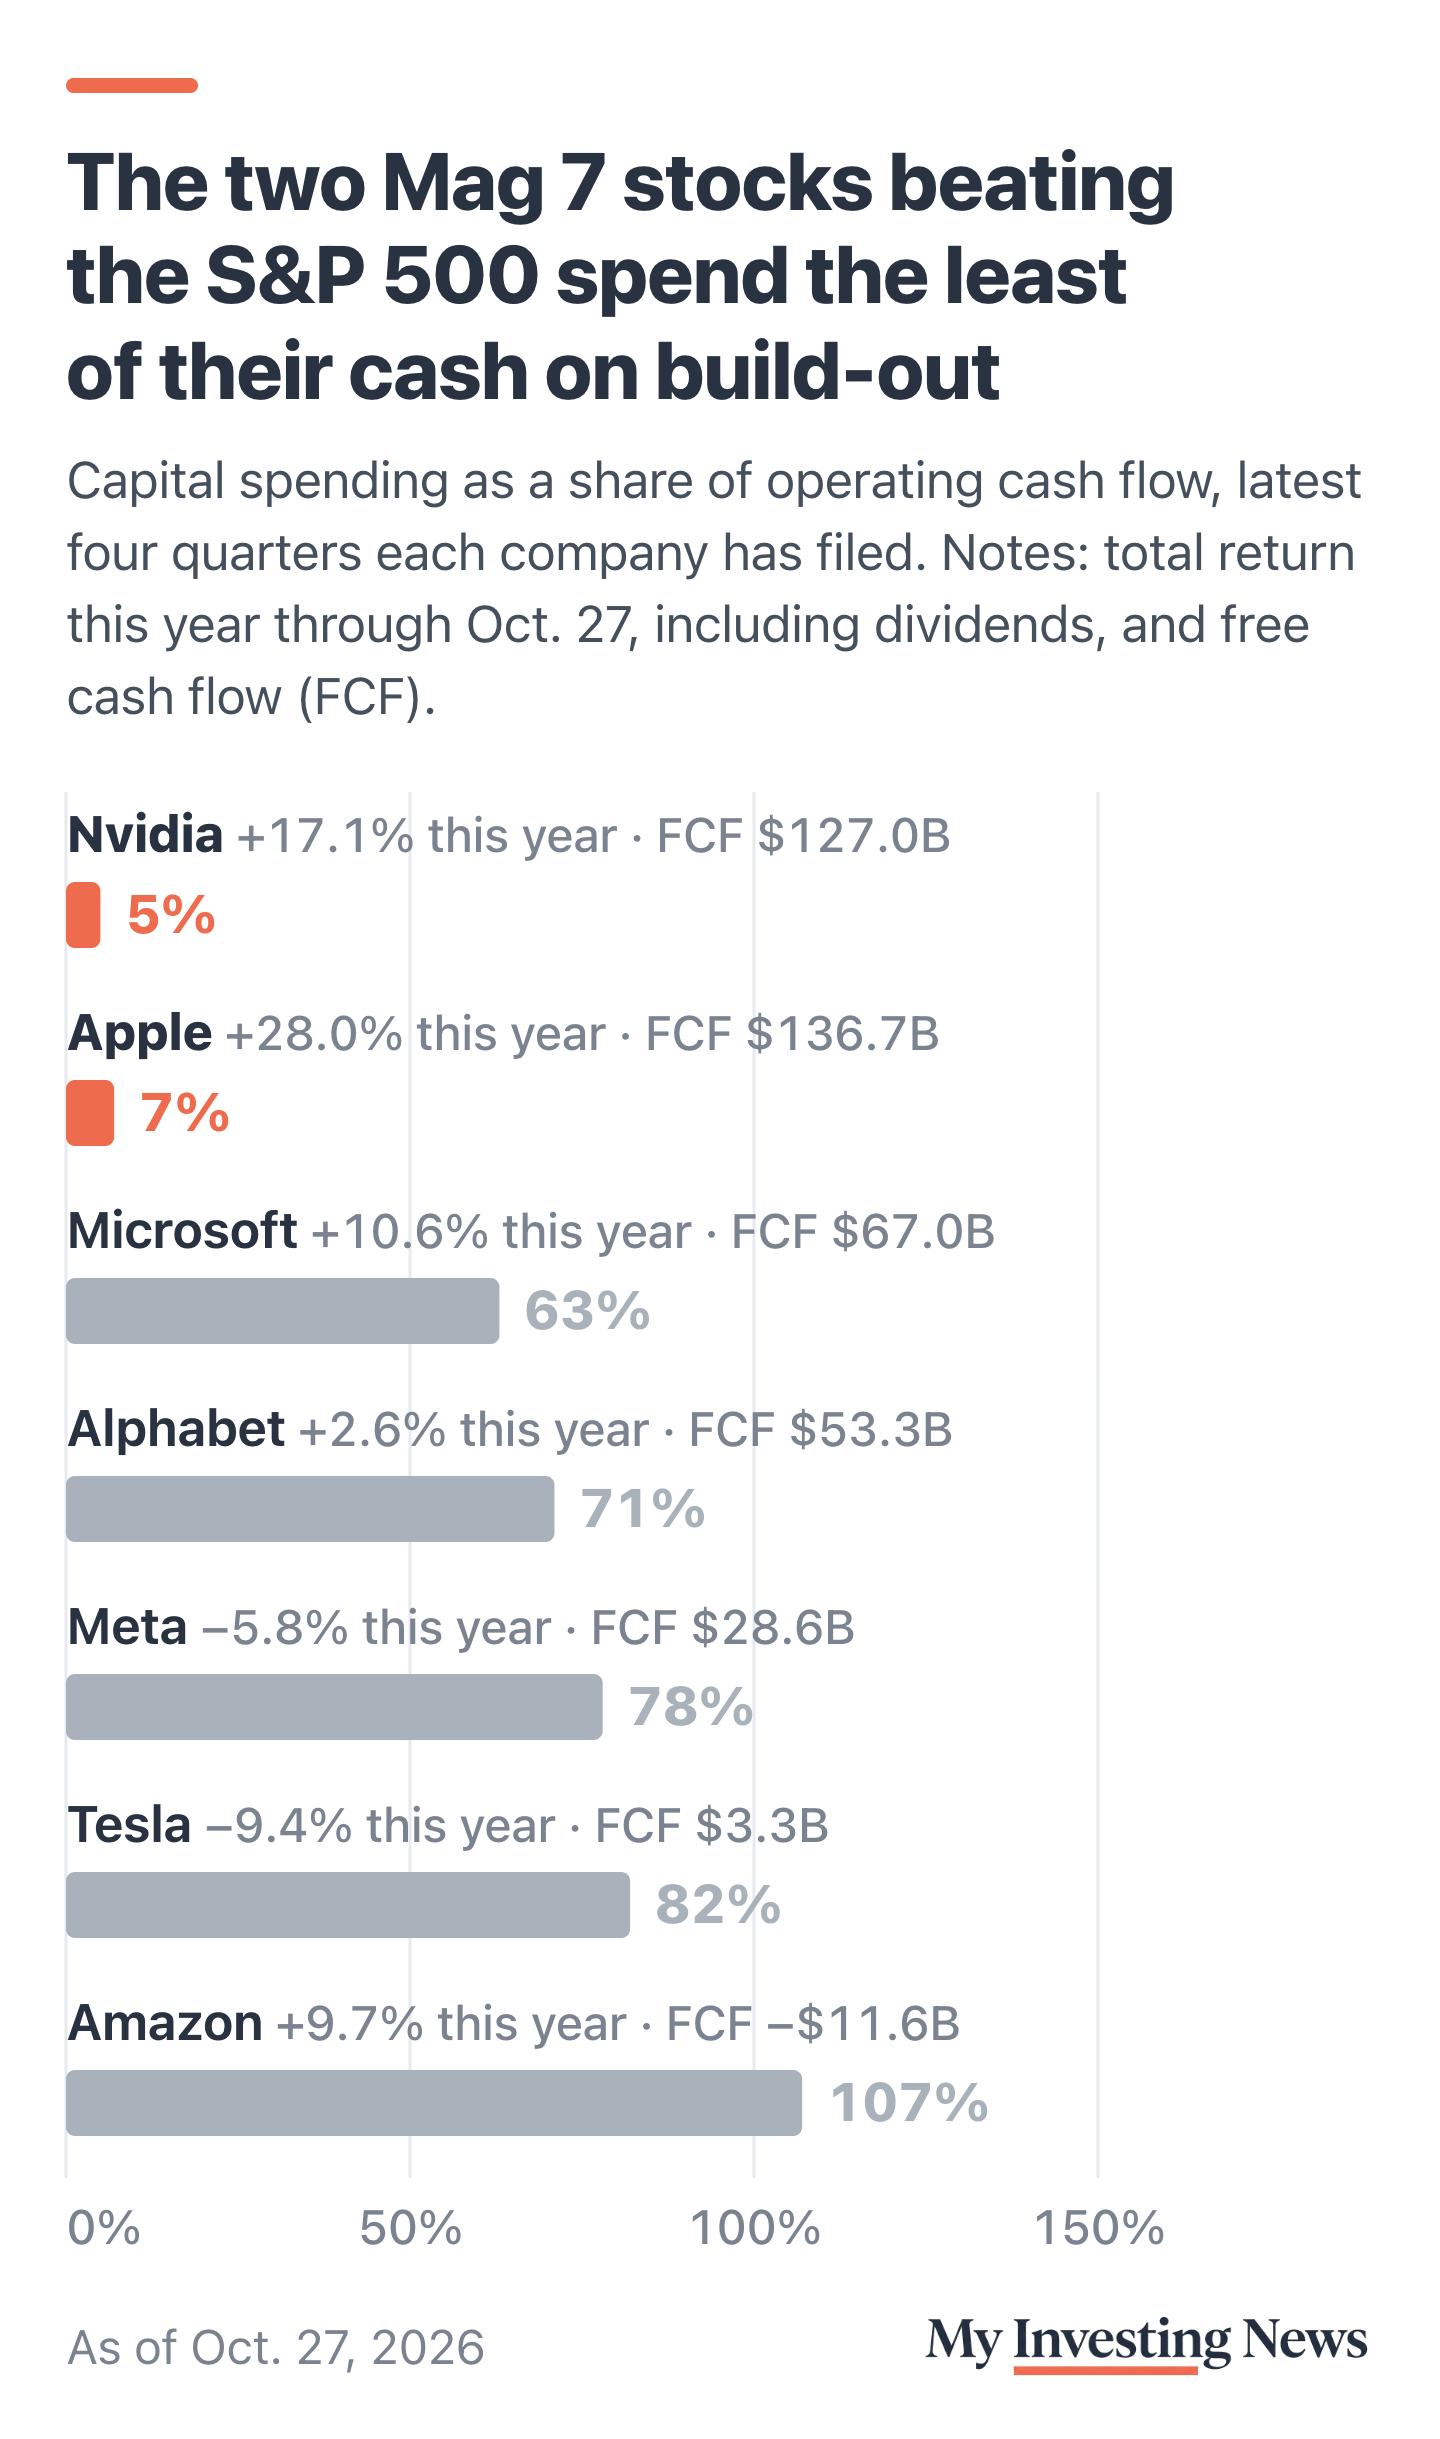
The gap is mostly about capital spending. Apple put 7% of its operating cash flow back into property and equipment over its latest four quarters, and Nvidia 5%. Microsoft, Alphabet and Meta spent 63% to 78%, and Amazon 107%. Investors have heard warnings about that build-out: Ken Griffin compared GPUs to airline seats in October, saying prices could collapse if supply outruns demand.
Apple’s news this fall has come from its phones. The iPhone Duo sold out within minutes when preorders opened Oct. 16, and Apple has since committed up to $100 million to a titanium supplier as demand outruns supply. A correlation can’t say why two prices split, only that they did, and seven stocks over ten months is a small sample for any rule about cash.
What to Watch
The correlation can move fast. Each trading day the oldest day drops out of the window, and July 30 and July 31, two of the days that pushed it lower, roll out first, on Oct. 28 and Oct. 29. A reading back above zero would end the streak but not the record.
The cash ranking will also update soon. Microsoft and Alphabet are due to report on Oct. 28 and Amazon on Oct. 29, according to Nasdaq’s earnings calendar, and Apple is scheduled for Nov. 2 after the close.
Apple’s three-month correlation with the Nasdaq 100 turned negative on Aug. 10 for the first time since the index began in 1985, and it stood at −0.11 on Oct. 27. Bilello’s point holds: the two Magnificent Seven stocks beating the S&P 500 generate the most free cash, and six of the seven line up the same way. The risk is that a three-month reading moves fast: two late-July sessions are still in it, and without them it sits closer to zero.