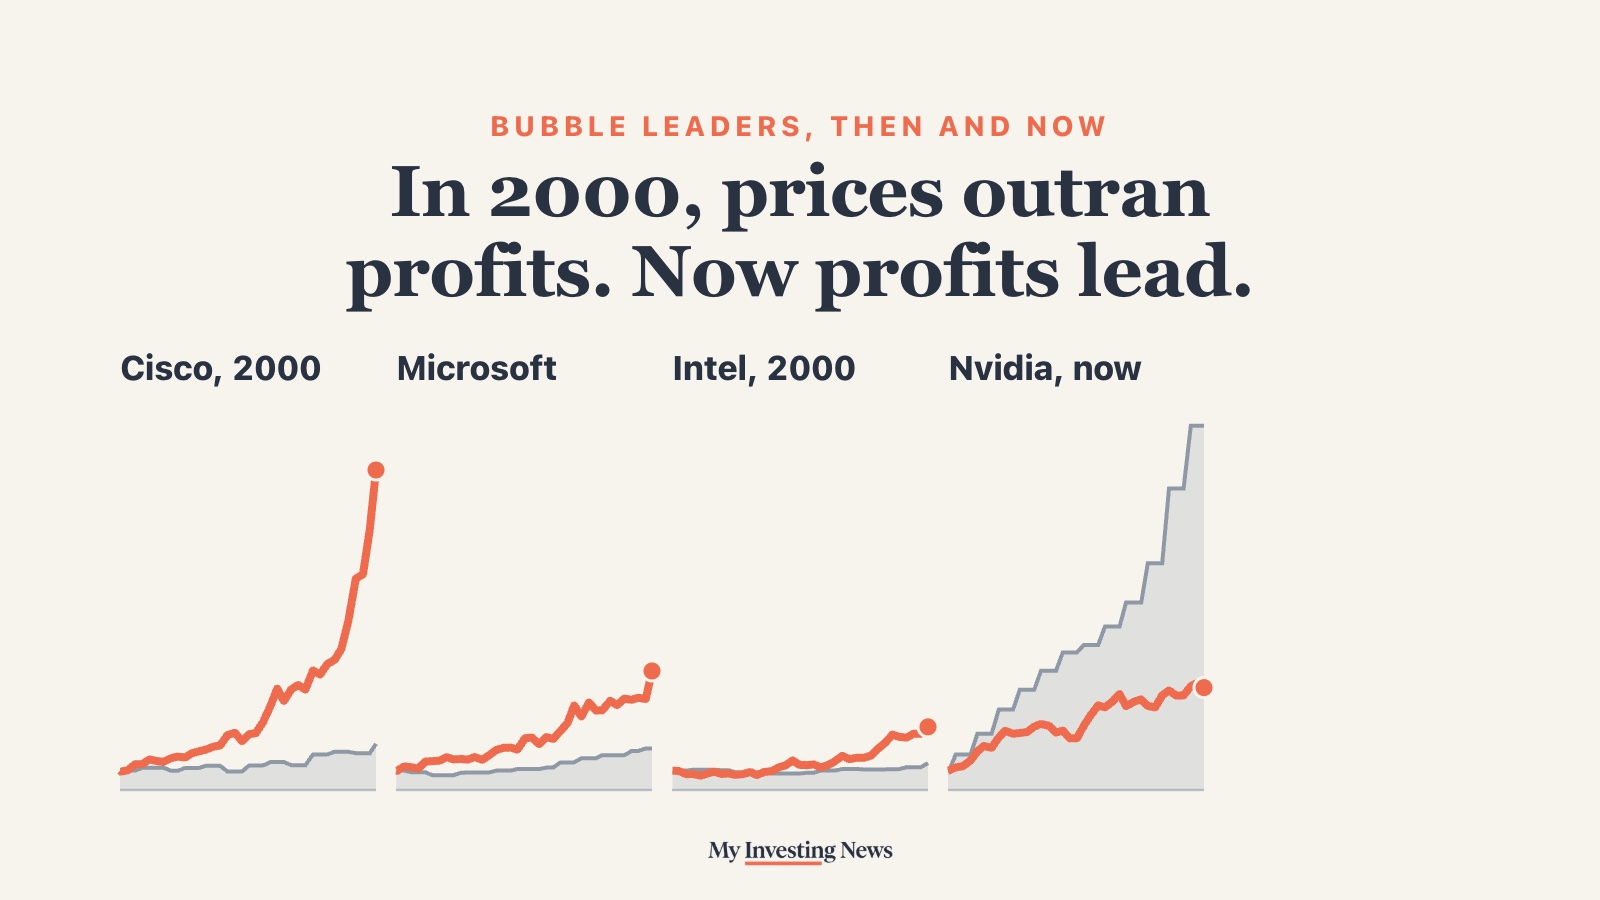
Where we heard itCNBC, Halftime Report, “The AI Correction, Tech Earnings and the Rally,” Oct. 27, 2026. Speaker: Josh Brown, CEO of Ritholtz Wealth Management, with panelist Jenny Harrington.
Josh Brown came onto CNBC’s Halftime Report on Oct. 27 with a list. The three cheapest stocks in the market by PEG ratio, he said, were SandiskSNDK at 0.08, MicronMU at 0.10 and Western DigitalWDC at 0.13. The PEG ratio divides a stock’s price to earnings by its expected growth rate, so a reading far below 1 means investors are paying little for that growth. Then he turned to NvidiaNVDA: “Nvidia is selling at 15.3 times forward earnings.”

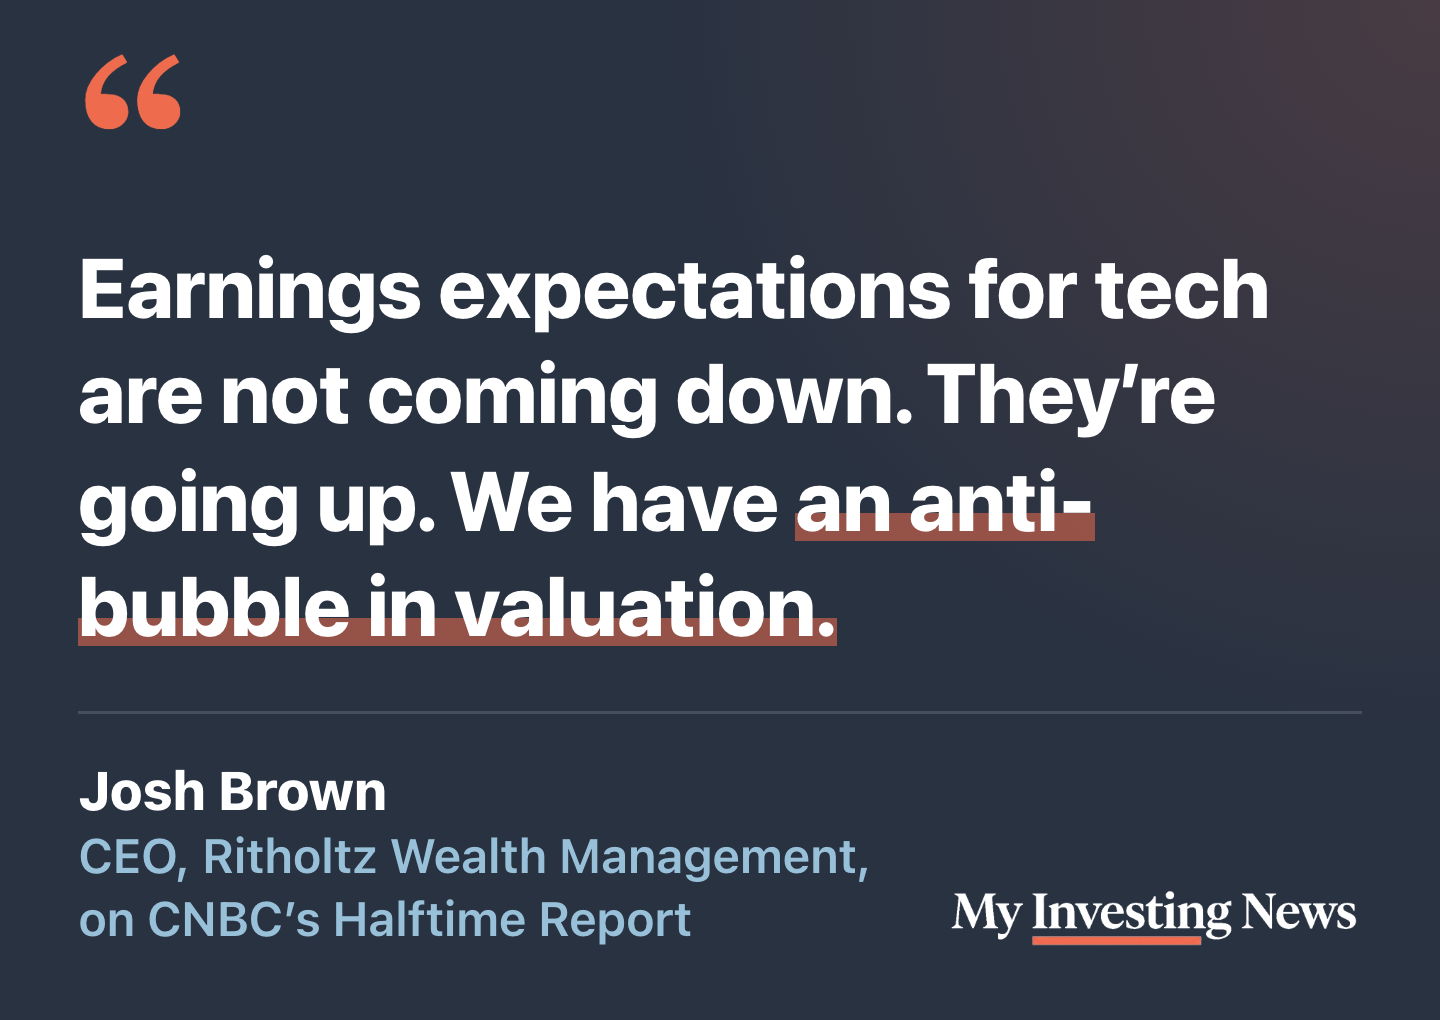
Calling it an anti-bubble is a claim about history. In a bubble, prices run ahead of what companies earn. Brown is saying the reverse has happened: profits are climbing faster than the stocks. That can be checked against the last mania built on tech hardware. Its leader was CiscoCSCO, which passed Microsoft in market value at its March 2000 high, according to our math from its filings and share price.
Checking the 15.3
Nvidia closed at $217.94 on Oct. 27. Analysts expect it to earn $13.66 a share, adjusted, over the four fiscal quarters from November 2026 through October 2027, according to the Zacks consensus published by Nasdaq. That works out to 16.0 times forward earnings, a bit above Brown’s figure; estimates and prices differ by data provider and time of day. Counting the quarter that ended in October but hasn’t been reported yet, the multiple is 18.1. Either way it sits at or below the S&P 500, which FactSet put at 18.7 times forward earnings on Oct. 23.
Micron looks cheaper still. At $928.76, it trades at 5.3 times the $176.51 a share analysts expect over its next four quarters. A JPMorgan strategist made a similar case this month, calling for semiconductor earnings growth of 150% while the group still looks cheap.
What Investors Paid in 2000
Analyst forecasts from 1999 and 2000 aren’t public in a form we can check, so we compared the companies on what they had actually earned. For each leader of the dot-com market, we took its market value at its bubble-era high close and divided it by the net income in its last four quarterly reports, using the numbers in its SEC filings at the time. We did the same for Nvidia.
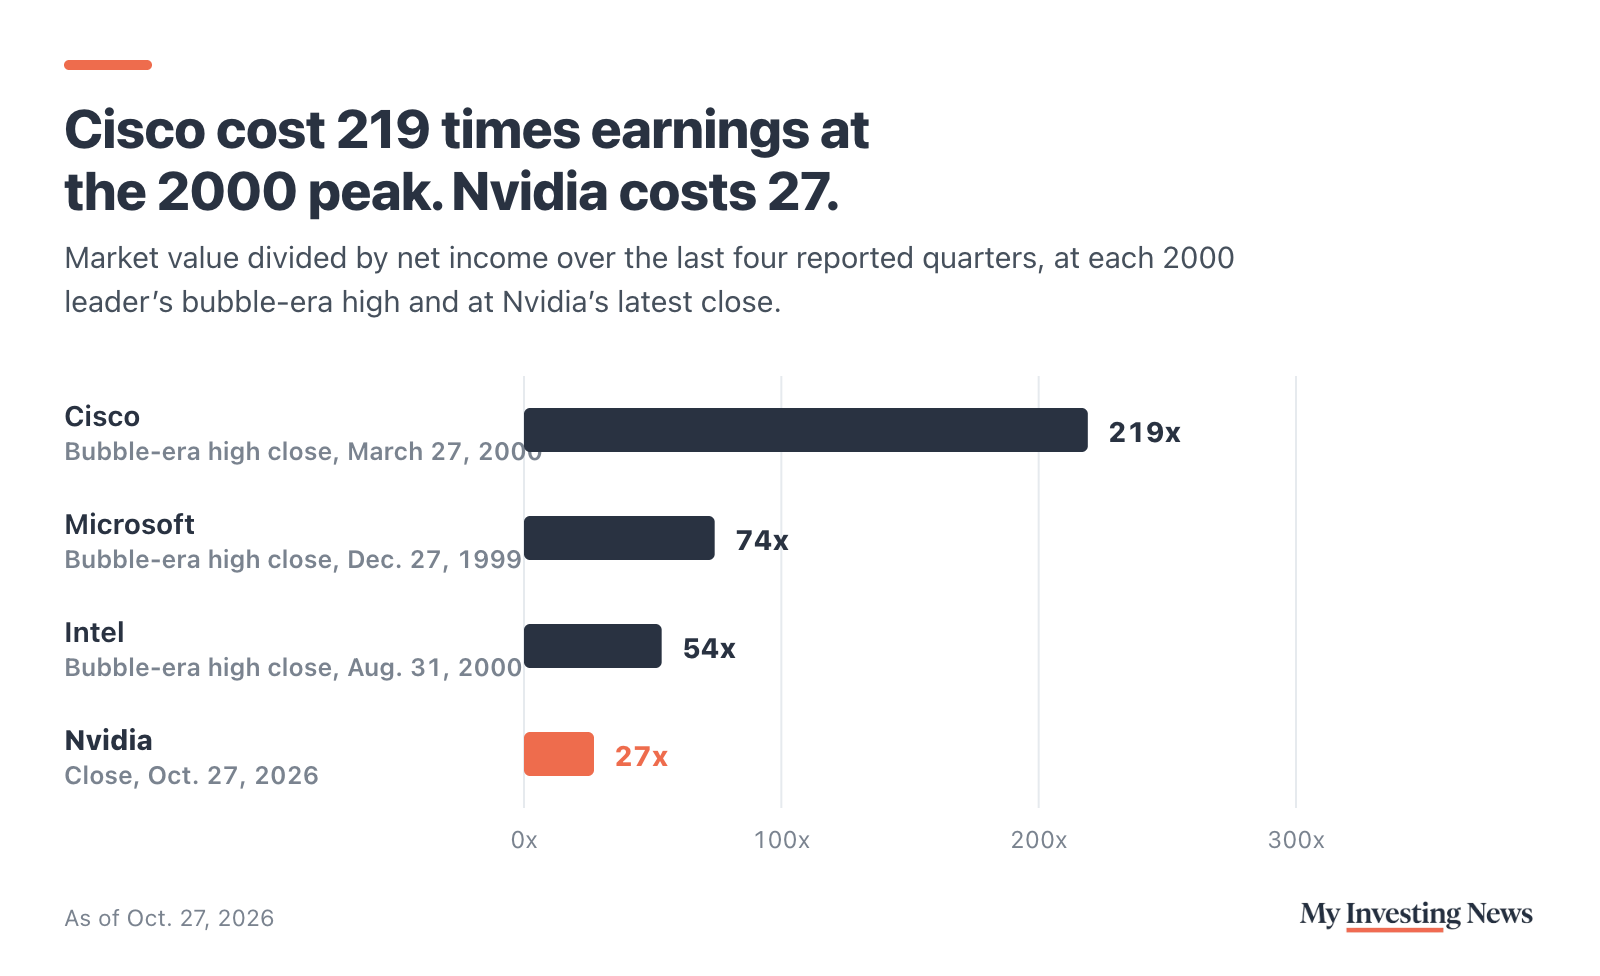
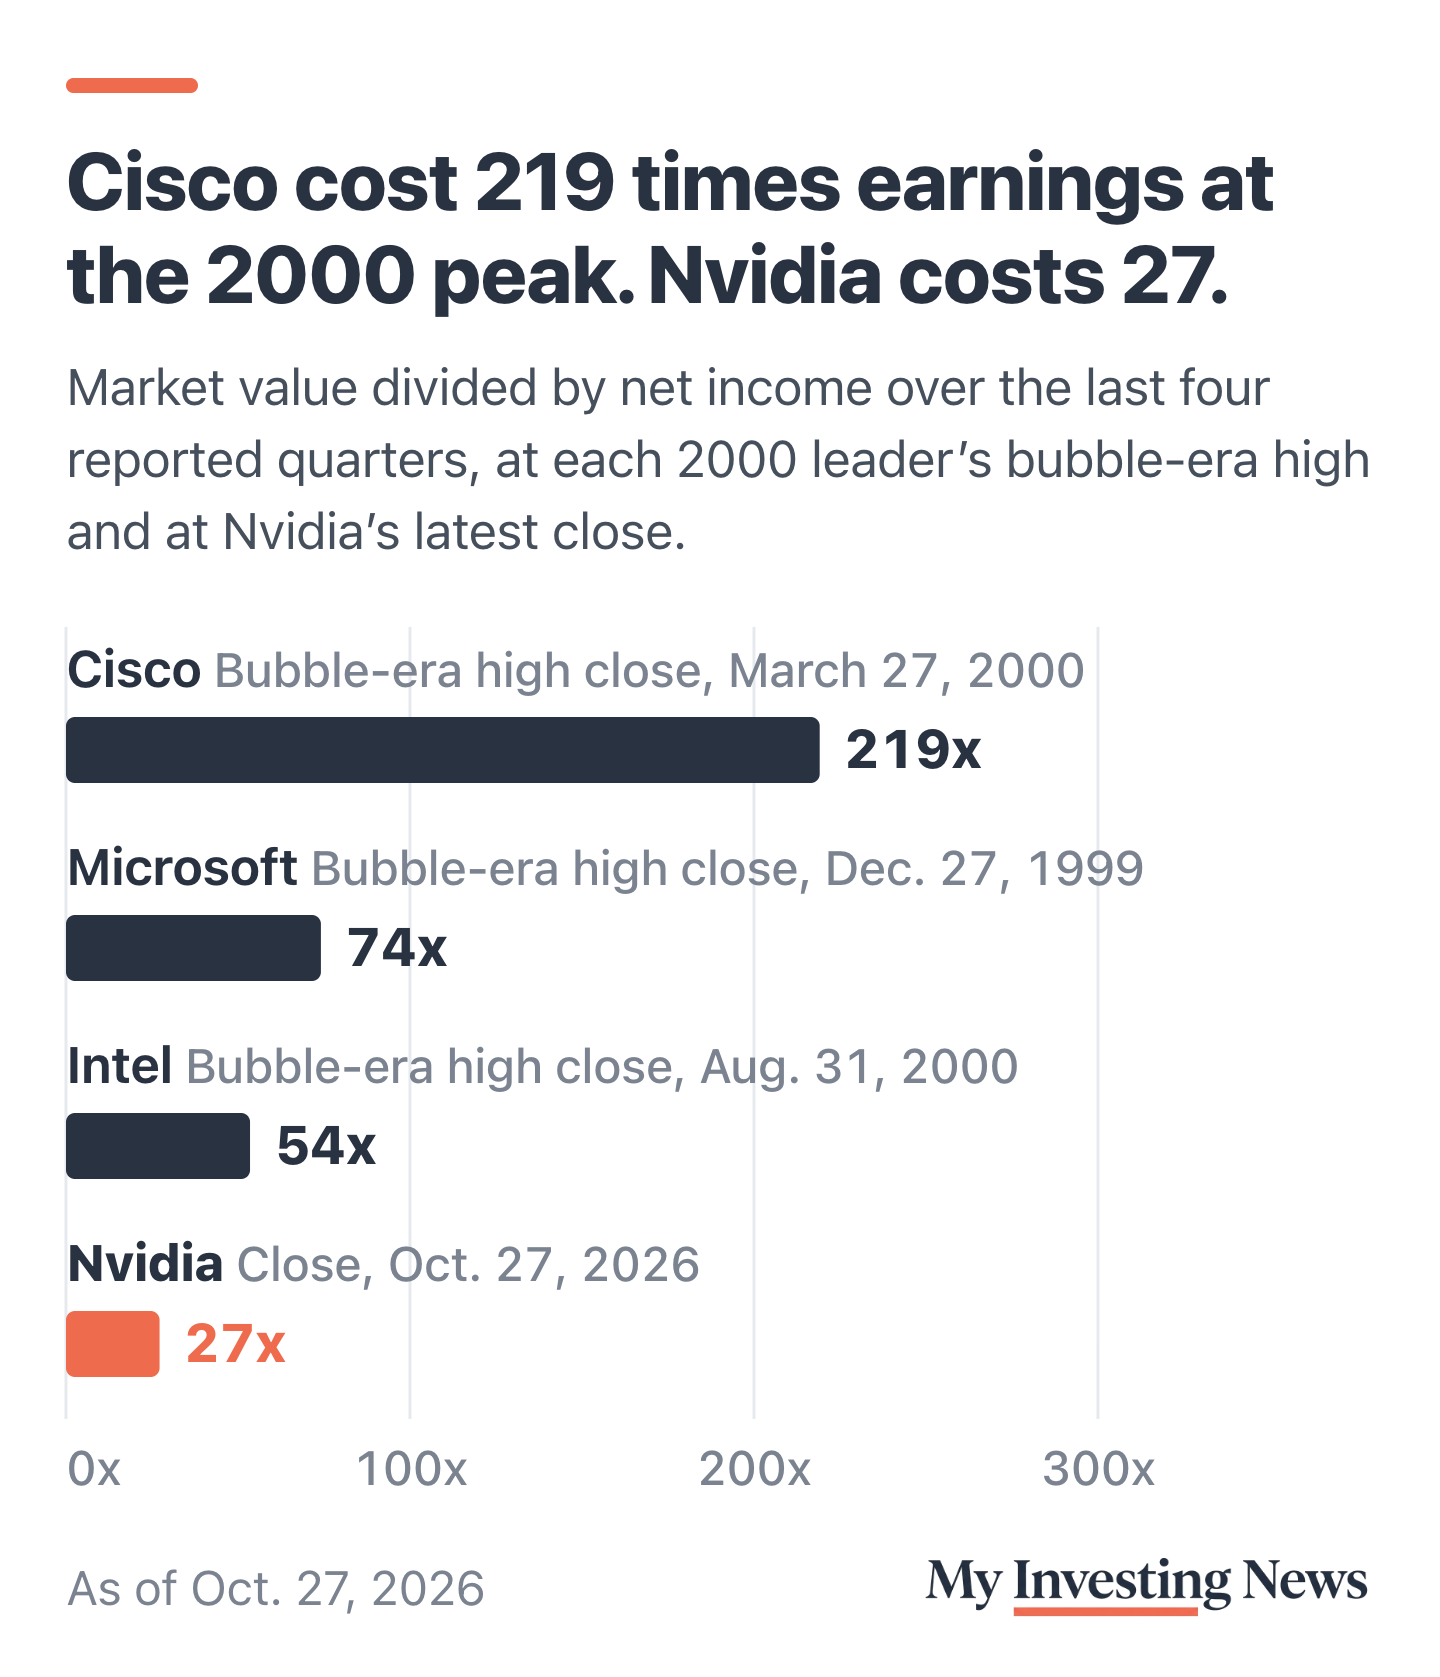
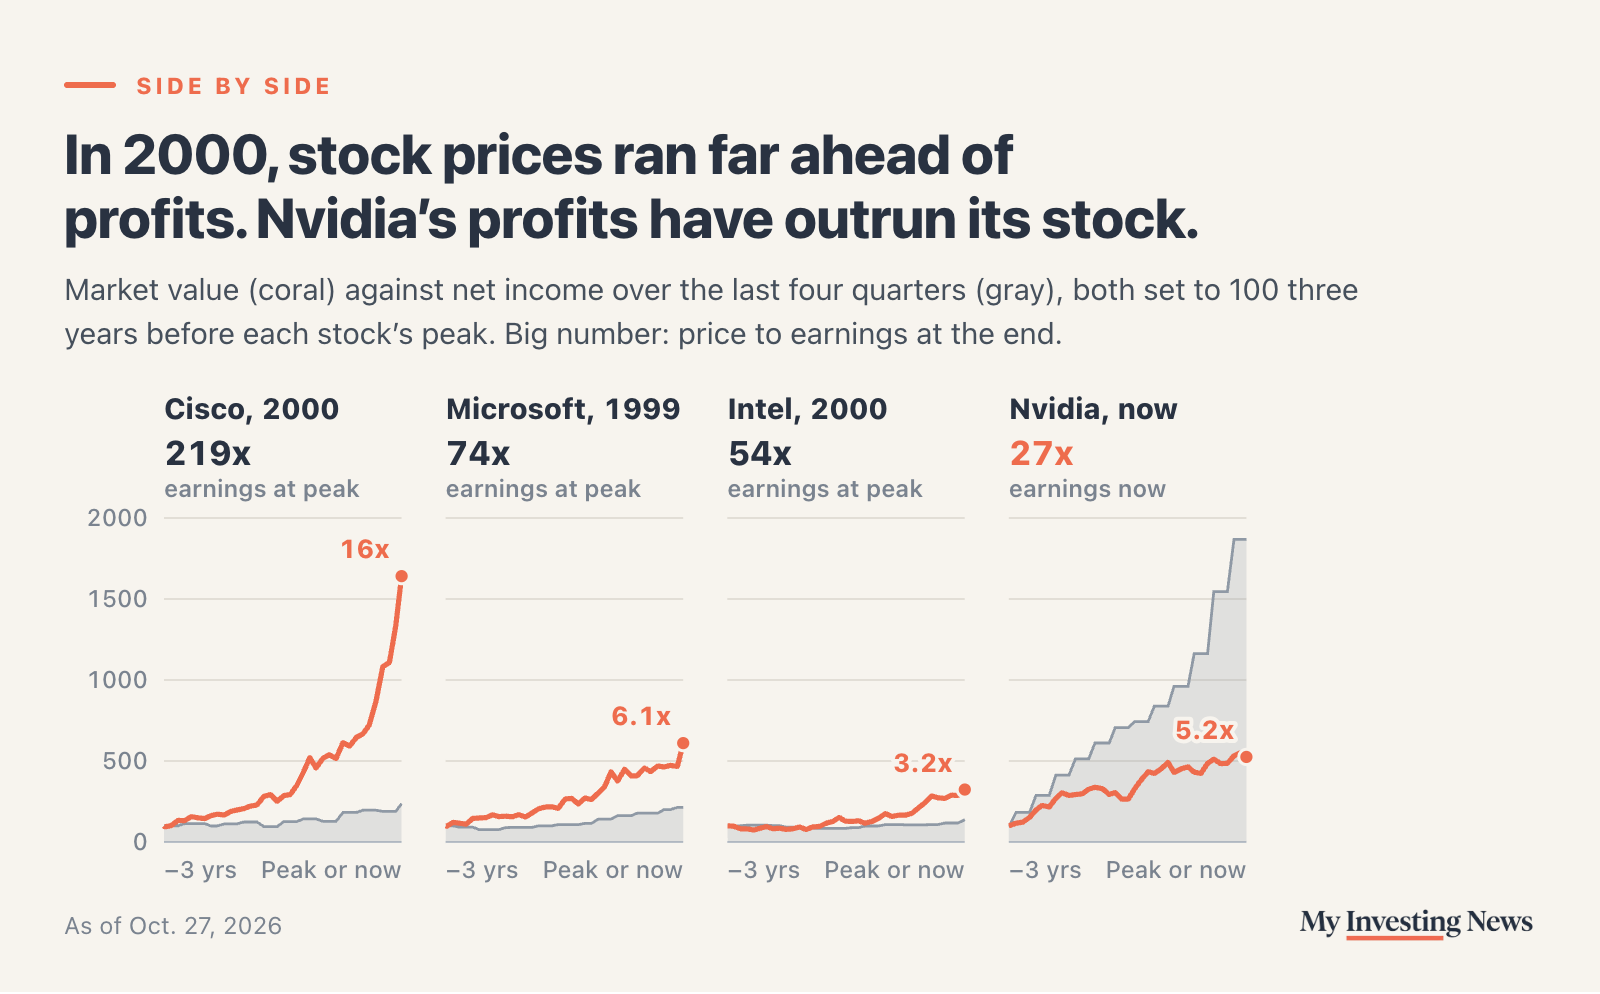
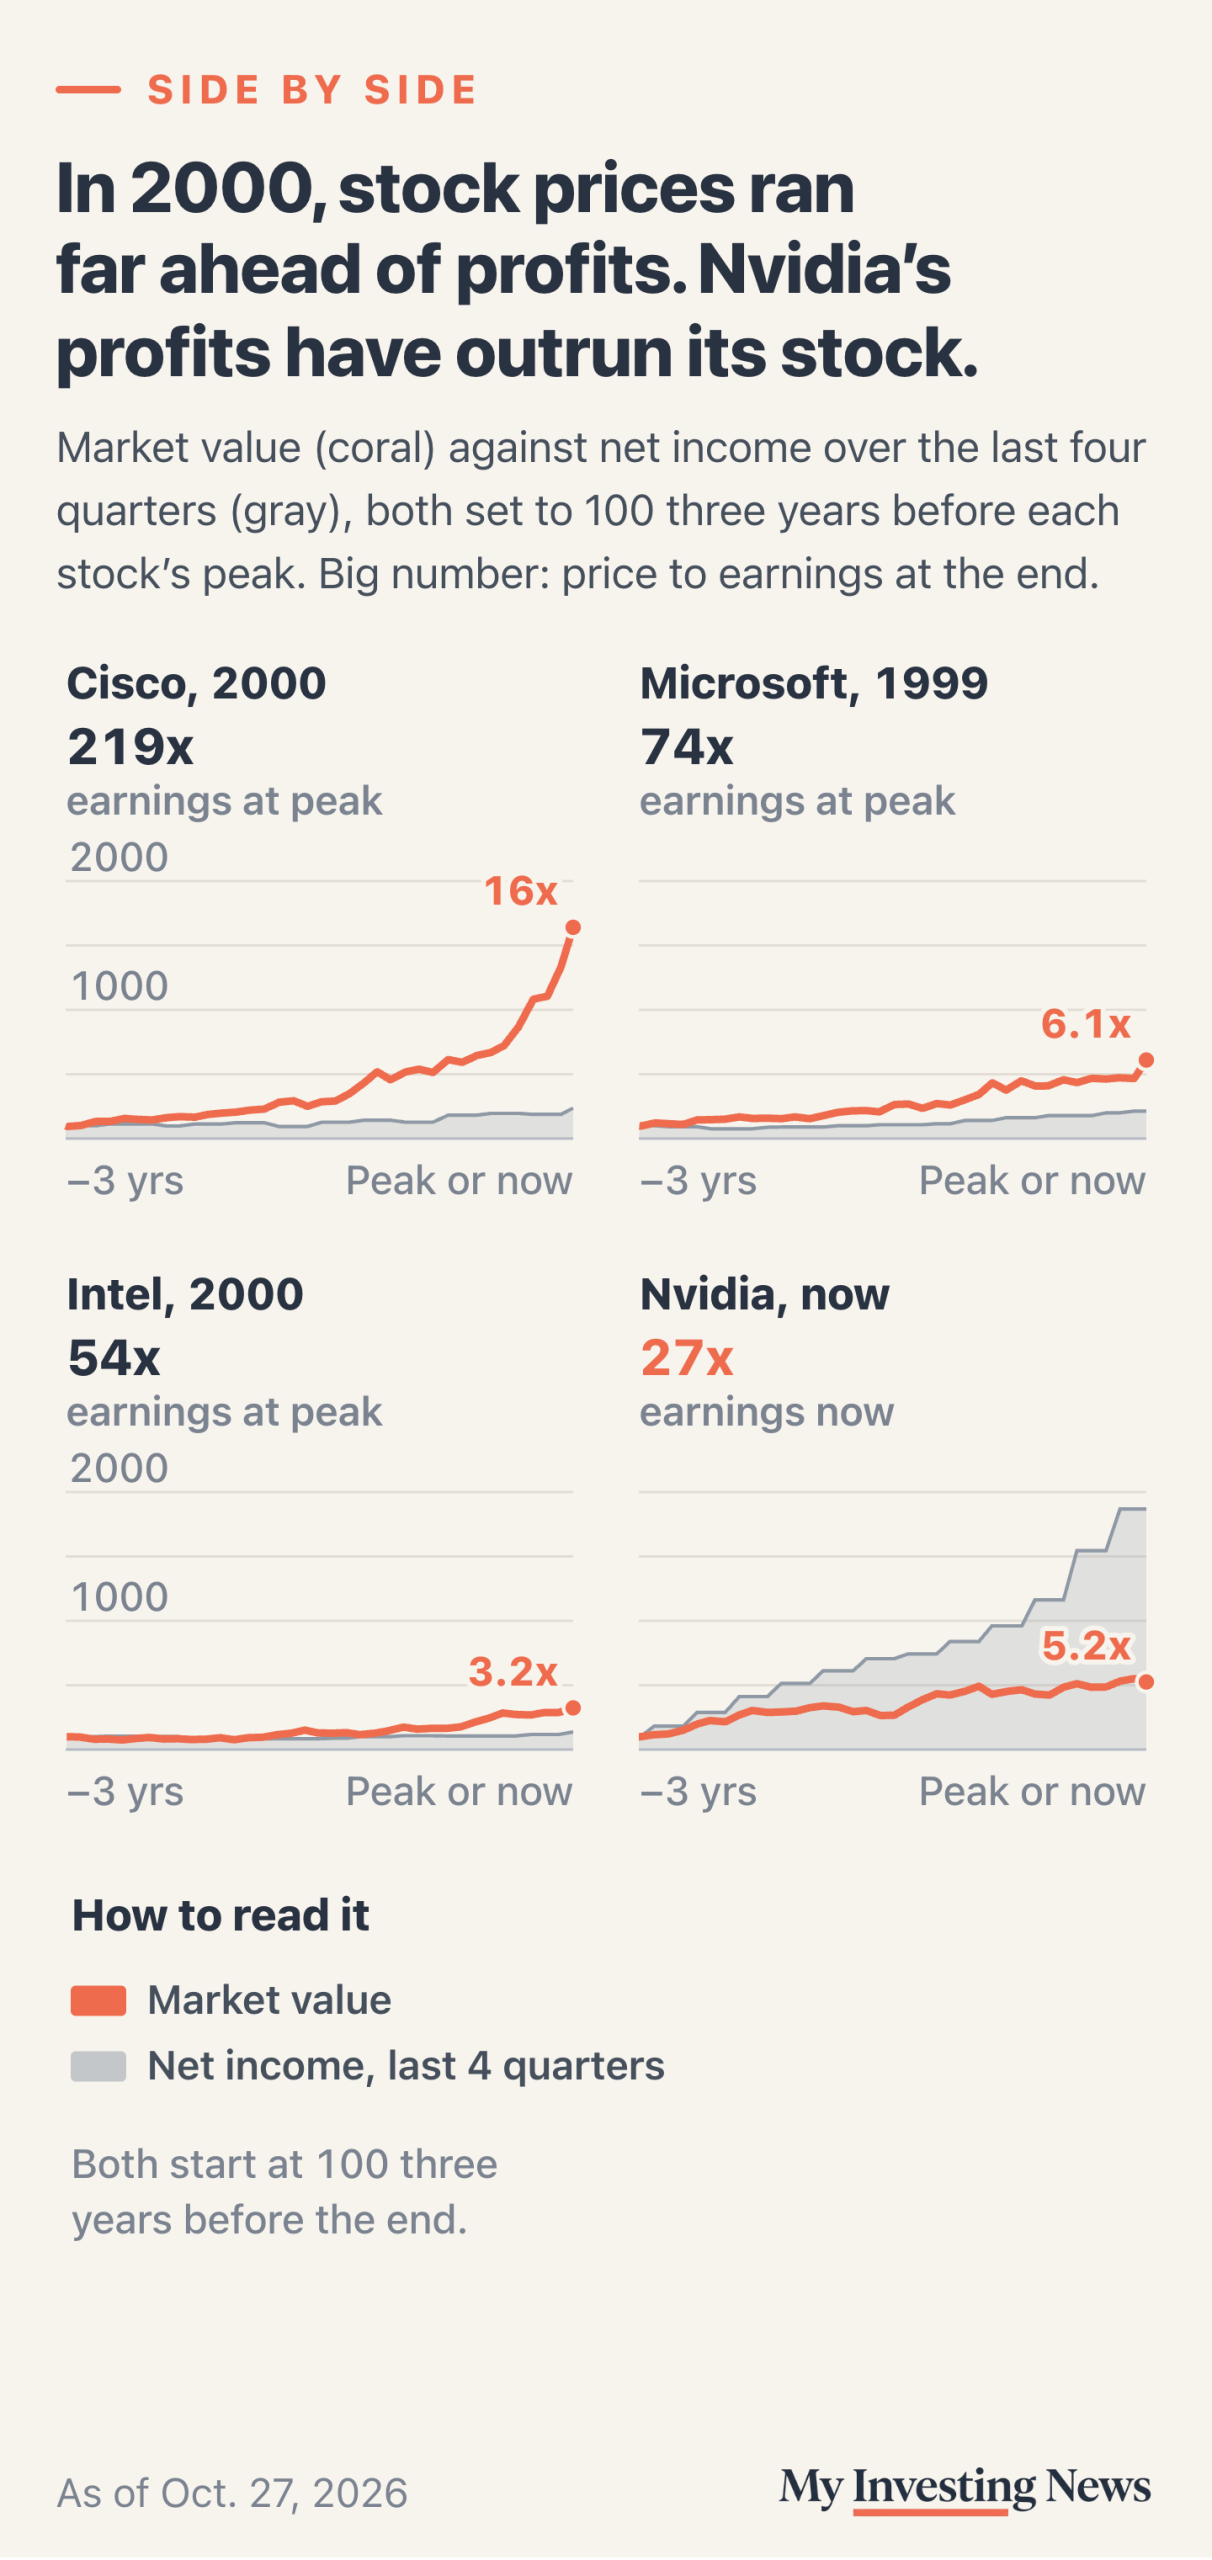
Cisco was worth $555 billion at its March 27, 2000 close and had earned $2.54 billion over the previous four quarters: 219 times earnings. MicrosoftMSFT traded at 74 times at its December 1999 high and IntelINTC at 54 times in August 2000. Nvidia, worth about $5.25 trillion, trades at 27 times the $193 billion it earned in its last four reported quarters. That profit figure includes large gains on Nvidia’s investments, $16.4 billion of nonoperating income in its April quarter alone, so the multiple on its chip business alone is somewhat higher.
The anti-bubble test, by the numbers
Profits Outran the Stock
The bigger difference shows up in the three years before each peak. Cisco’s market value rose 16.4-fold over that stretch while its trailing profit grew 2.4-fold, so its multiple climbed from 32 to 219. Microsoft’s value rose 6.1-fold against 2.1-fold profit growth, Intel’s 3.2-fold against 1.4-fold.
Nvidia ran the other way. Its market value rose 5.2-fold from Oct. 27, 2023, while its trailing profit grew 18.7-fold. Its multiple fell from 97 times earnings to 27. On this test, Brown’s description holds up.
Where the Argument Can Break
A forward multiple is only as good as the forecast under it, and that is where the 2000 comparison bites. Cisco’s earnings didn’t hold up. After reporting $2.67 billion of profit for the fiscal year that ended in July 2000, it posted a net loss of $1.01 billion the next year. Its stock fell 89% from the March 2000 high to its October 2002 low and didn’t close above that high again until Dec. 10, 2025.
Nvidia’s forecasts have so far run too low. It has topped the consensus earnings estimate in each of its last six reports, by roughly 4% to 8%. Fellow panelist Jenny Harrington, CEO of Gilman Hill Asset Management, pushed back on Brown’s reading. The PEG ratios are low, she said, because “there’s so much skepticism over the growth rates,” and strong reports can still get “a muted response, which is what we’ve seen happen to Nvidia over and over.”
Morgan Stanley’s Mike Wilson is betting the skeptics have more room to run. On his Thoughts on the Market podcast released Oct. 26, he said, “I see another 10 to 15% lower for the semiconductor index into mid-November.” The PHLX Semiconductor index closed at 11,083.47 that day, so his call points to roughly 9,421 to 9,975. It rose to 11,482.50 on Oct. 27. Options traders had been piling into semiconductor puts as chip funds slid earlier this month.
What to Watch
Nvidia reports its October quarter in November. The consensus calls for $2.49 a share. Another beat would push the forward multiple lower again without the stock moving. A miss, or a cut to the $15.74 a share analysts expect for the fiscal year ending January 2028, would be the first sign of the problem that sank Cisco. Doug Clinton has argued that the AI selloff looks like a routine drawdown. The next two earnings reports will test that too.
Brown’s anti-bubble claim survives the comparison with 2000. Cisco cost 219 times its earnings at the peak, and Nvidia’s profits have grown far faster than its stock for three years, leaving it near 16 times forward estimates. The risk is the same one that broke Cisco: the cheap multiple depends on earnings forecasts that have to keep coming true.