Where we heard itJim Bianco, president of Bianco Research, in a post on X on the morning of Nov. 10, 2026, with a chart of Brent crude and the 10-year Treasury yield.
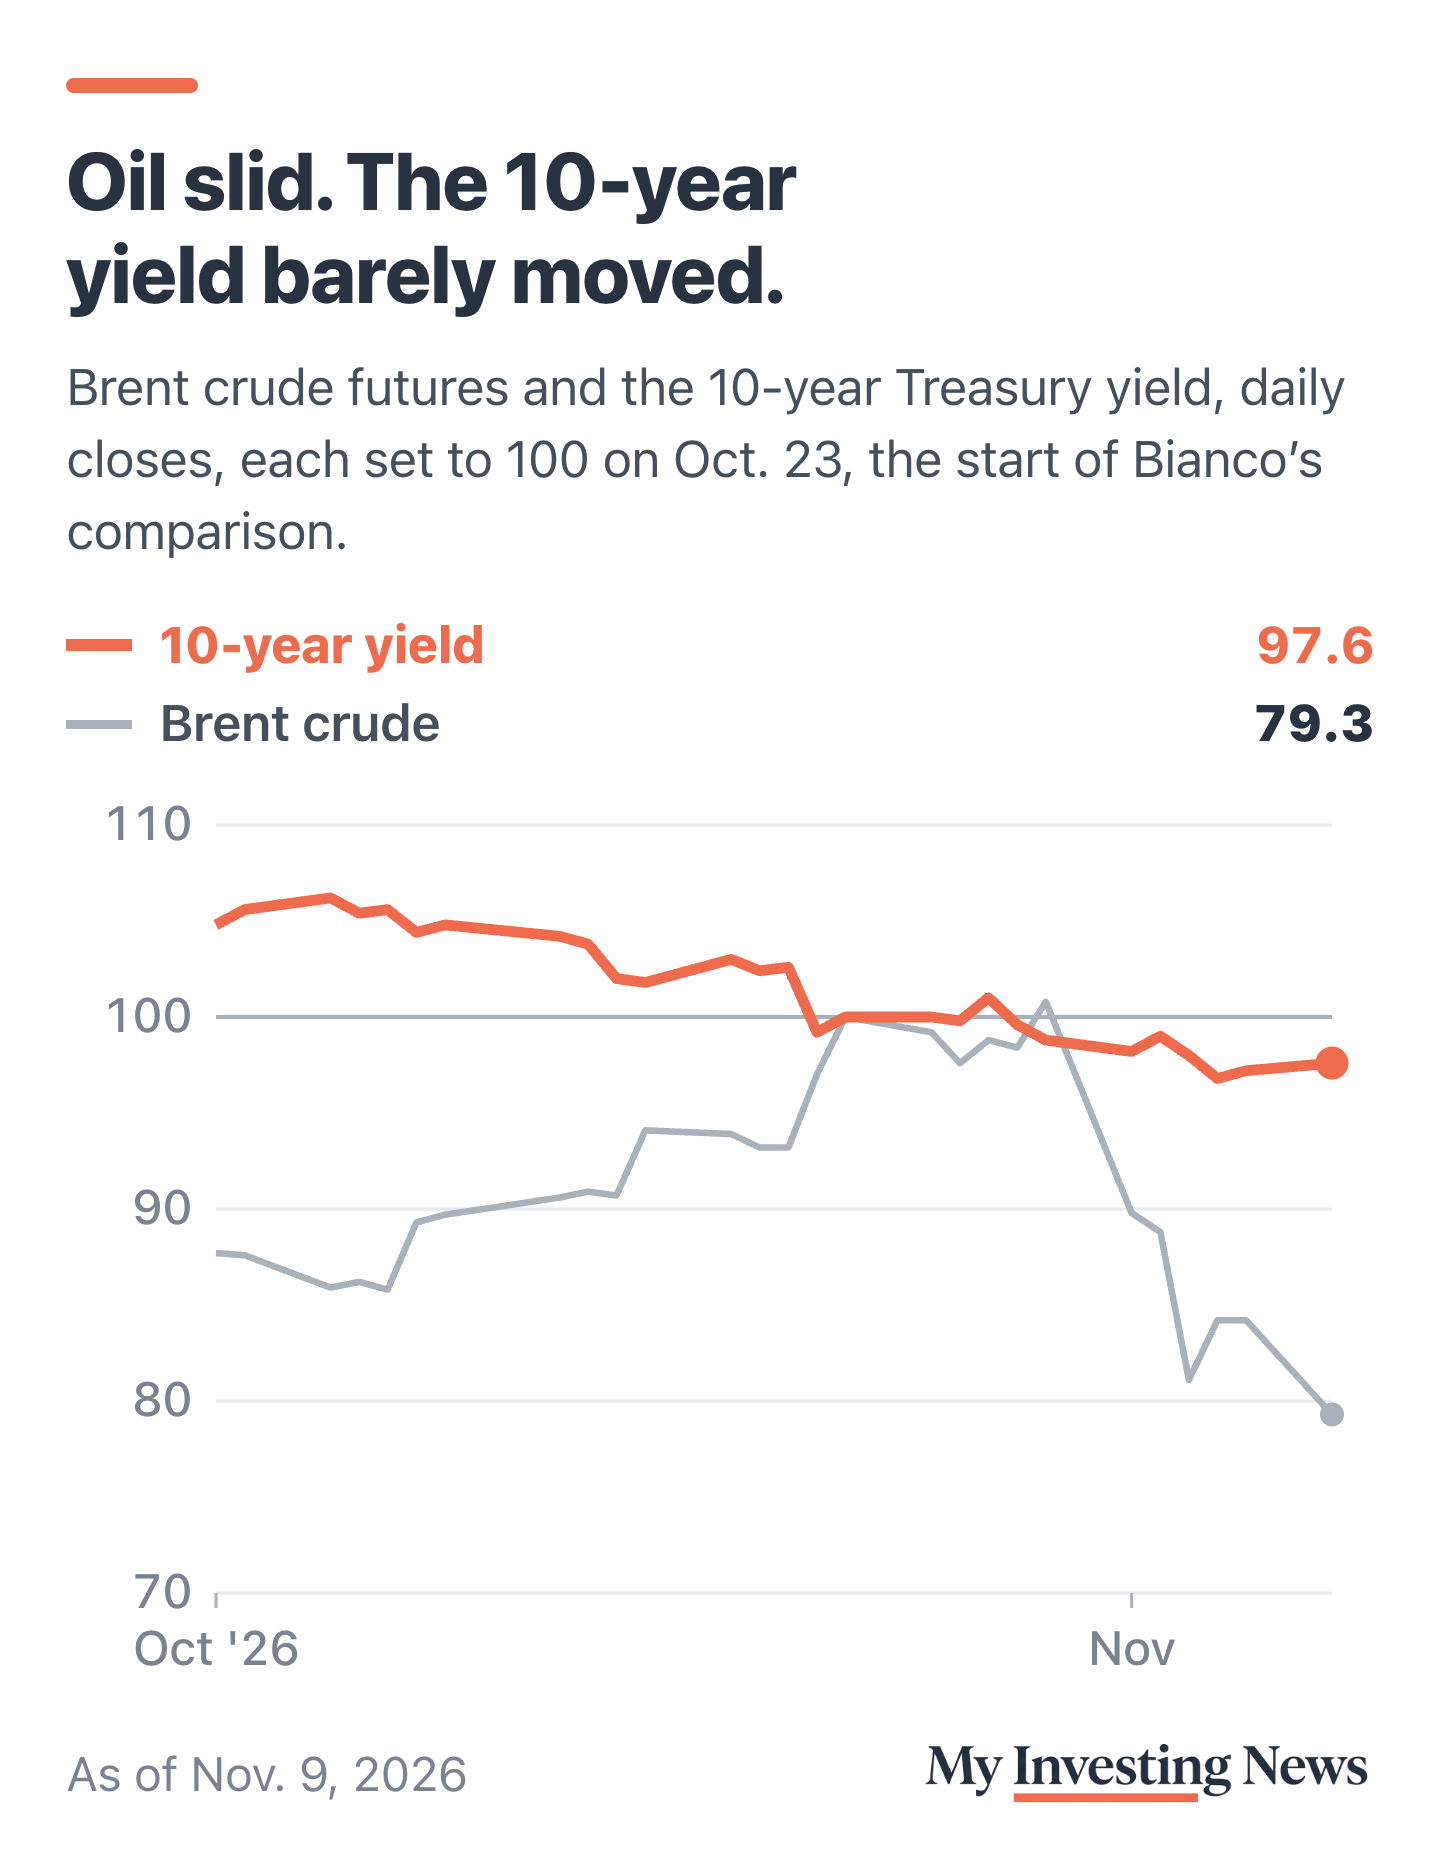
Oil has had a rough two weeks, and Jim Bianco says the bond market barely noticed. “In the last 2+ weeks, Brent Crude Oil (blue) has declined 22%, from $116.72 on October 23rd to $90.56 today,” the president of Bianco Research wrote on X on Nov. 10. “But the 10-year yield (black) has declined by only 10 basis points (from 4.99% on Oct 23 to 4.89% today).” His conclusion fit in one line.
That runs against a view we covered on Nov. 5. Morgan Stanley’s Matthew Hornbach said energy prices and the Fed drove the Treasury selloff that started in March, calling that combination, and the Fed’s shift in response to higher energy prices, “the biggest explanatory factor.” The numbers suggest both men are describing something real. They are looking at different stretches of the same year.
Checking Bianco’s Numbers
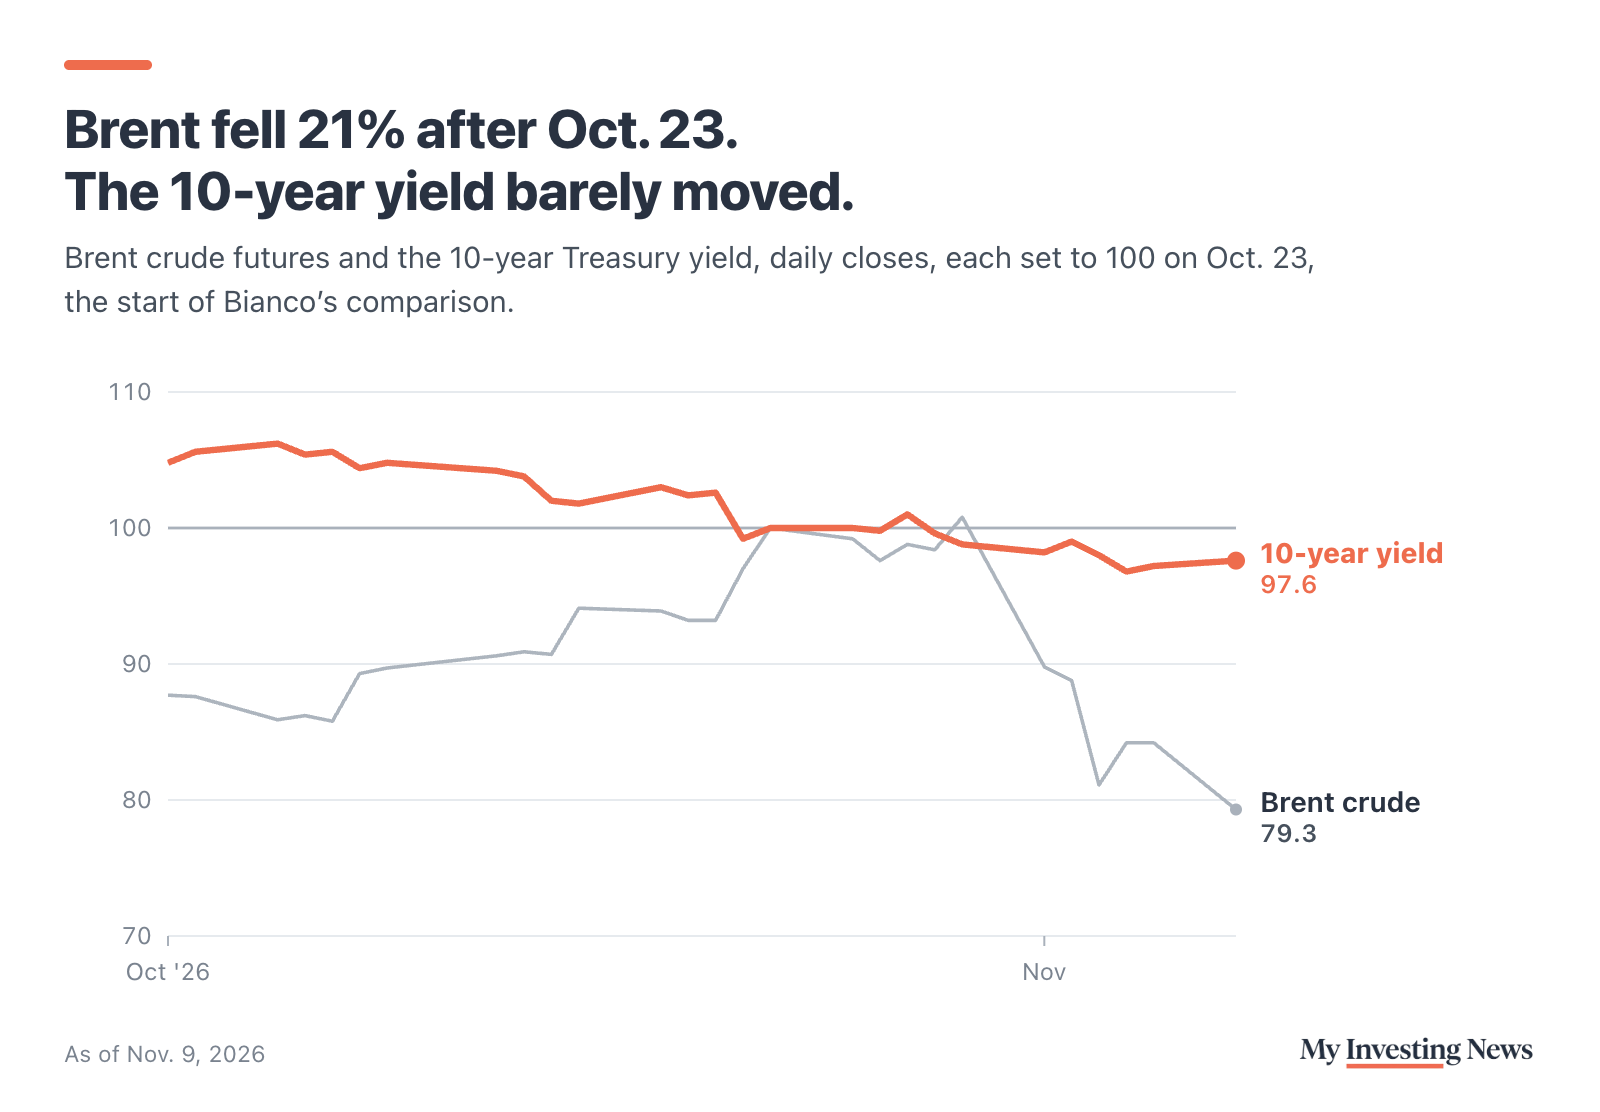
His figures hold up with closing prices. Brent futures settled at $116.72 a barrel on Oct. 23 and $92.57 on Nov. 9, a drop of 20.7%. His 22% used the price on the morning of Nov. 10. The 10-year Treasury yield went from 5.00% to 4.88% over the same closes, down 12 basis points, or hundredths of a percentage point.
The start date matters a little. Oct. 23 was not oil’s top: Brent closed higher, at $117.64, on Oct. 30, and from there it fell 21.3% while the 10-year slipped just 6 basis points. Earlier in October the two went opposite ways. From Oct. 1 to Oct. 23, Brent rose 14.1% while the 10-year fell 24 basis points from 5.24%.
Where the 12 Basis Points Came From
The 10-year yield has two parts. One is the real yield on inflation-protected Treasuries. The other is breakeven inflation, the gap between the two kinds of bonds and the market’s rough estimate of inflation over the next decade. From Oct. 23 to Nov. 9, breakeven inflation fell from 2.34% to 2.22%, which accounts for all 12 basis points of the drop. The real yield started and ended at 2.66%.
So cheaper oil did reach the bond market, through the channel you would expect: investors lowered their inflation estimates. The rest of the yield, the part set by the Fed’s path and by what investors demand to lend for a decade, did not move. That lines up with what the record showed for Hornbach’s period, too. Of the 10-year’s 102 basis point rise from Feb. 27 to Oct. 27, real yields did 92 and breakevens 10.
Since Oct. 23, as of the Nov. 9 close
A Tight Link That Snapped in October
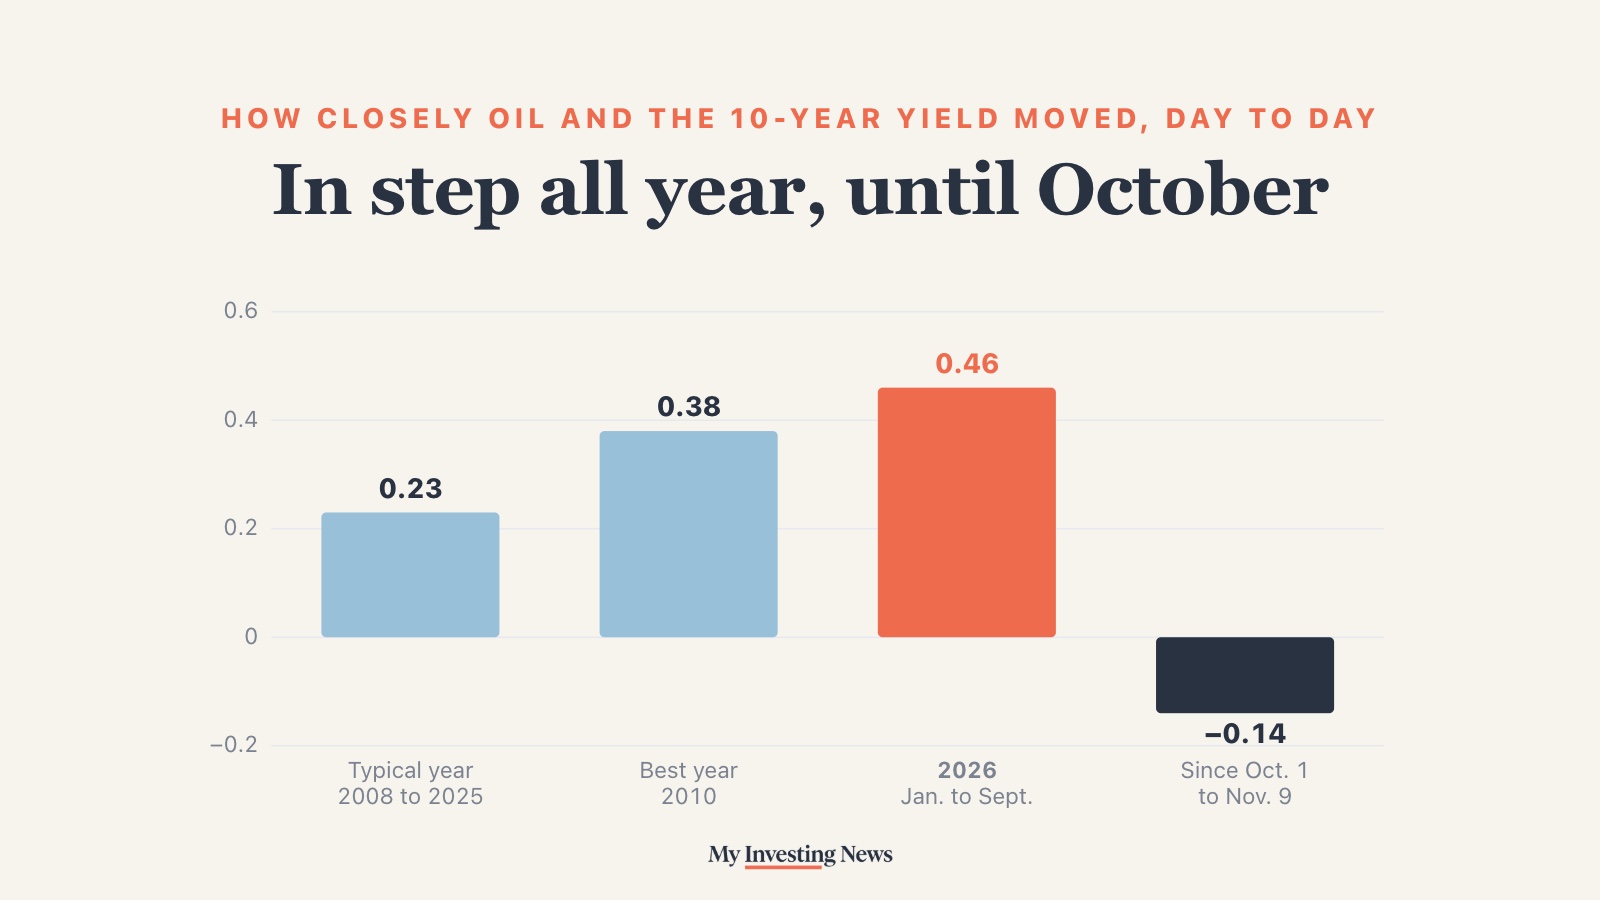
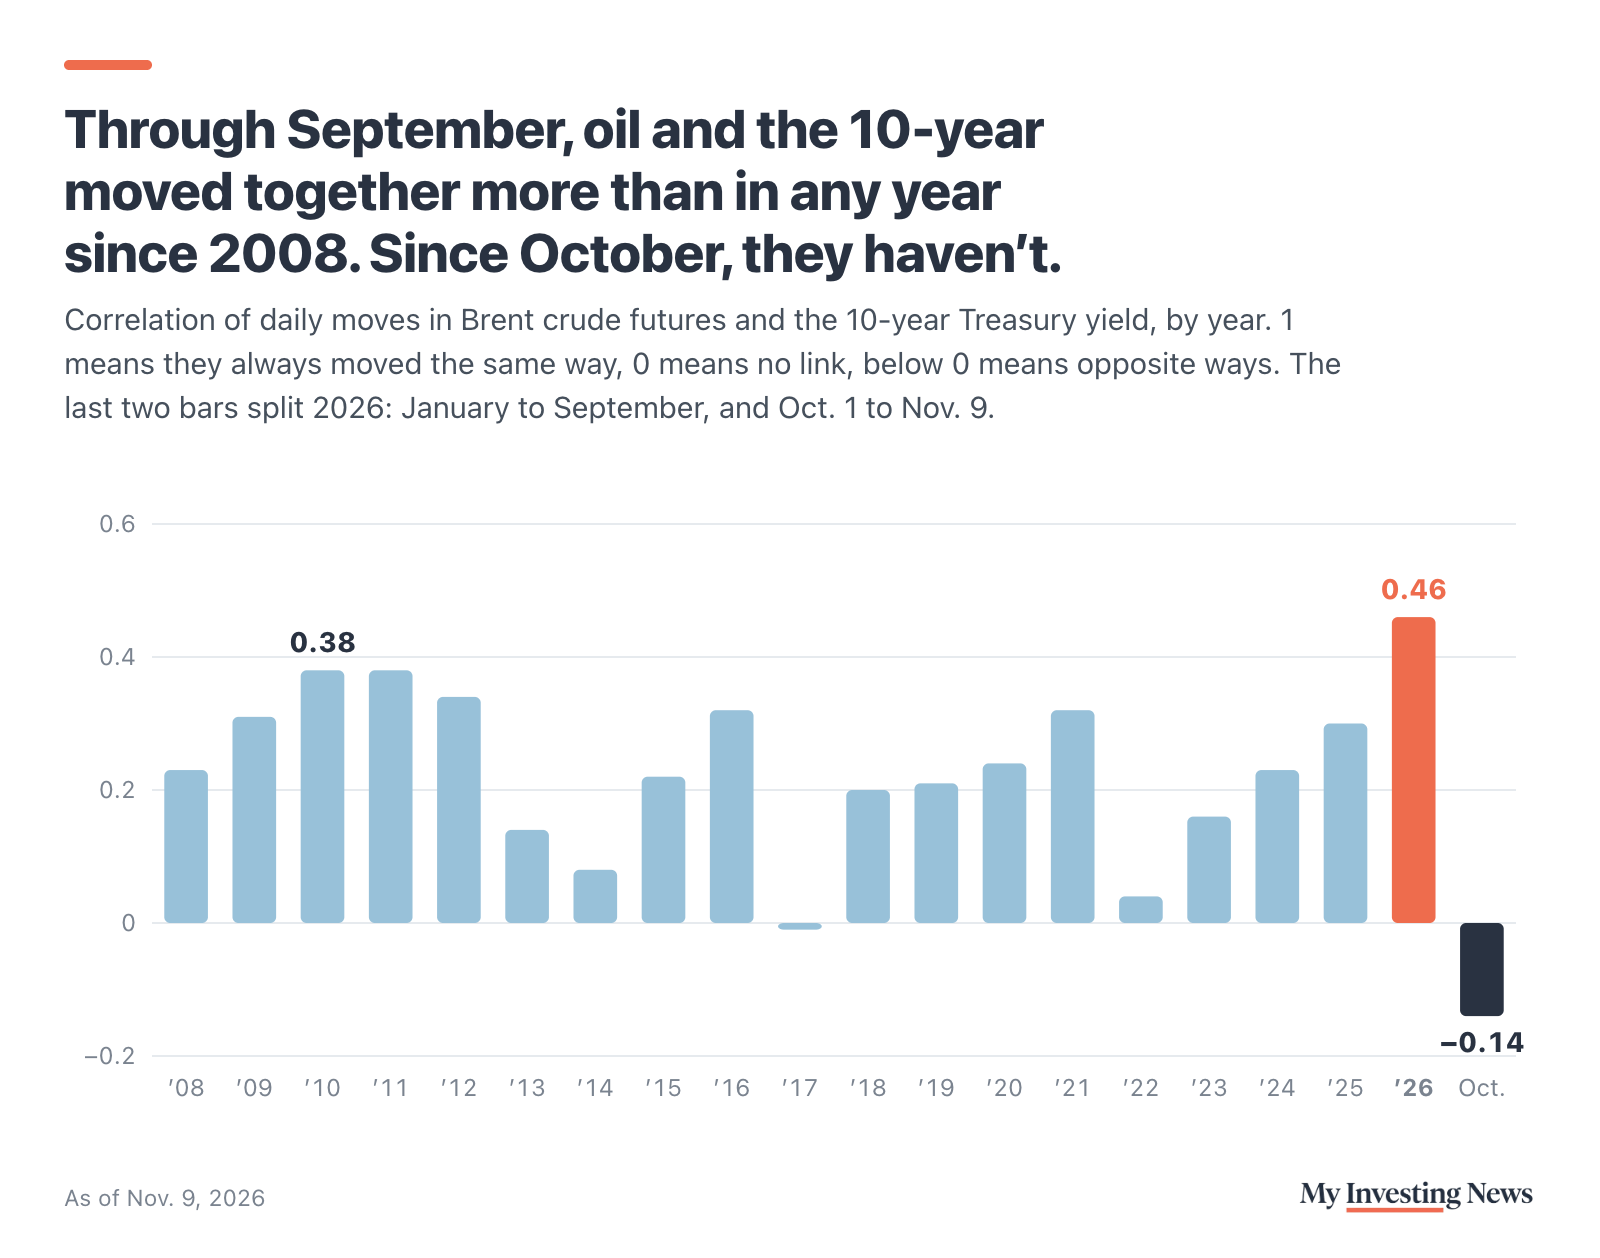
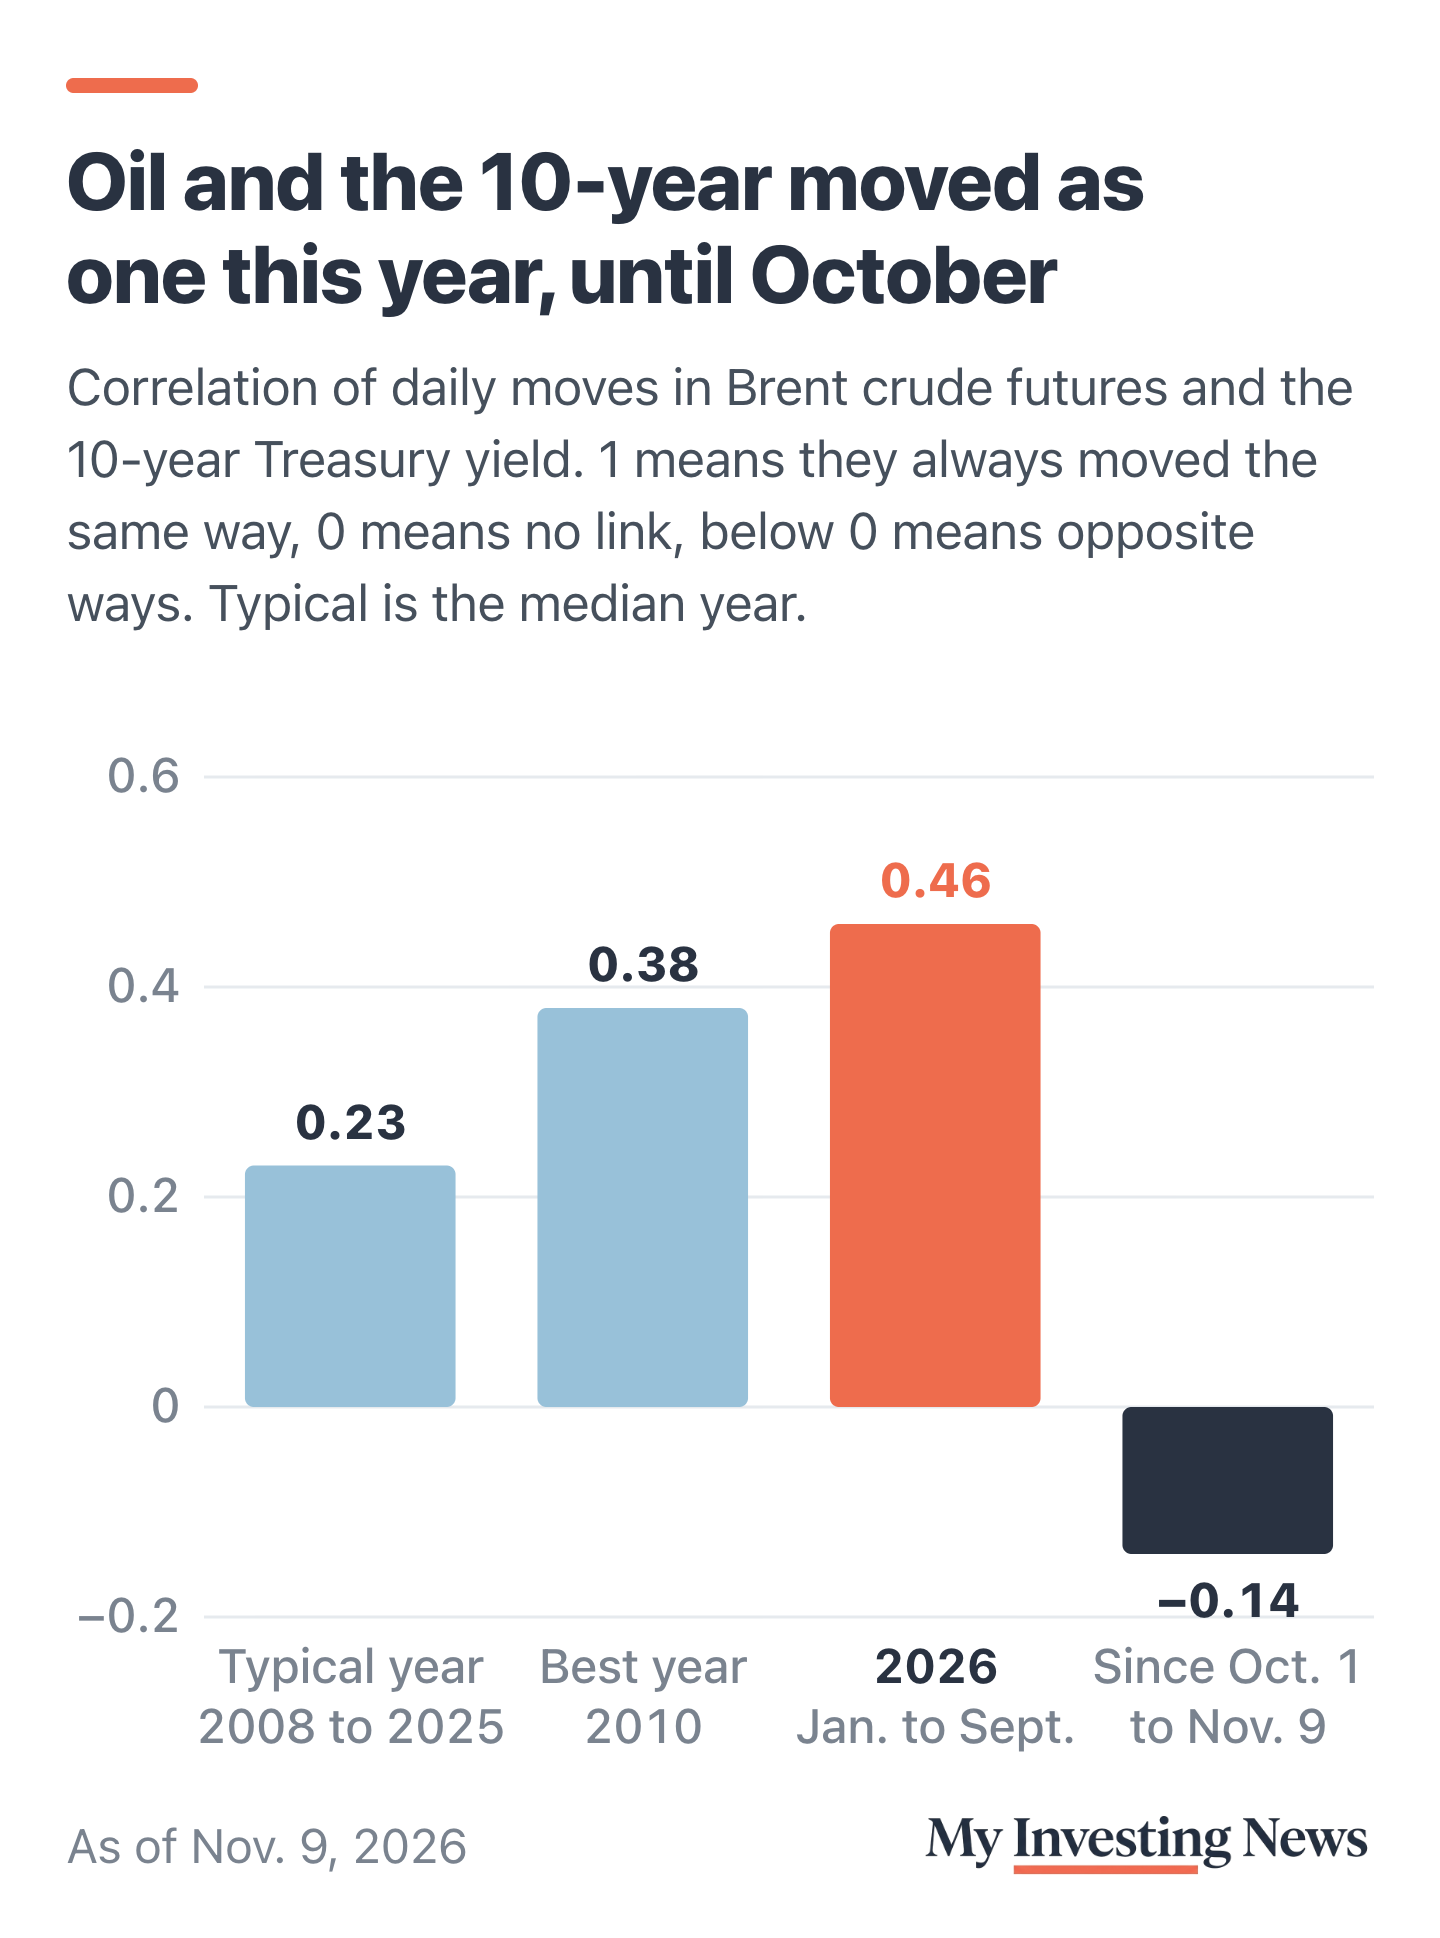
Over the whole year, oil and yields have moved together more than usual. We measured how closely daily changes in Brent futures tracked daily changes in the 10-year yield for every year since 2008, on a scale where 1 means they always moved the same way and 0 means no link. The typical year scored 0.23. From January through September of 2026, the score was 0.46, higher than any full year in the record; the previous high was 0.38 in 2010. The spot price of Brent, which goes back further, tells the same story: 0.49 for the first nine months of 2026, against a high of 0.37 in 2016 in records since 2000.
Since Oct. 1 the score has been −0.14, meaning oil and yields have leaned slightly toward opposite moves. That fits both men. While oil and yields climbed together through the spring and summer, Hornbach’s reading matched the data. Since October, Bianco’s does.
What Is Holding Yields Up
If not oil, then what? The real yield is the place to look, and it is high. At 2.66% on Nov. 9, it was above 98.6% of trading days since the Treasury series began in 2003. Apart from this fall, it was last that high in November 2008. It peaked this year at 2.95% on Oct. 5, also the highest since November 2008.
Part of that is the extra pay investors want for tying up money for 10 years. The New York Fed’s estimate of that term premium was 0.91 percentage point on Oct. 30, up from 0.46 on Feb. 27. It reached 1.10 on Oct. 5, the highest since April 2010. The Fed is the other part. It raised its target range a quarter point in September, to 3.75% to 4%, and held it there on Oct. 28. The 2-year yield, which tracks expectations for the Fed most closely, fell 13 basis points to 4.56% from Oct. 23 to Nov. 9.
For bond buyers, a high real yield cuts both ways. It makes borrowing costly: mortgage rates followed the 10-year to a 52-week high in early October. It also means new buyers lock in more. UBS’s Evan Brown has argued that a 10-year near 5% pays investors to own bonds, with a cushion against further rate rises.
What to Watch
The October consumer price index, out Nov. 10, showed core prices up 0.3% for a third straight month. The next big inflation reading is the Fed’s preferred gauge, the October price index for personal consumption expenditures, due Nov. 25. The Fed meets Dec. 8 and 9. If oil keeps sliding and breakevens fall with it while the real yield holds, Bianco’s case gets stronger. If oil turns back up and drags yields with it, the link from earlier this year is back.
Bianco says the bond market is no longer trading on crude, and since October the record backs him. Brent fell 20.7% from Oct. 23 to Nov. 9 while the 10-year fell 12 basis points, all of it from lower inflation expectations. The risk to that view is how recent it is: through September, oil and yields moved together more closely than in any year since at least 2008.