Where we heard itPost on X, Nov. 10, 2026, by Eric Balchunas, global head of ETF research at Bloomberg. Also: CNBC’s “Fast Money,” Nov. 6, 2026, with Liz Ann Sonders, chief investment strategist at the Schwab Center for Financial Research.
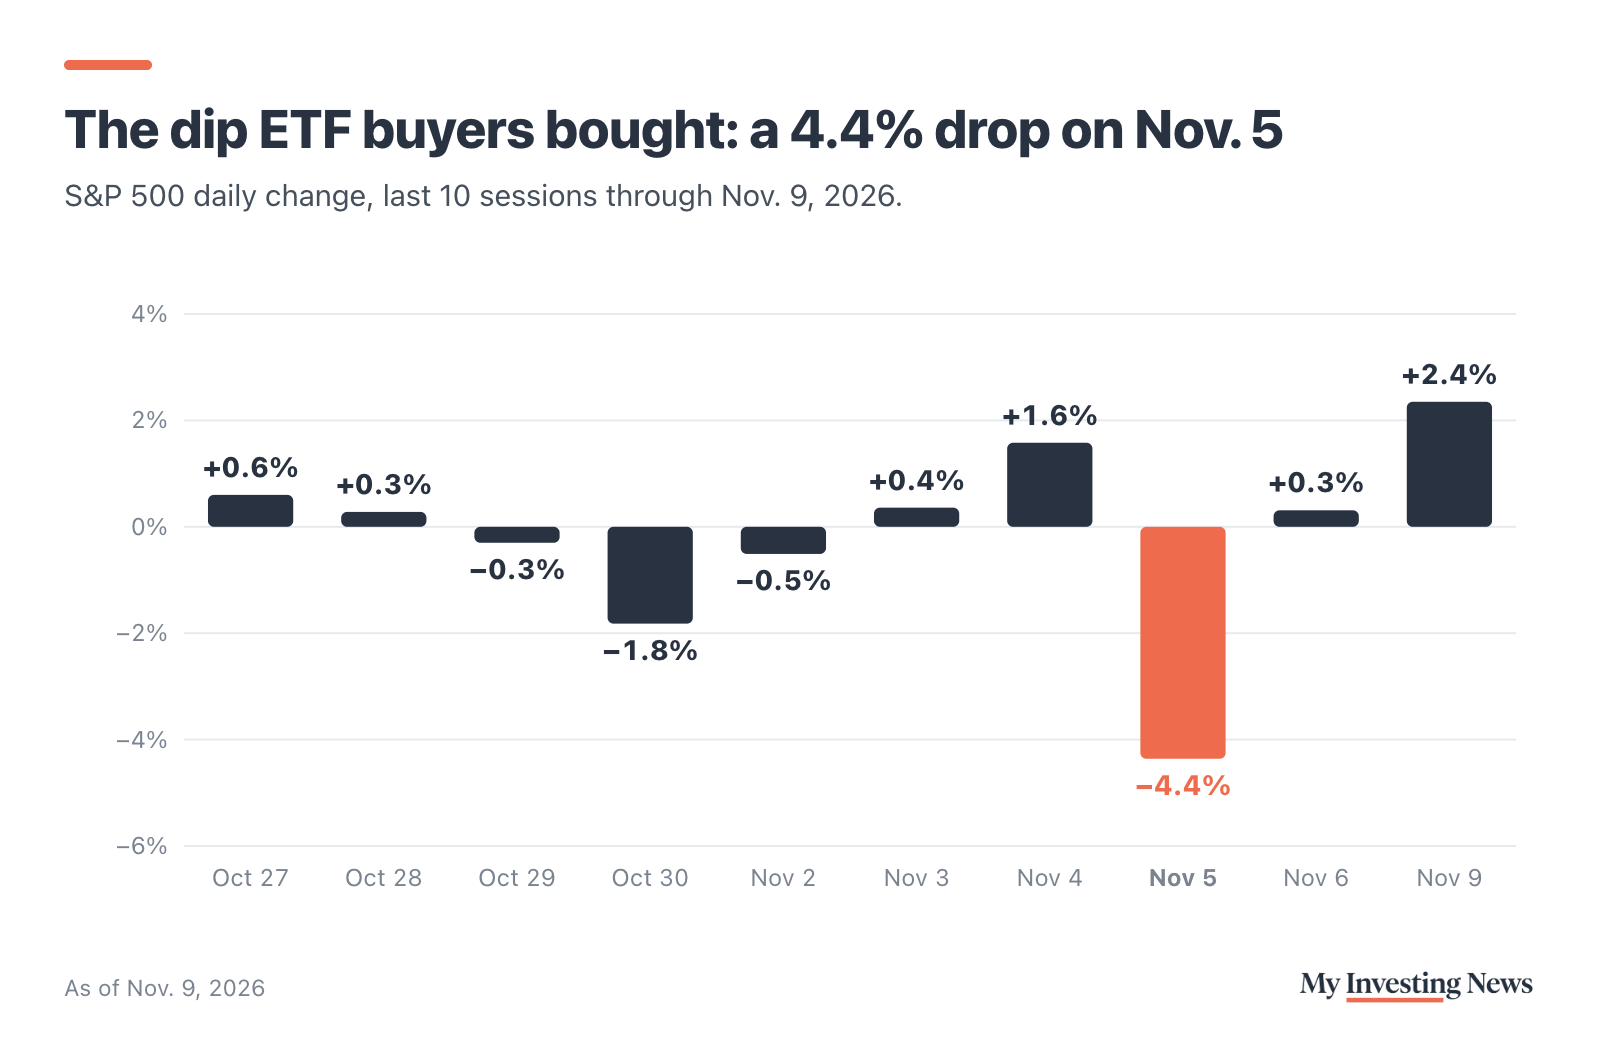
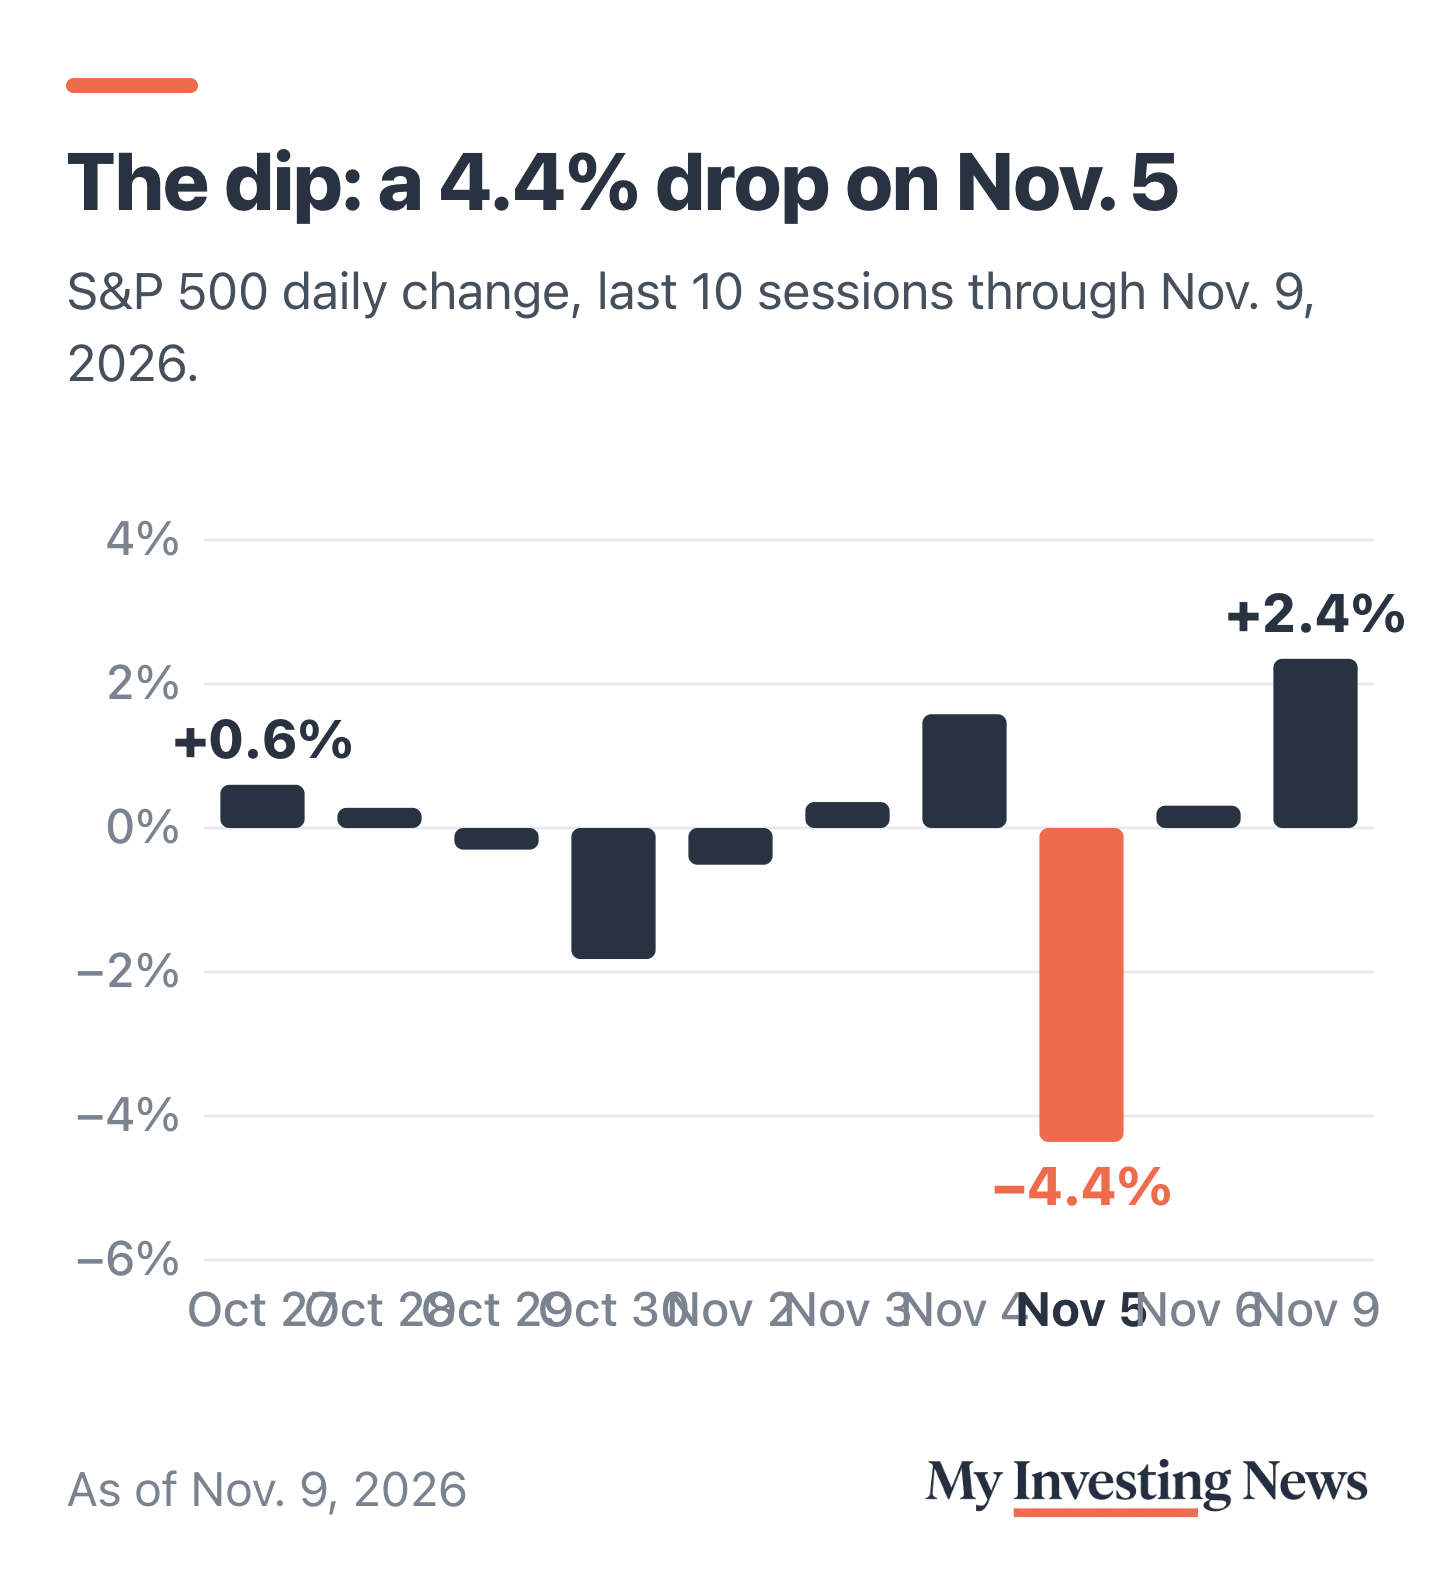
The S&P 500 fell 4.4% on Nov. 5, its first drop of 4% or more in a day since April 2025. Eric Balchunas says exchange-traded fund investors treated it as a sale. “ETF investors didn’t just buy the dip, they DEVOURED it,” Bloomberg’s global head of ETF research posted on X on Nov. 10.
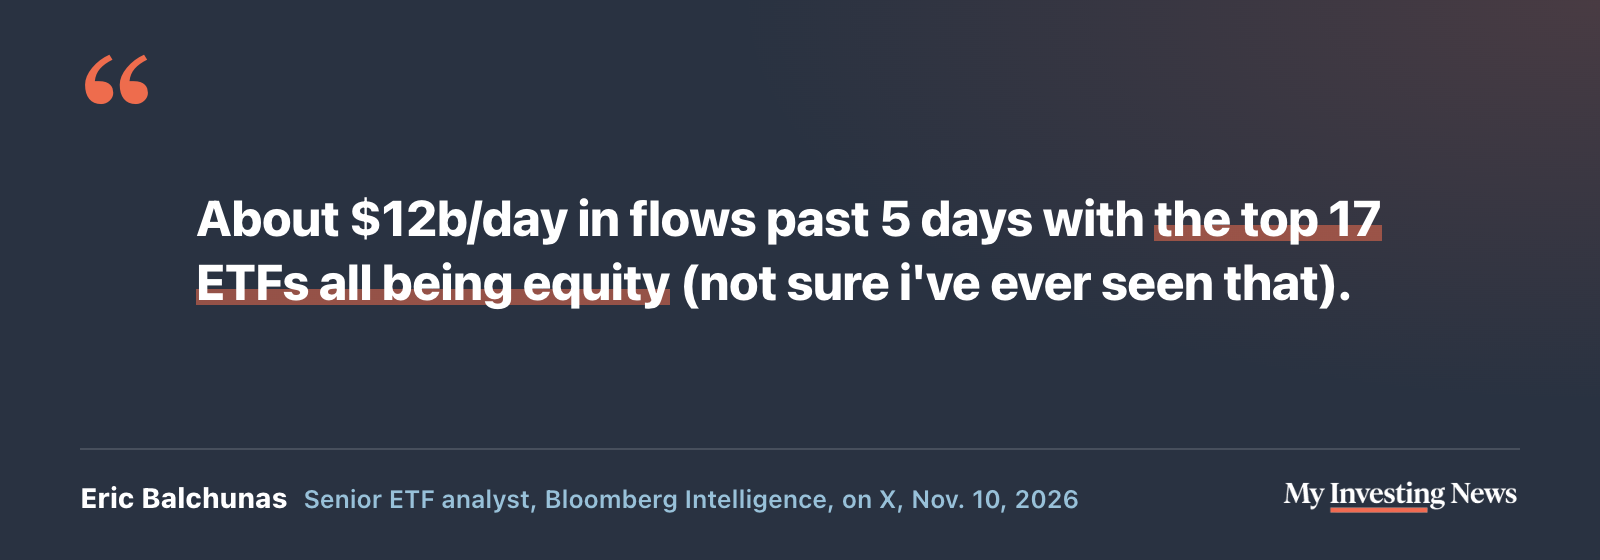
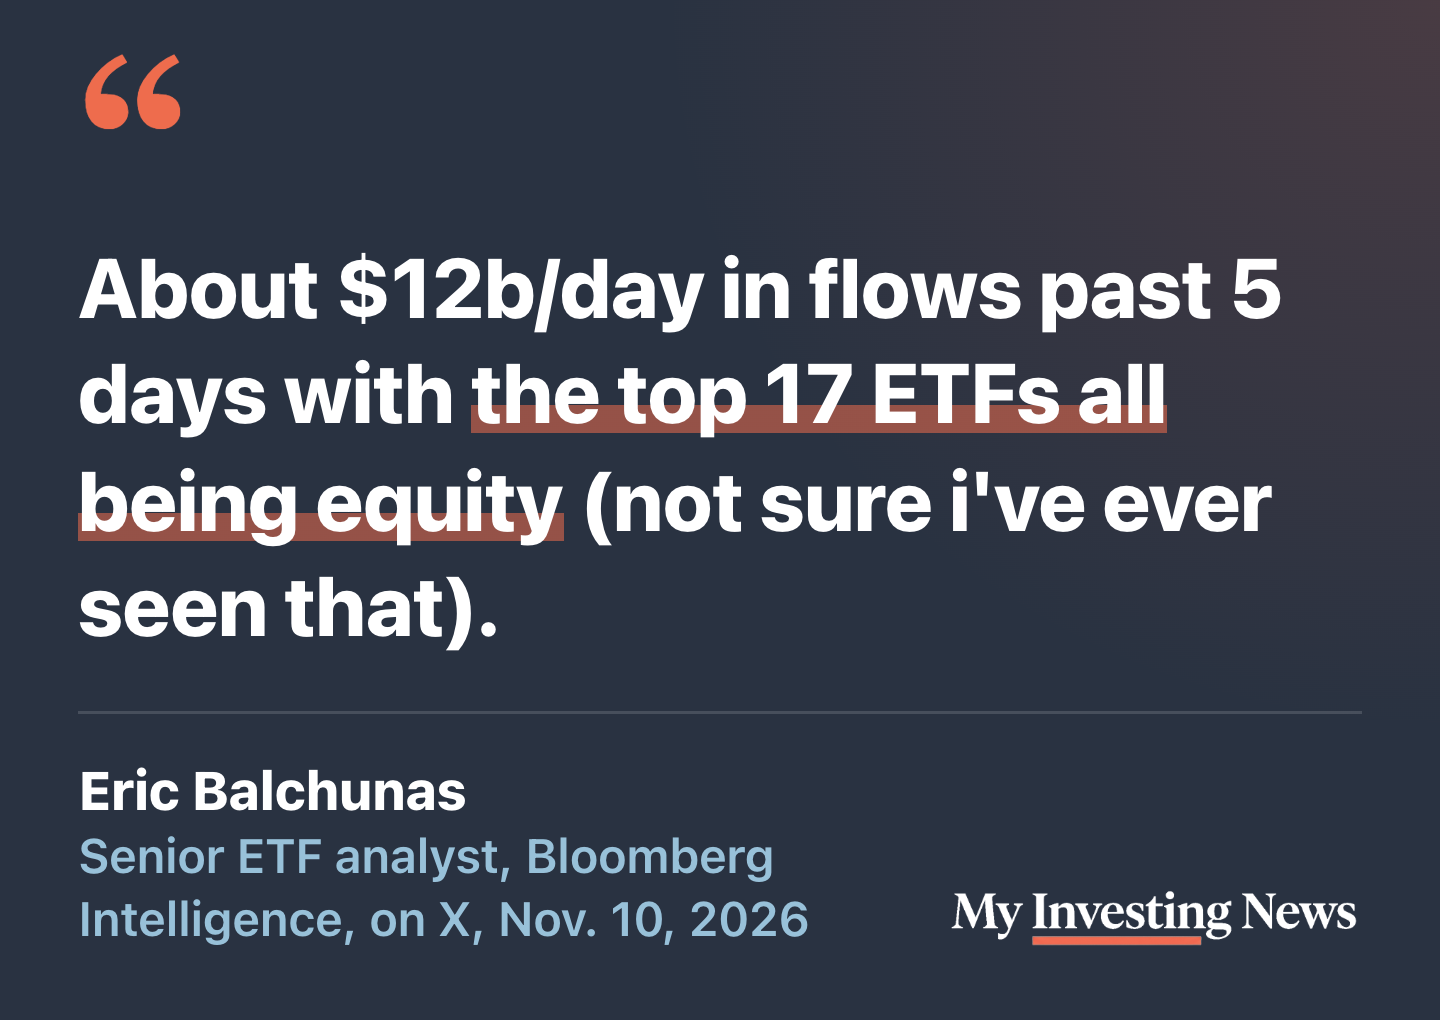
The Bloomberg table he posted backs up the rate: U.S. ETFs took in $58.0 billion over the week, about $11.6 billion a trading day, and $15.9 billion of it went into one fund, Vanguard’s S&P 500 ETF VOO. Leveraged funds were on the list too, which is his point about “Vanguardians and degens”: very different investors, he wrote, who “def agree on one thing: you buy the dip.”
The Dip They Bought
The drop came two days after the Nov. 3 midterms, after a 1.6% gain on Nov. 4. The index closed at 7,353.73 on Nov. 5, and by Nov. 9 it was 2.7% above that close. That is a big week by any recent measure. The Investment Company Institute’s weekly estimates, a different data set, put total U.S. ETF inflows between $46 billion and $54 billion in each of the five weeks through Oct. 28.
Not everyone saw a buying frenzy. On CNBC’s Fast Money on Nov. 6, Schwab’s Liz Ann Sonders said individual traders had pulled back. “Retail has not proven to be the dip buyers that they have been in the past. You saw a really heavy amount of net selling,” she said. “So we may not fully be washed out yet.” The two reads can both hold: ETF flows count every buyer, including advisers and institutions, while Sonders was talking about retail traders.
What Buying a 4% Drop Has Paid
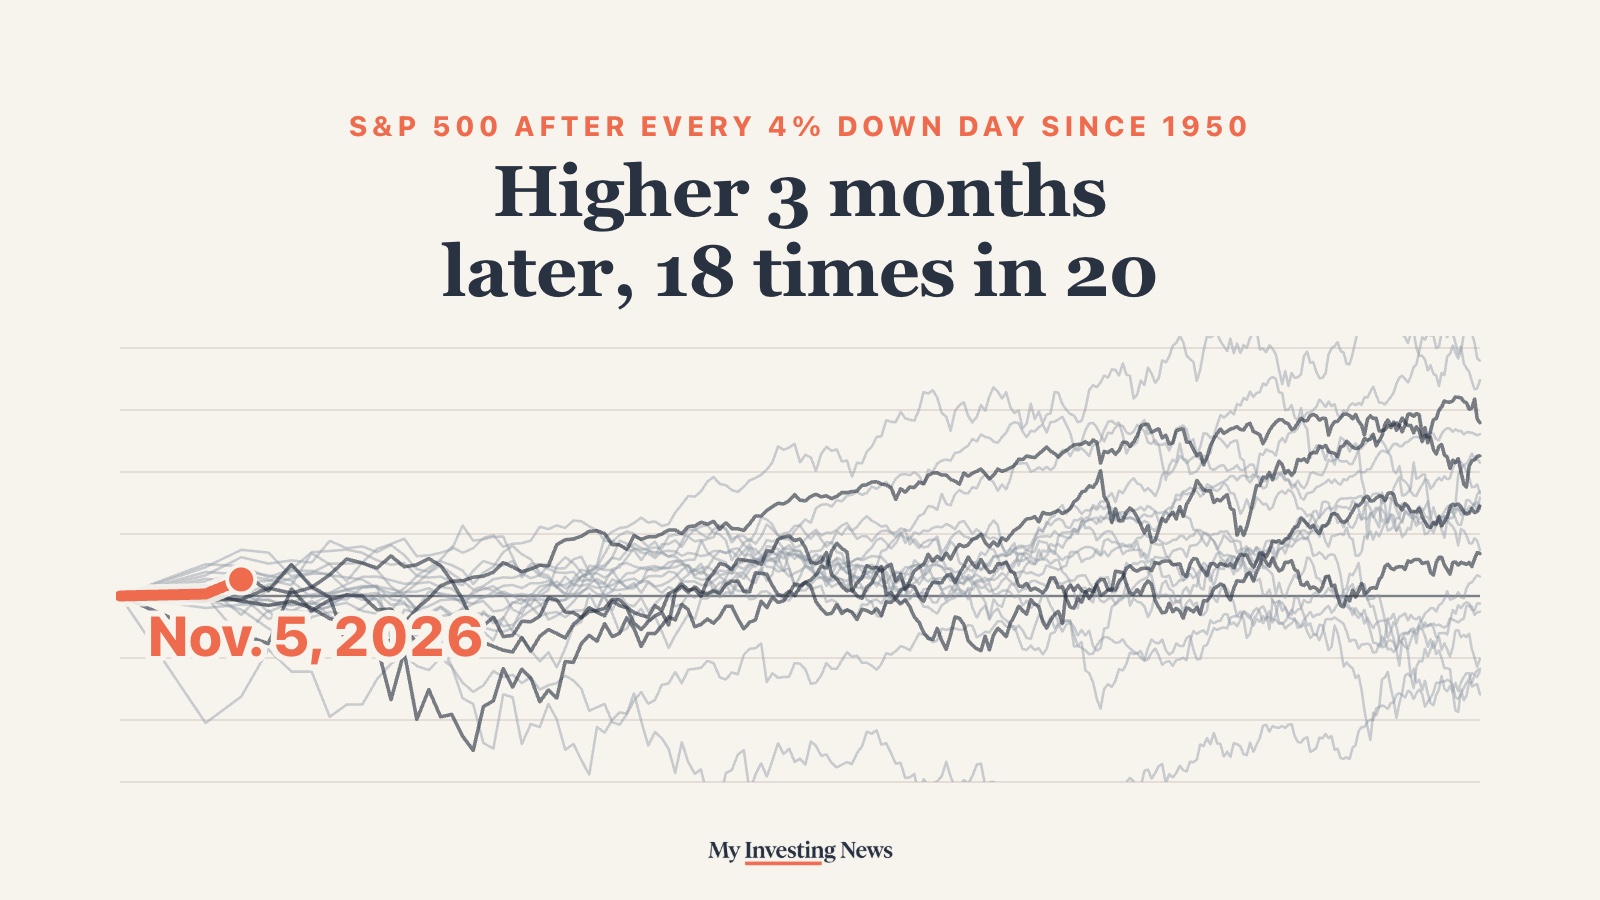
History favors the buyers, though rarely right away. Since 1950, the S&P 500 has fallen 4% or more in a day 57 times. Many came in clusters, so we counted a drop only if no other 4% drop came in the three months before it. That leaves 20 earlier episodes, from June 1950 to April 2025.
Three months after the drop-day close, the index was higher 18 times out of 20. The two exceptions were Oct. 16, 1987, the Friday before Black Monday, and Sept. 15, 2008, the day Lehman Brothers filed for bankruptcy. A year later it was higher 14 times, with a median gain of 14.3%, before dividends.
After 20 earlier 4% drops, the S&P 500 was higher three months later 18 times
The S&P 500 after every one-day drop of 4% or more since 1950, measured from that day’s close, for one year. A drop counts once if no other 4% drop came in the three months before it. Price only. The four since 2020 are dark; Nov. 5 is coral.
The first month was the hard part. One month after the drop, the index was higher only 8 times in 20, and the median change was -1.1%. Buyers in 2020 sat through another slide of nearly 25% before the rebound, and 2008’s buyers were down 43% at the worst point within a year. Lance Roberts warned in October that fearful investors could miss some of the best opportunities they’d ever had. The record says those opportunities usually take a few months to show up.
Buying the S&P 500 after a 4% drop, since 1950
What to Watch
Two things would test the dip buyers. One is whether the selling Sonders described turns into a second leg down: in 1987 and 2008, the 4% day was an early warning, and the worst came days or weeks later. The other is leverage. Balchunas’s “degens” were buying funds such as ProShares UltraPro QQQ TQQQ and Direxion’s semiconductor fund SOXL, which aim to move three times their index each day, and margin debt hit a record $1.5 trillion this fall. ICI’s weekly flow estimates, out each Wednesday, will show whether the buying kept going after the first week.
Balchunas’s numbers show ETF investors piled into the Nov. 5 drop at about $11.6 billion a day, even as Sonders saw retail traders selling. After the 20 earlier 4% drops since 1950, the S&P 500 was higher three months later 18 times, but only 8 times a month later, so the history rewards buyers who can wait out the first few weeks.