Where we heard itOn Investing, “Can Bonds Still Do Their Job?,” Oct. 23, 2026, with Liz Ann Sonders, chief investment strategist at Charles Schwab, and co-host Colin Martin.
Liz Ann Sonders says investors who only watch the big indexes are missing a shift under the surface. On Schwab’s On Investing podcast on Oct. 23, she pointed to factors such as high interest coverage and stable profit margins doing well, and then went down to the smallest stocks:
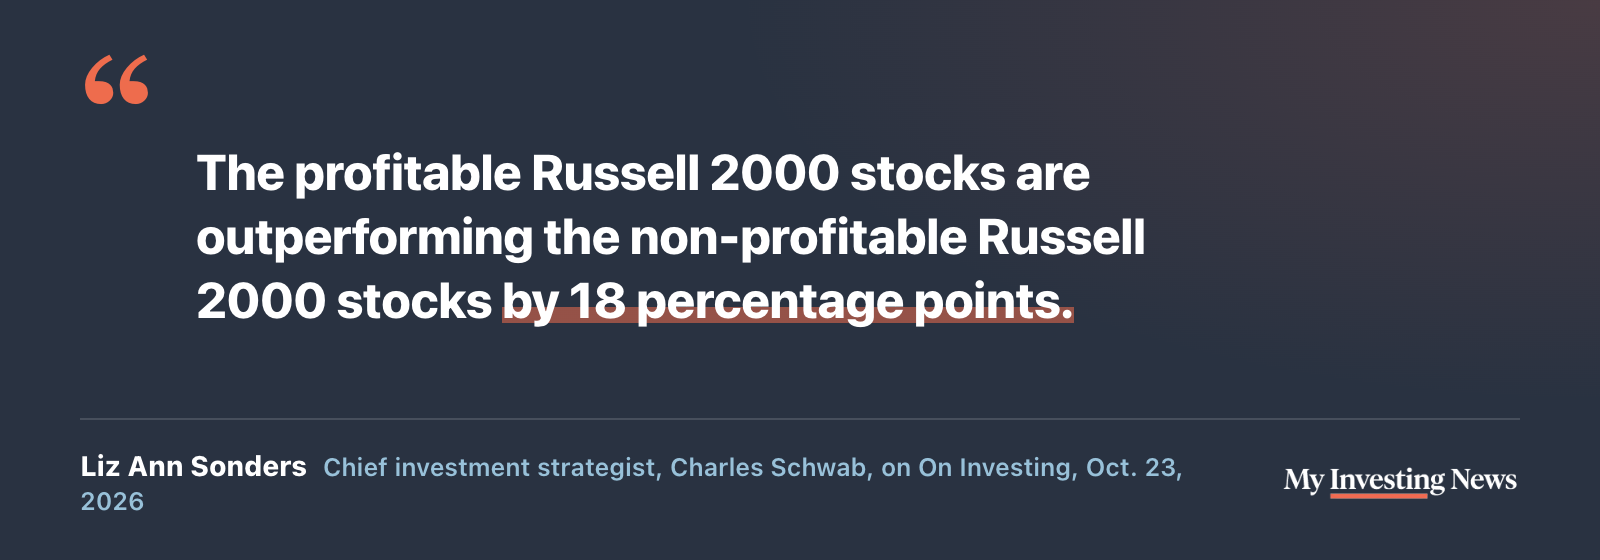
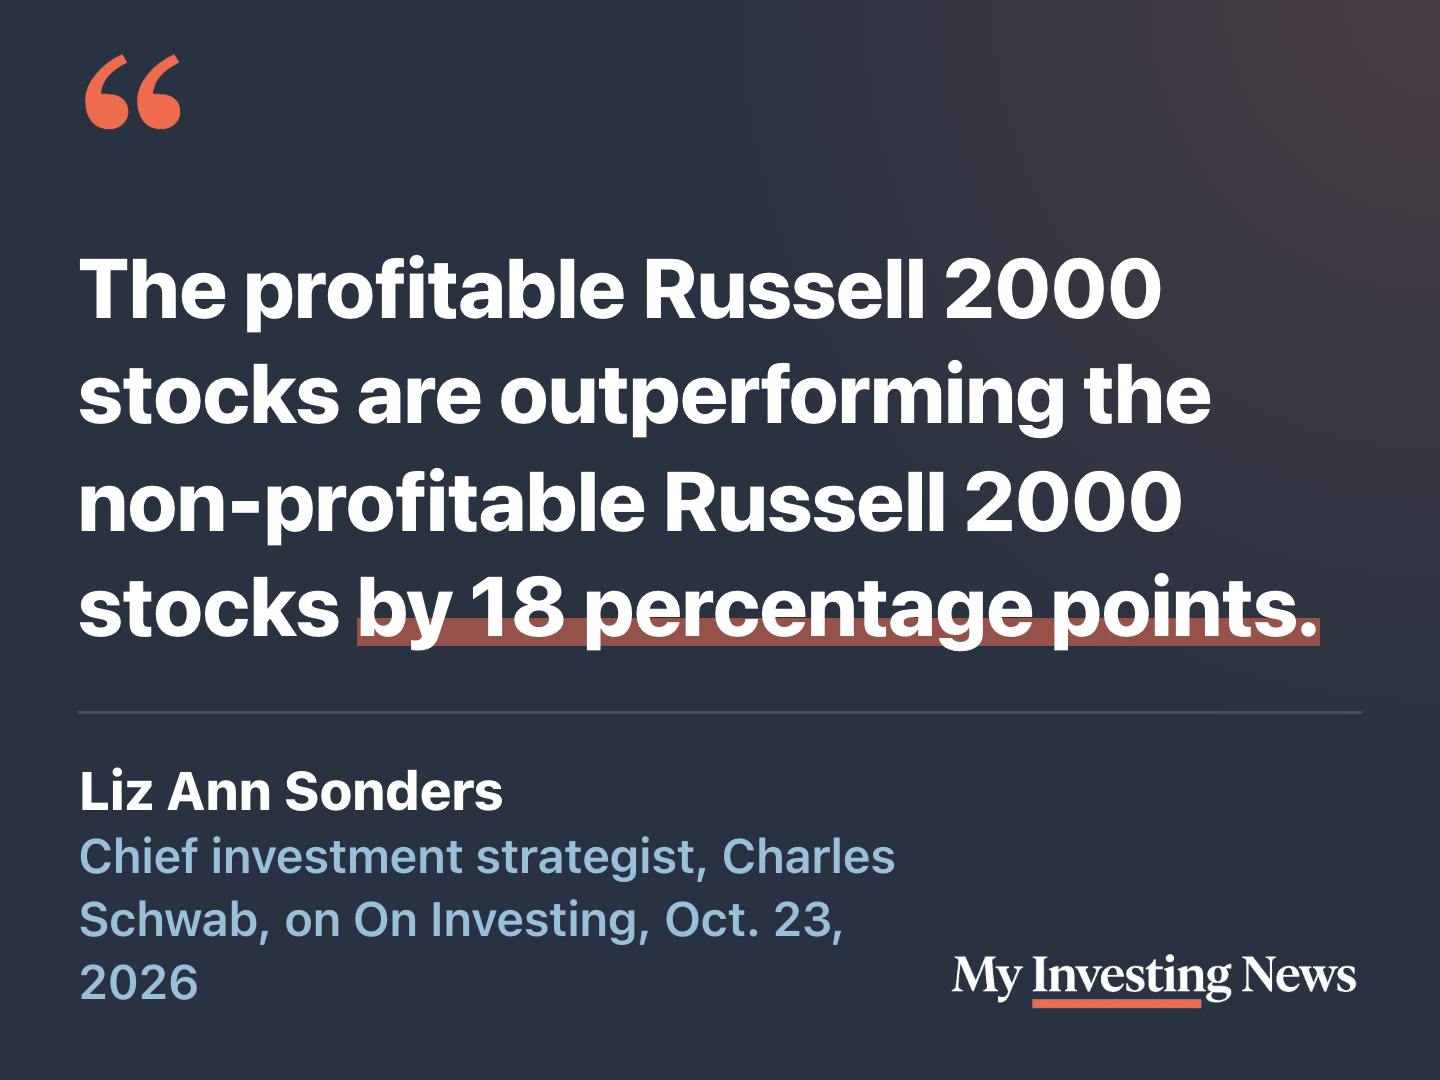
“Last year was the opposite,” she added. “The non-profitable stocks had twice the performance of the profitable stocks.” She tied the change to a “hunt for quality” as investors worry about earnings estimates, profit margins and how AI spending is being paid for. Sonders, who has also flagged weak breadth under the S&P 500, didn’t name the data behind the 18-point figure, so we couldn’t check it directly.
There is a long public record of the same contest, though. The S&P SmallCap 600 admits a company only if its earnings under standard accounting rules are positive for the latest quarter and the latest four quarters combined, according to S&P Dow Jones Indices’ rules. The Russell 2000 takes the 1,001st through 3,000th largest U.S. companies by market value, profitable or not. When the S&P 600 beats the Russell 2000, the profit screen is winning.
Twenty of 31 Years
We compared the two indexes’ price returns for every calendar year from 1995 through 2025. The S&P 600 came out ahead in 20 of the 31 years. Its best year against the Russell 2000 was 2000, when it won by 15.2 percentage points, and its worst was 2020, when it lost by 8.8 points. It won by 11.6 points in 2021, the year after that.
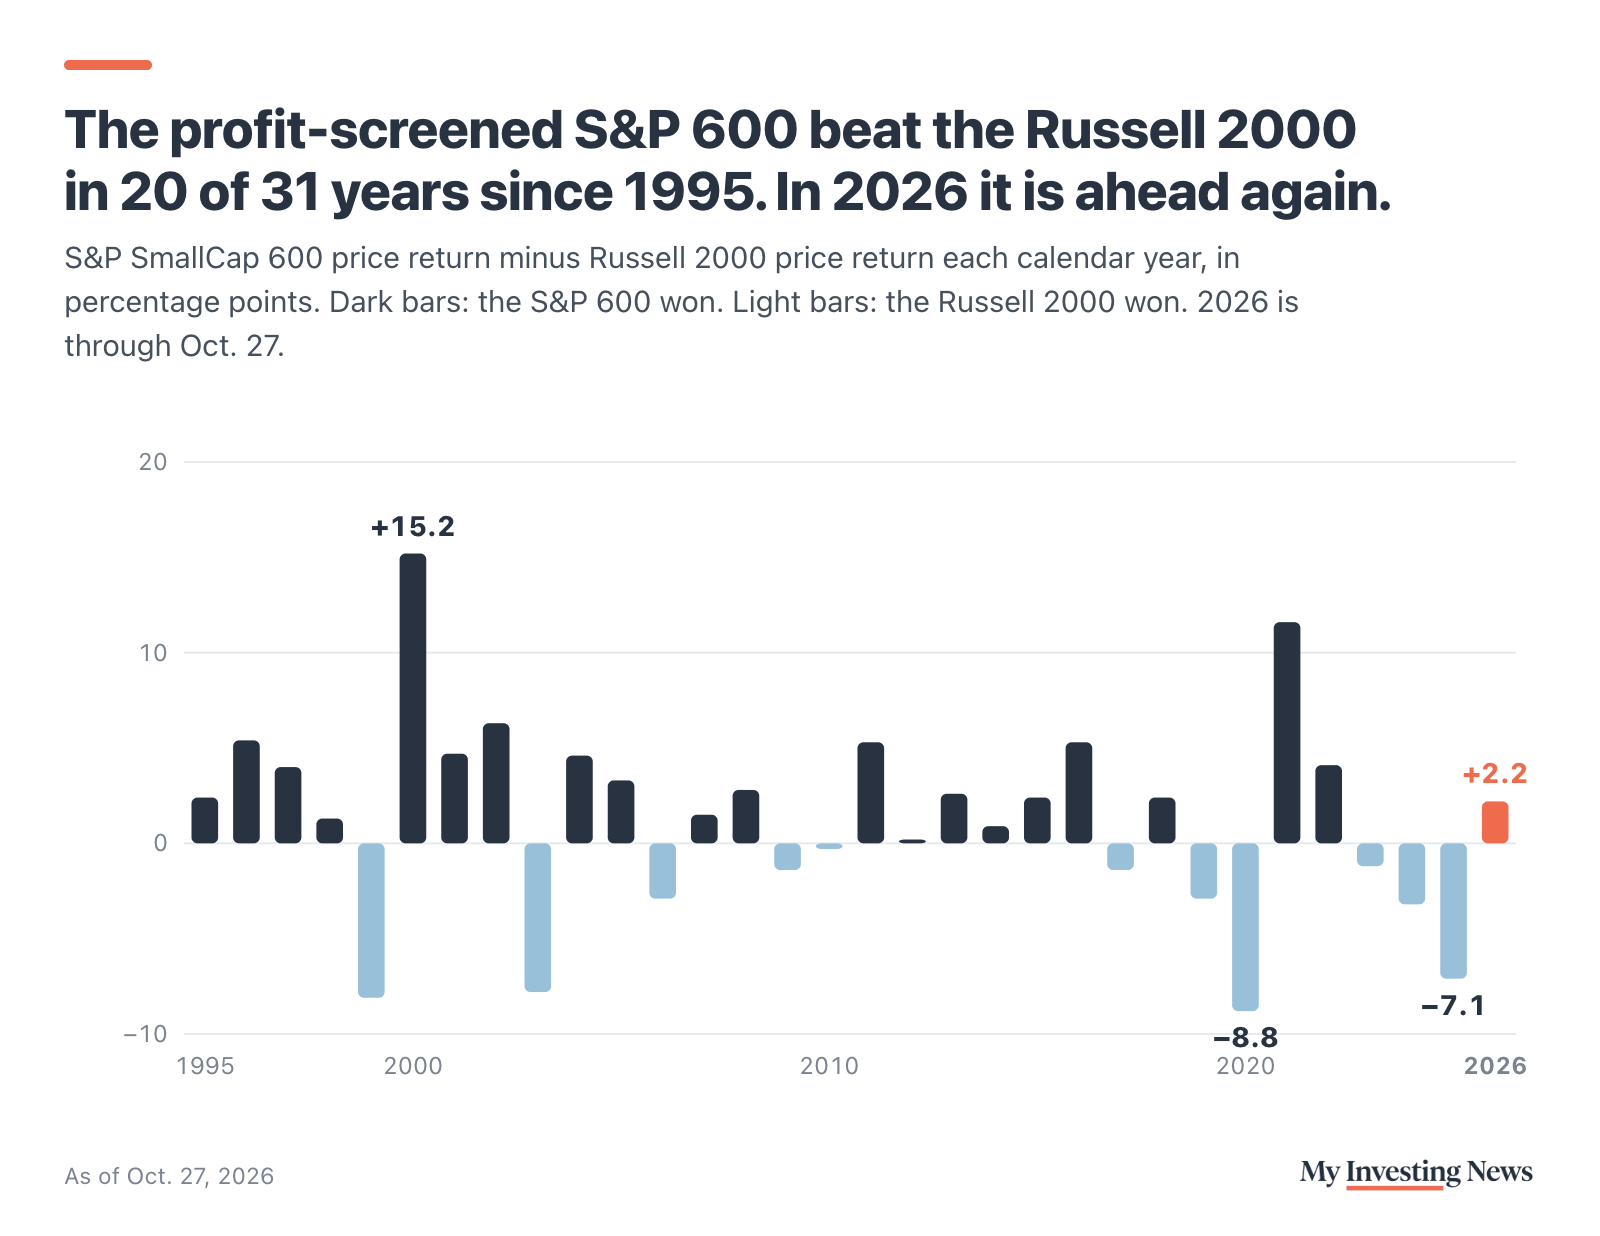
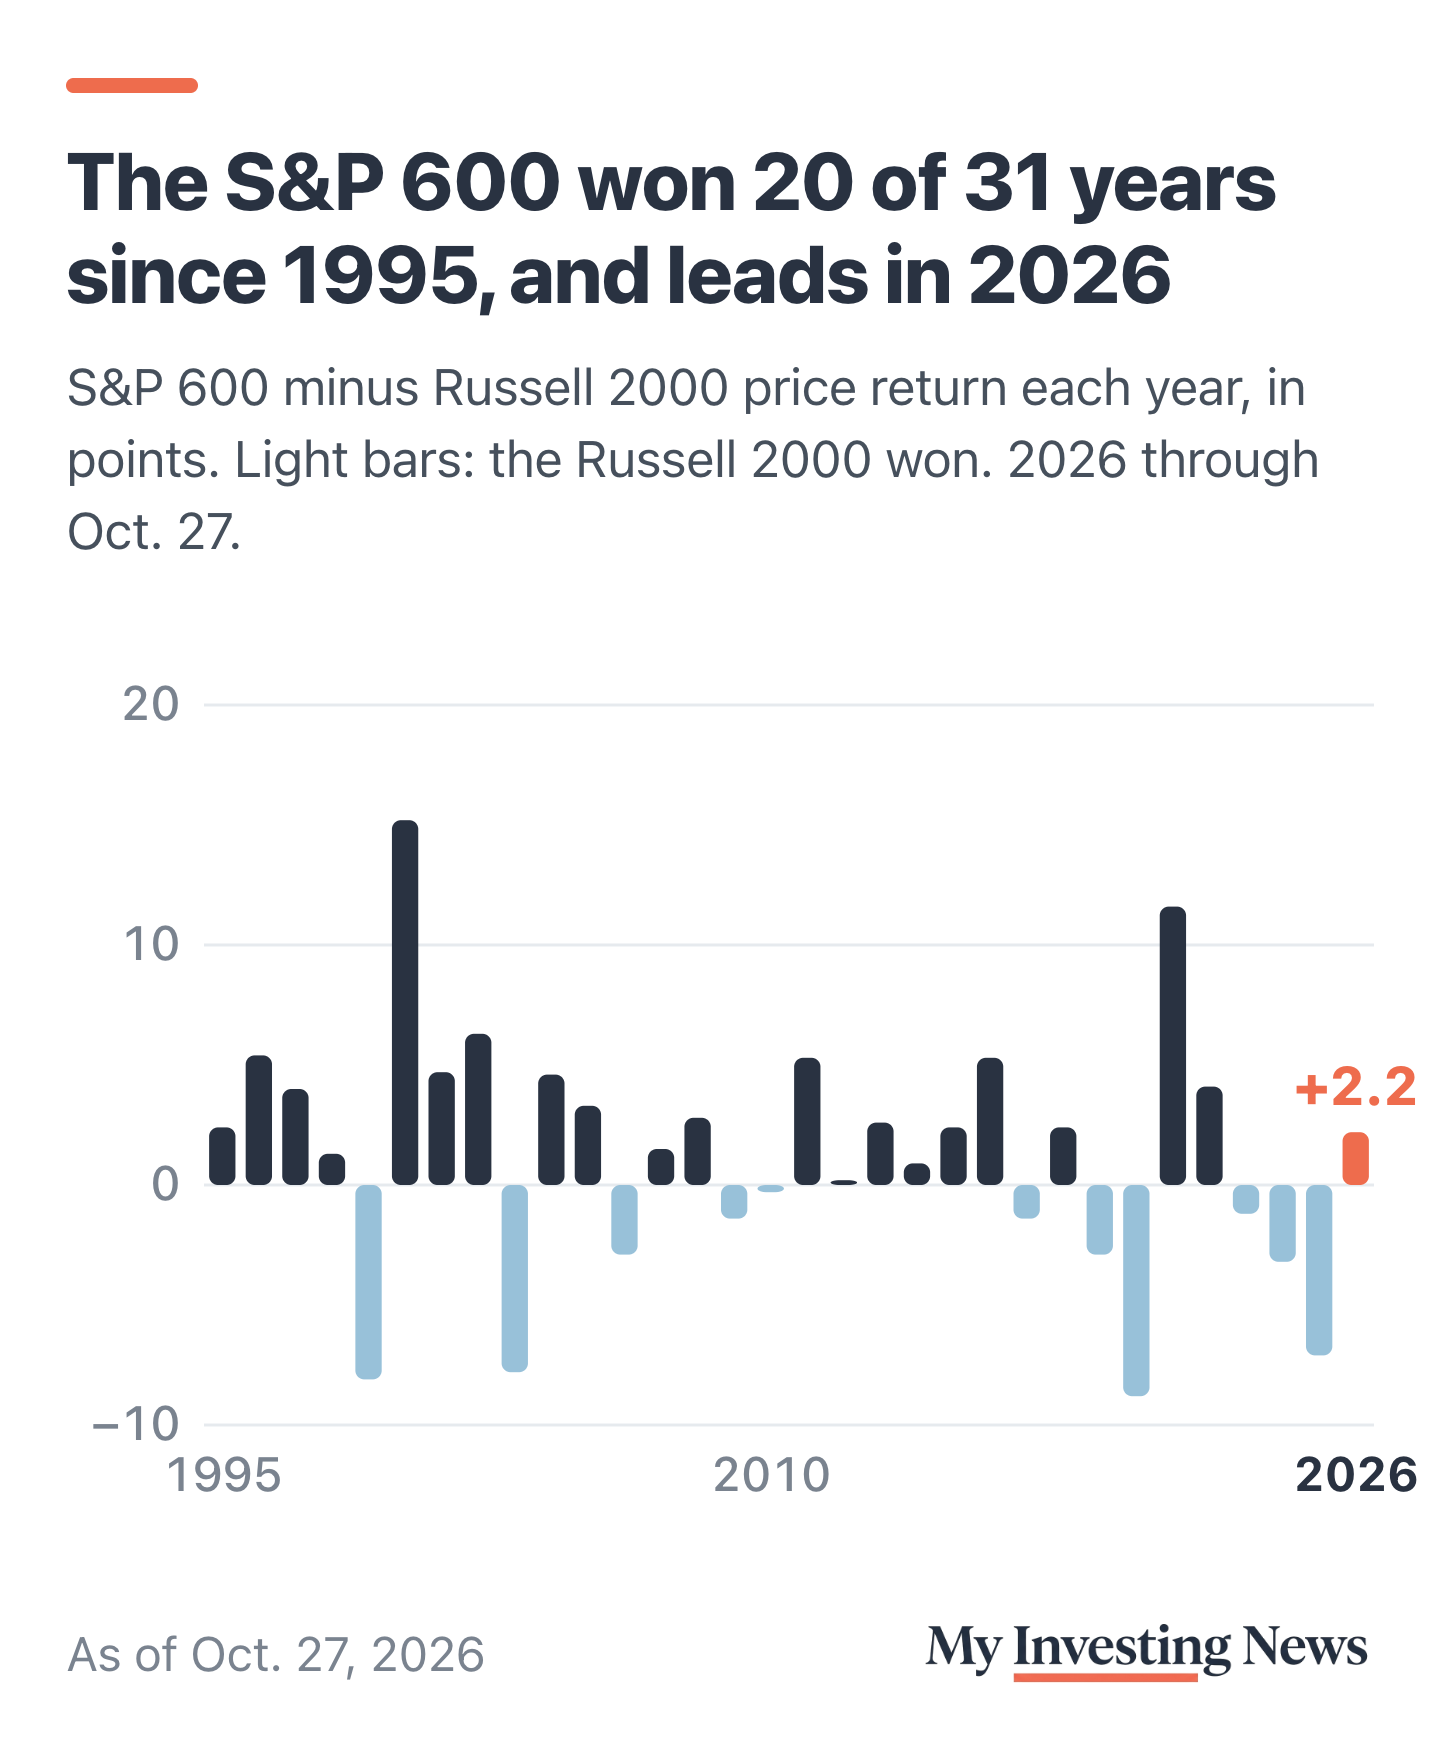
Sonders’s description of last year fits the record. In 2025 the Russell 2000 rose 11.3% and the S&P 600 4.2%, a 7.1-point gap, one of the four widest wins for the unscreened index since 1995, along with 1999, 2003 and 2020. This year has turned: through Oct. 27, the S&P 600 was up 15.7% and the Russell 2000 13.6%. That 2.2-point lead is much smaller than the 18 points she cited. Comparing two indexes is a rougher test than splitting the Russell 2000 itself by profits.
Dividends don’t change the picture. The iShares funds that track the two indexes, which include dividends, agree with the price-return winner in 24 of the 25 years since 2001. The exception was 2012, a near tie.
S&P 600 minus Russell 2000, price returns
What Came After Junk Rallies
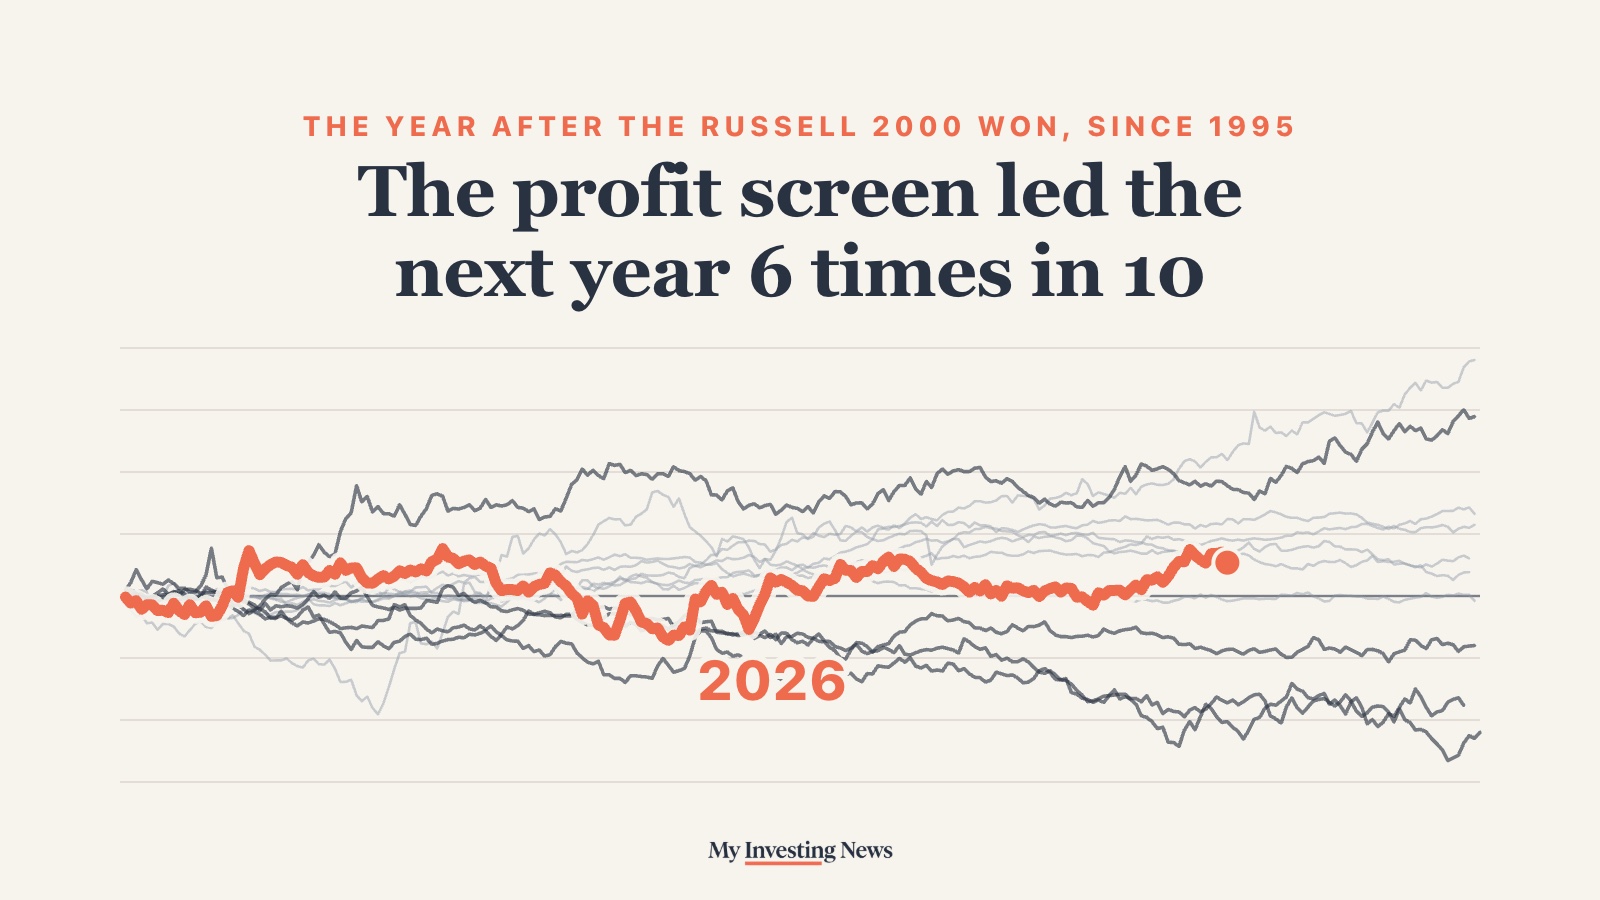
The Russell 2000 won 11 of those 31 years. In the 10 years that followed one, the S&P 600 led 6 times, by an average of 2.1 points. That is close to its record in all years, so a year of junk leadership hasn’t been much of a signal on its own.
The biggest junk rallies did tend to reverse. After the three years before 2025 when the Russell 2000 won by 7 points or more, the S&P 600 led the next year each time: by 15.2 points in 2000, 4.6 in 2004 and 11.6 in 2021. Three cases are too few to lean on. The recent record points the other way: in the three most recent years that followed a junk-led year, 2020, 2024 and 2025, the S&P 600 lost by 8.8, 3.2 and 7.1 points.
After the Russell 2000 won a year, the S&P 600 led the next one 6 times in 10. This year it is ahead by 2.2 points.
S&P 600 price return minus Russell 2000 price return, in percentage points, from the first trading day of each year that followed a year the Russell 2000 won. Gray: 2000 to 2018. Dark: since 2020. Coral: 2026, after the Russell 2000 won 2025, through Oct. 27.
What to Watch
Through Oct. 27, 2026 was tracking near the middle of those past years: at the same point in the calendar, the S&P 600 had been ahead in 6 of the 10. Less than two months of trading are left, and the 2020 and 2025 lines show how much a gap can move late in a year.
Sonders’s argument rests on earnings. If worries about profit margins and the cost of the AI build-out keep growing, the screen should keep helping. If money returns to the most speculative small stocks, the Russell 2000 can catch up quickly, as it did in 2020. Wilmington Trust’s Meghan Shue is overweight small caps anyway.
Sonders says profitable small caps have taken back the lead in 2026 after a year when money-losing ones doubled their gains. The profit-screened S&P 600 is ahead of the Russell 2000 by 2.2 points through Oct. 27 and has won 20 of 31 years since 1995. After the Russell 2000’s past winning years, it led the next year 6 times in 10, so history leans her way without guaranteeing a finish ahead.