Where we heard itX, post by Sen. Elizabeth Warren (D., Mass.), Oct. 26, 2026, sharing a CBS News report on President Trump’s oil and gas stocks. The post
Sen. Elizabeth Warren wants individual stocks out of the hands of the people who write the rules. “It should be illegal for the President, VP, and lawmakers in Congress to own, buy, and sell individual stocks,” the Massachusetts Democrat posted on X on Oct. 26.
She was sharing a CBS News report on an analysis by Democrats on Congress’s Joint Economic Committee. It estimated that President Trump’s oil and gas holdings are worth $22.5 million to $81.6 million, up from $12.6 million to $46 million at the end of 2025, as energy stocks surged during the war with Iran. The White House told CBS that the president’s portfolio is run by independent managers in accounts that “automatically replicate recognized indexes.”
Where a Ban Stands
Presidents, vice presidents and members of Congress can own and trade stocks today as long as they report the trades, generally within 45 days. The House passed a bill in July that would bar members, their spouses and dependent children from buying new individual stocks. On Sept. 30, 53 senators voted to take it up and 47 voted no, seven short of the 60 needed, after Republicans had attached a voter ID requirement that Democrats opposed, Roll Call reported.
The president’s own filings show how much can move through those accounts. His periodic transaction report dated Sept. 17 lists 517 transactions, almost all of them in August, from municipal bonds to shares of Microsoft and Nvidia.
Warren’s case is about conflicts of interest. The claim that usually rides along with it, that lawmakers trade with an edge, can be checked.
Two Funds That Copy Congress
Since Feb. 7, 2023, two exchange-traded funds have bought what members of Congress report buying. The Unusual Whales Subversive Democratic Trading ETFNANC follows Democrats and their families. The Unusual Whales Subversive Republican Trading ETFGOP, which traded as KRUZ until 2025, follows Republicans. NANC’s prospectus says it overweights stocks with large, repeated purchases or buyers from several members, and it charges 0.72% a year.
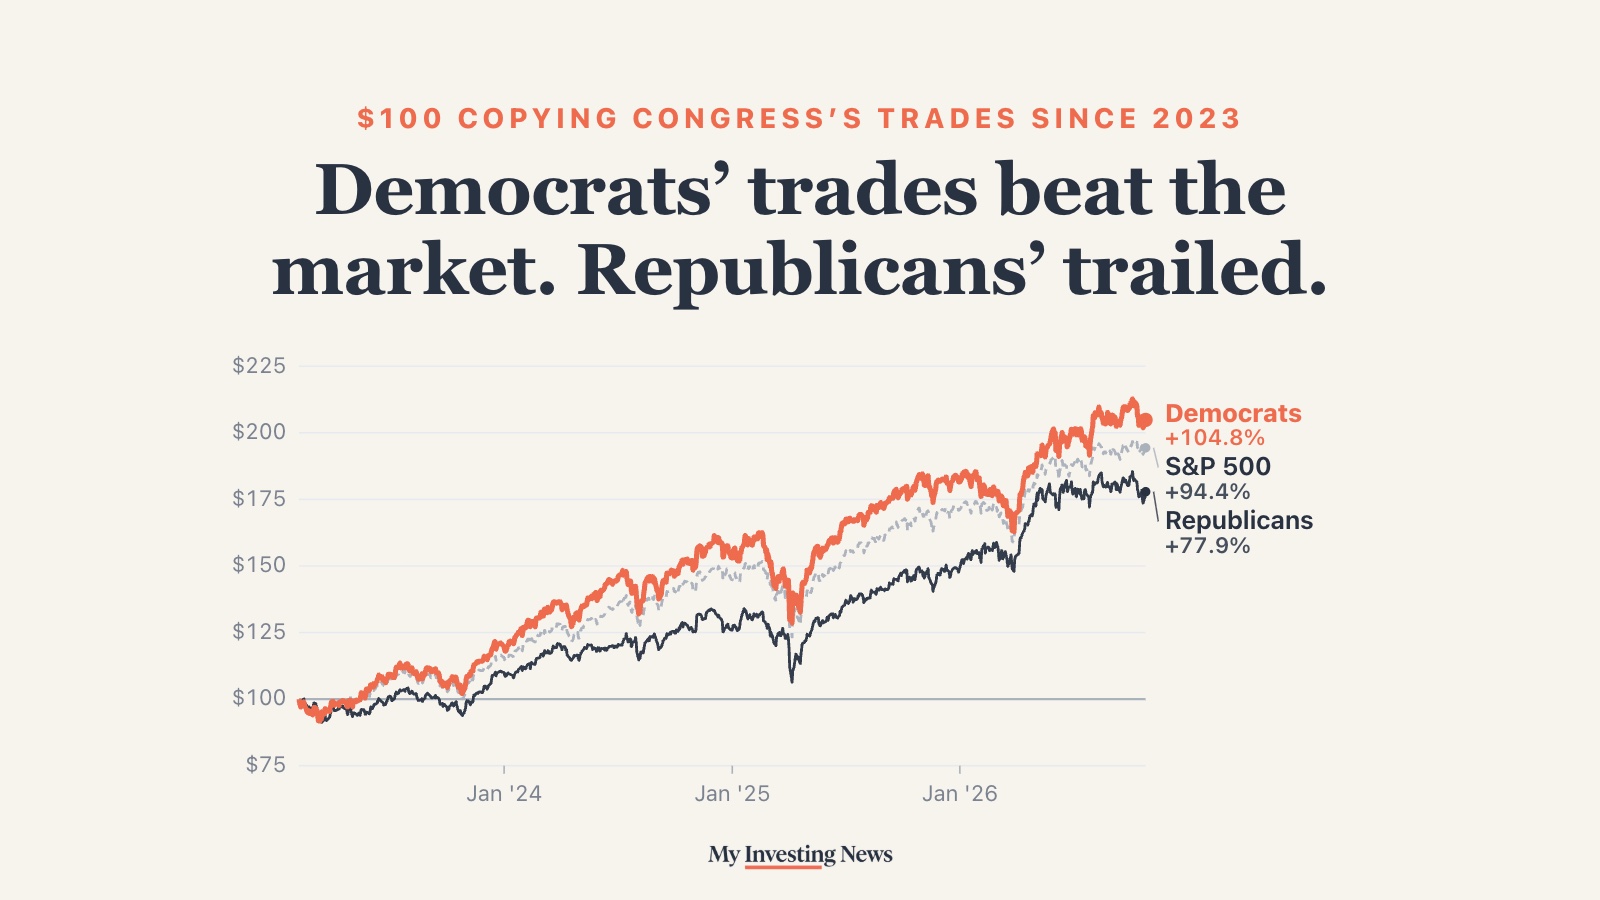
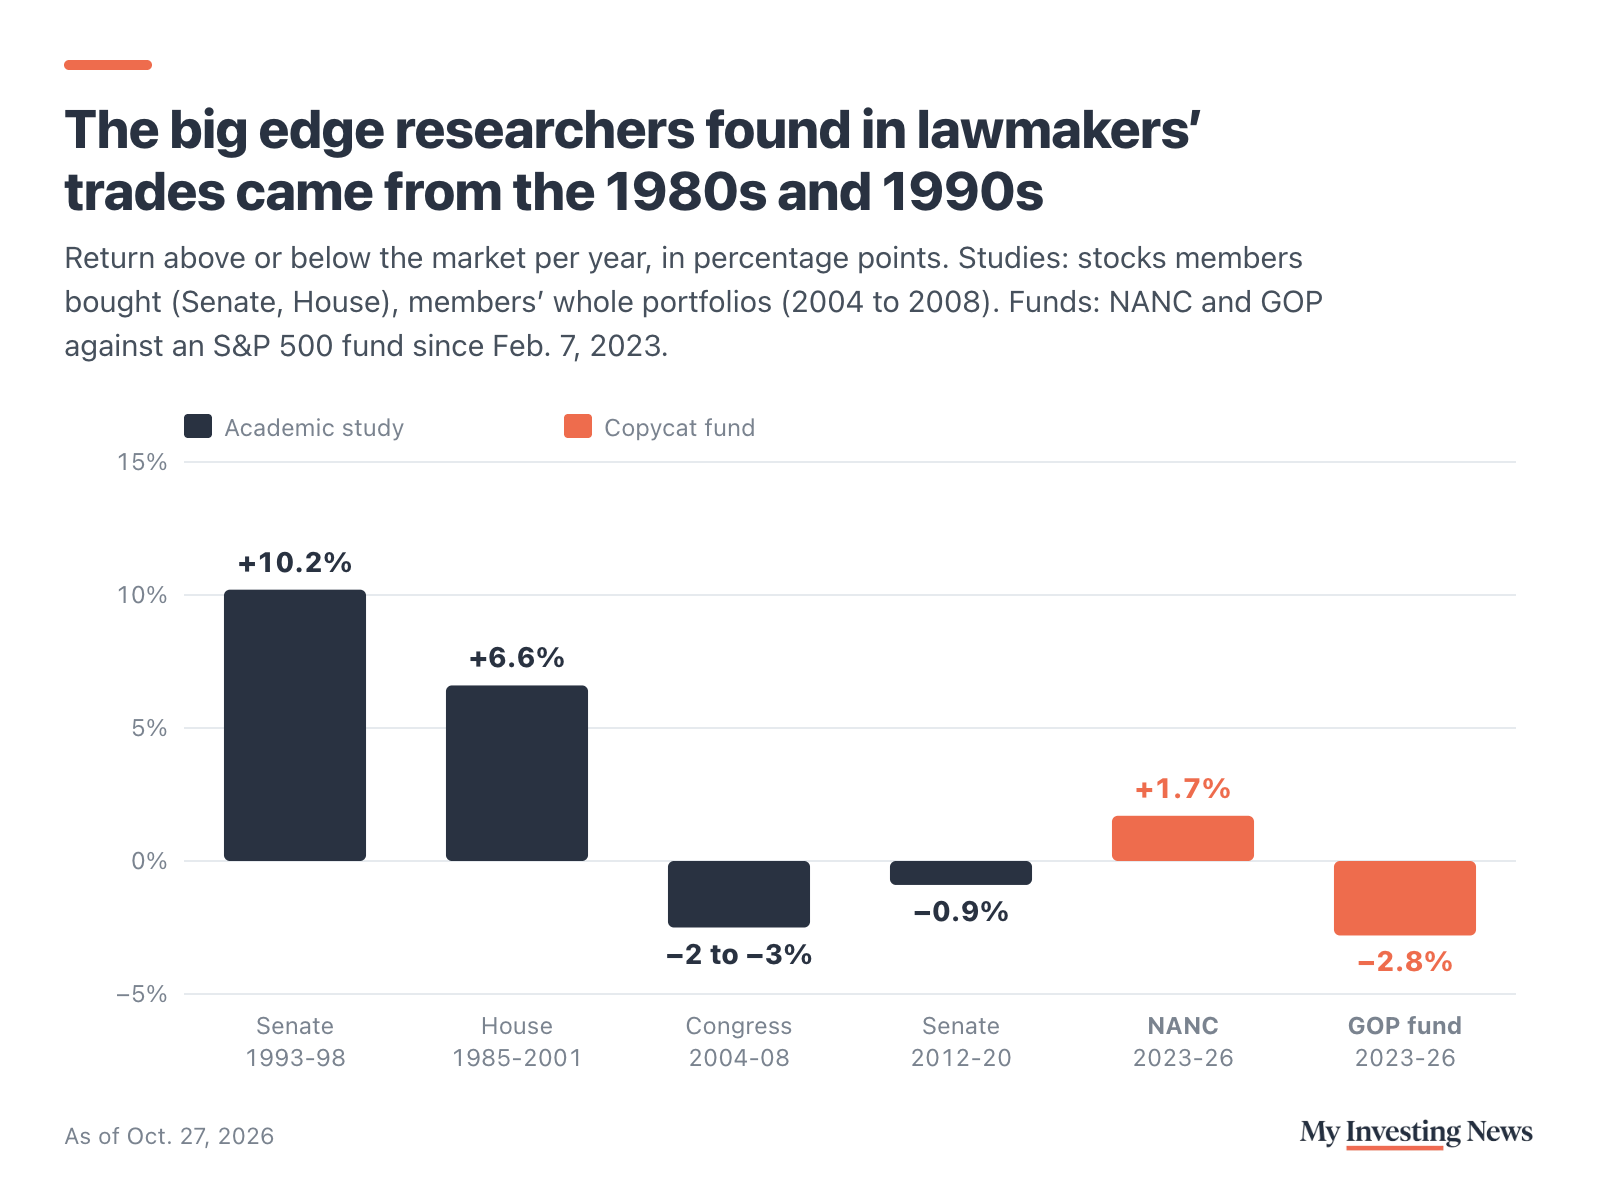
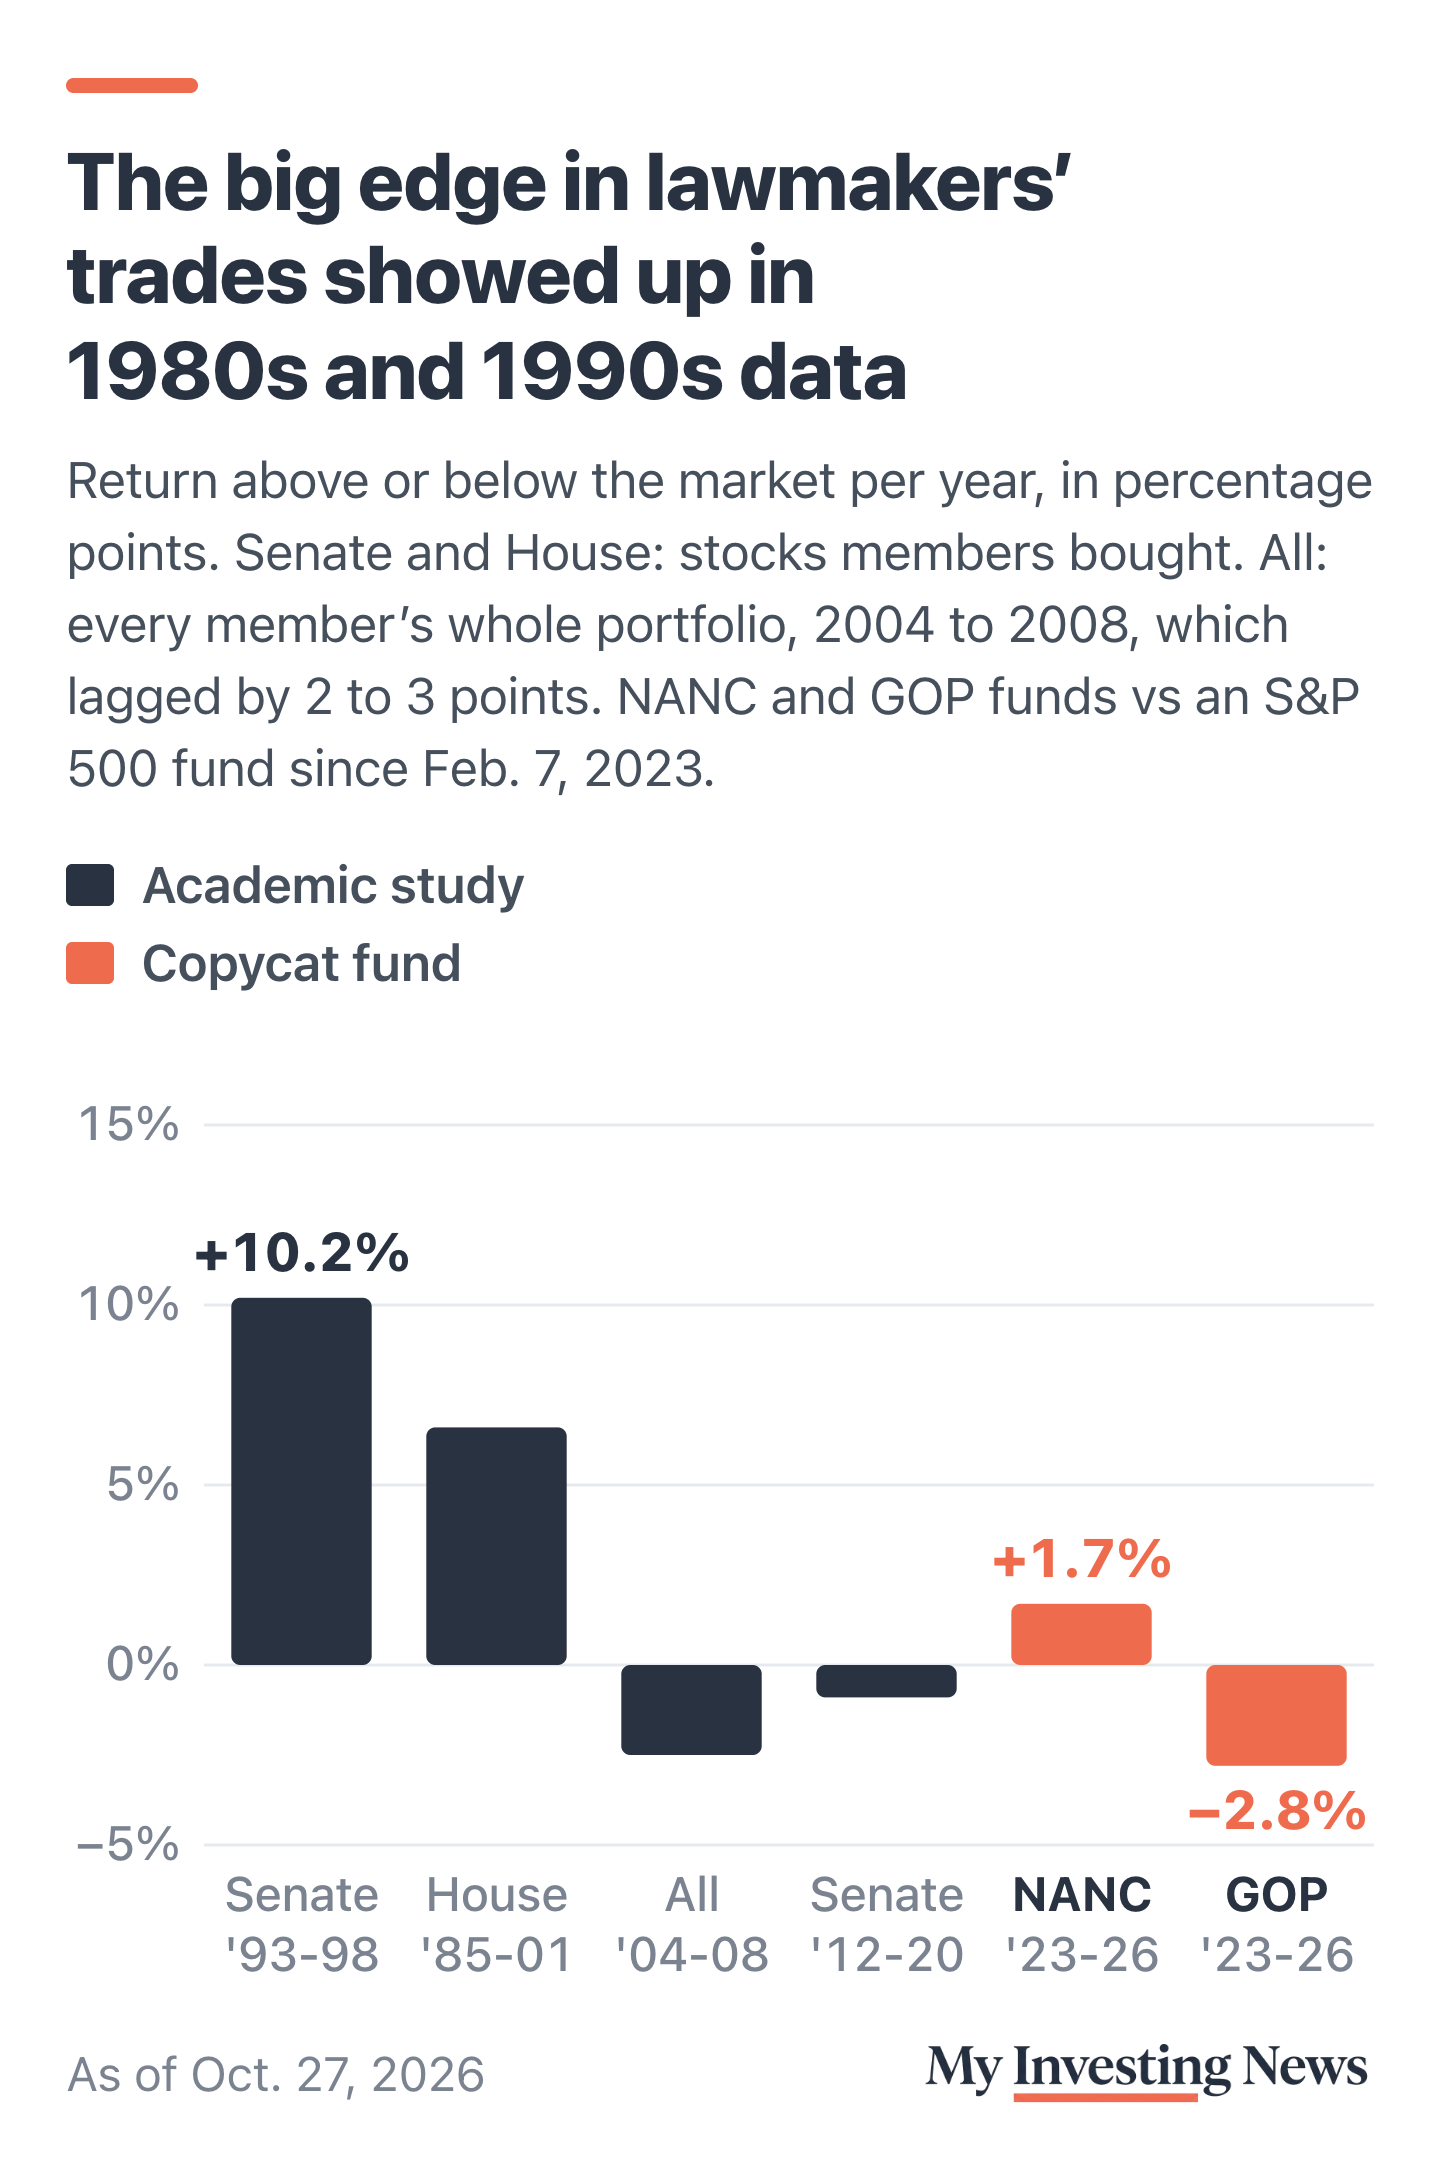
Through the Oct. 27 close, NANC returned 104.8% including dividends, against 94.4% for State Street’s SPDR S&P 500 ETFSPY. GOP returned 77.9%. Per year, that puts the Democrats’ fund about 1.7 points ahead of the S&P 500 and the Republicans’ fund about 2.8 points behind.
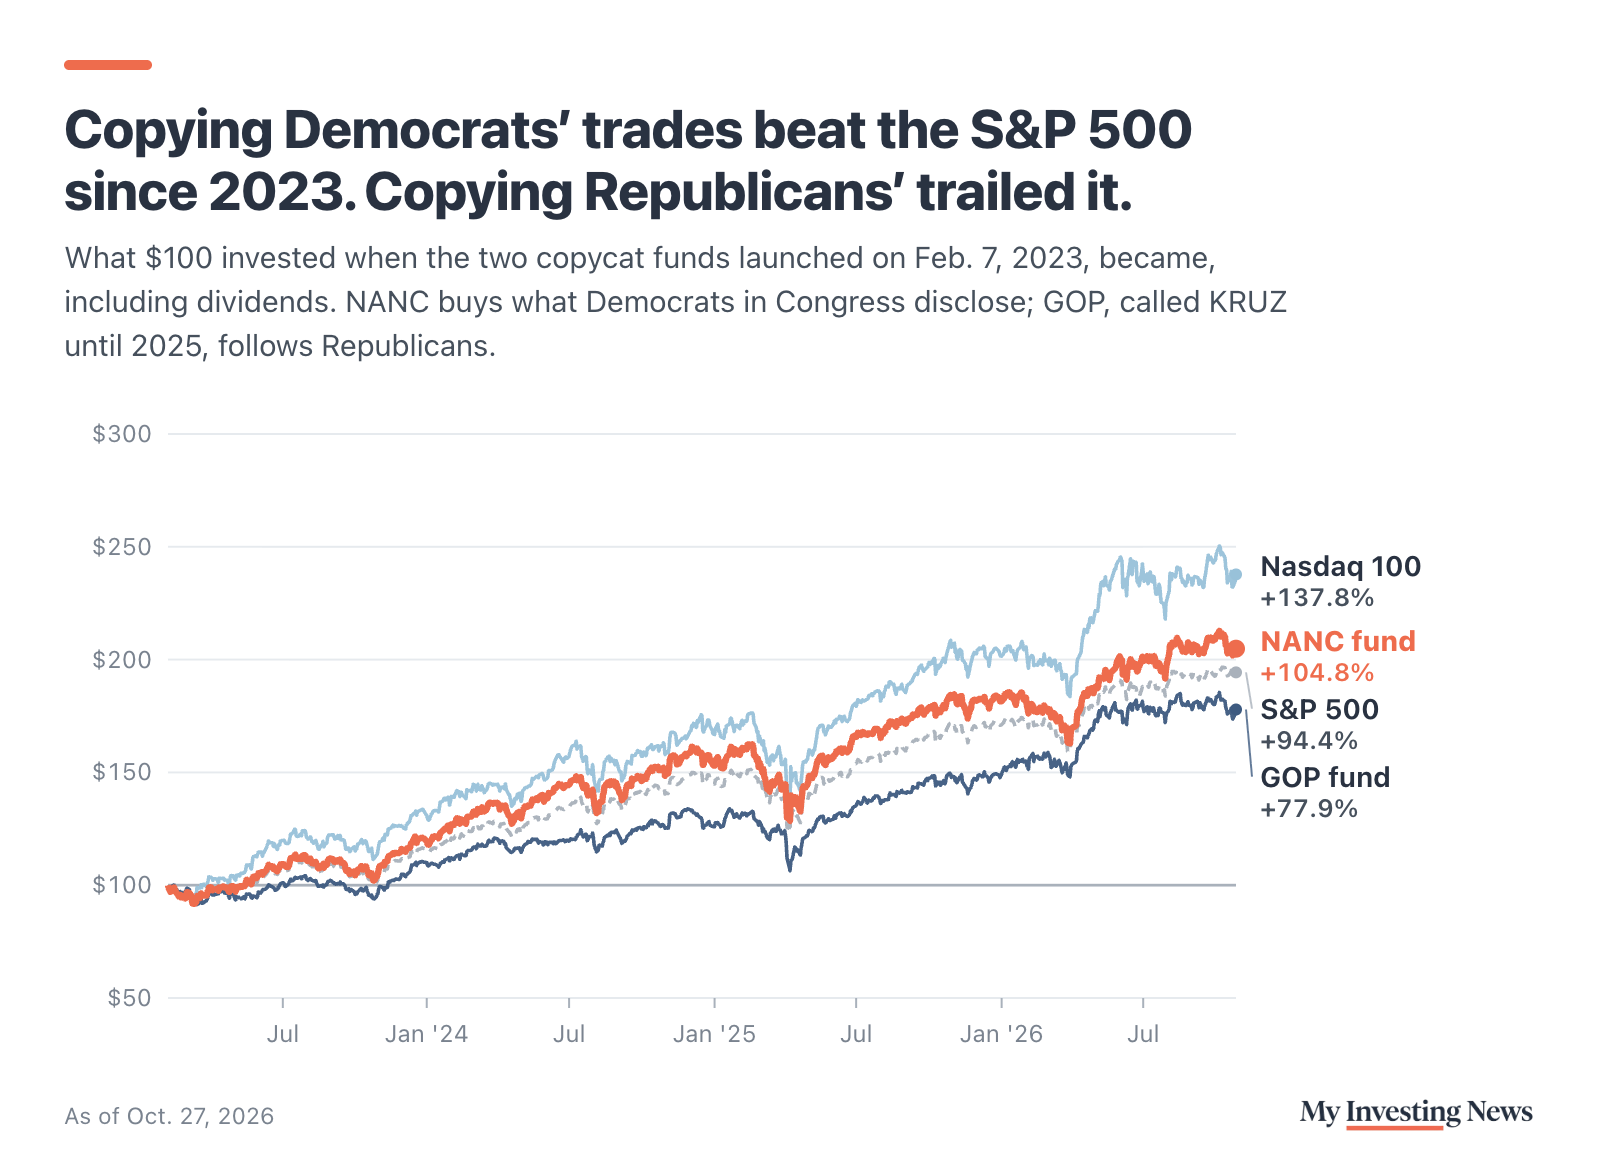
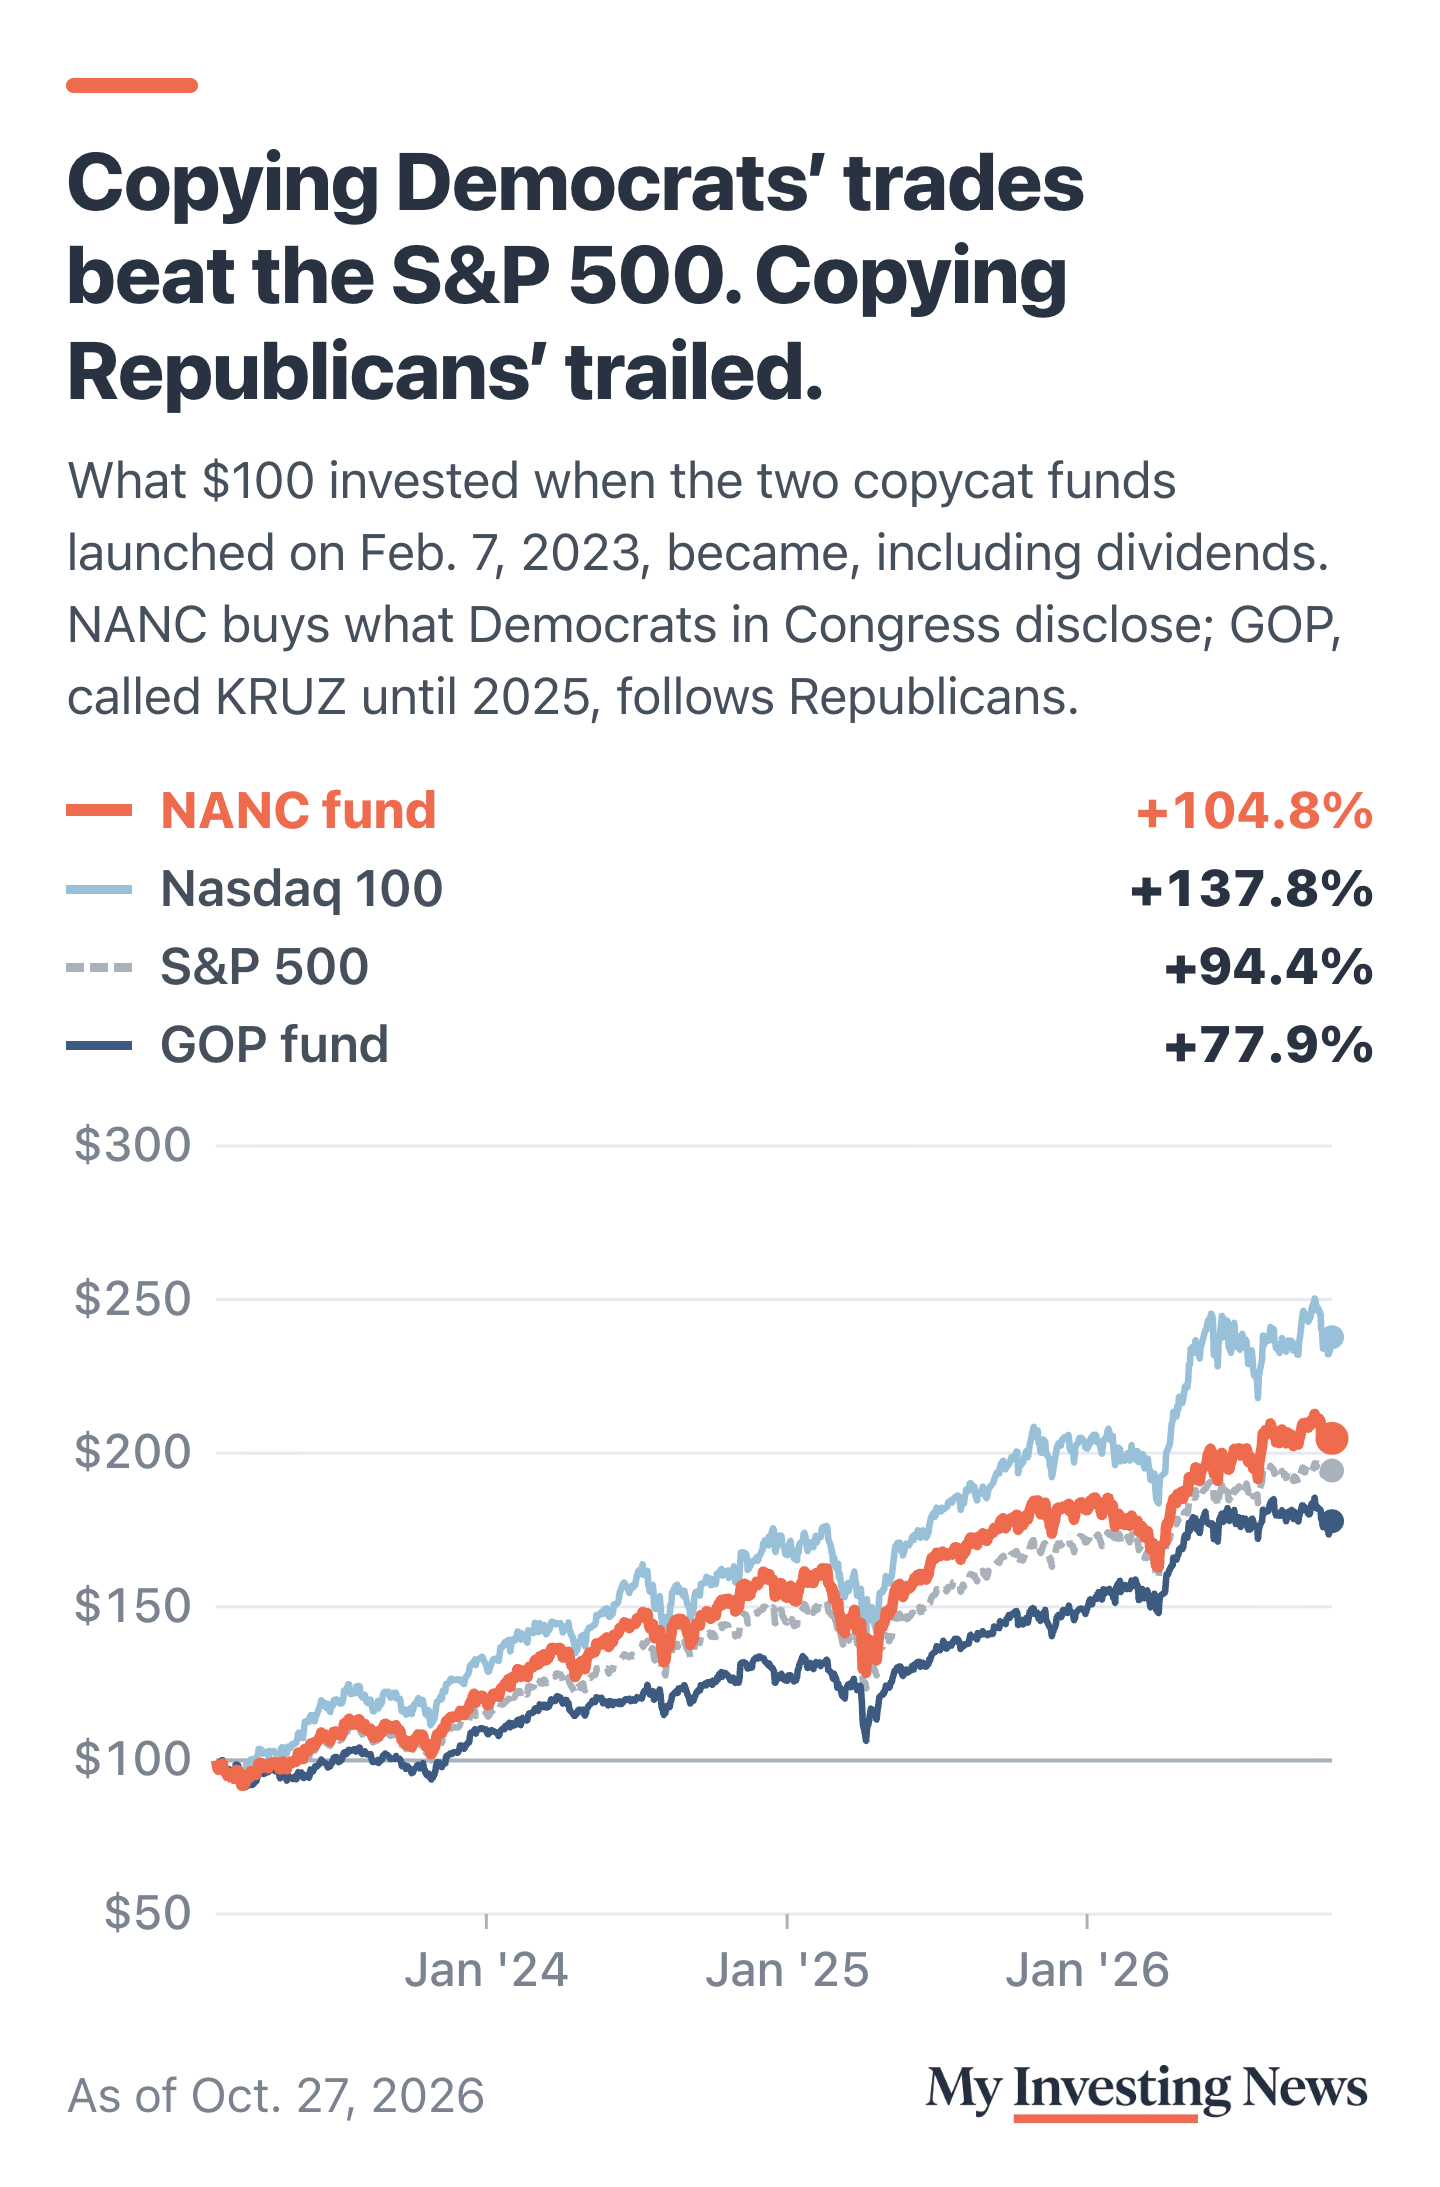
NANC’s lead lines up with a heavy tech weighting. At the end of June, six names (Nvidia, Applied Materials, Alphabet, Microsoft, Amazon and Apple) made up 34.3% of the fund, according to its latest holdings filing. The Invesco QQQ TrustQQQ, which tracks the Nasdaq 100, returned 137.8% over the same stretch, well ahead of NANC. GOP’s biggest holdings were Comfort Systems USA and Intel. This year the order has flipped: GOP is up 20.5% in 2026, NANC 12.8% and the S&P 500 fund 13.7%.
The funds also can’t copy anyone in real time. They trade on reports that can arrive 45 days after the fact, so they measure whether lawmakers’ trades still pay once they are public, which is a different question from whether the members themselves profited.
Copying Congress since Feb. 7, 2023
What the Research Found
The belief that lawmakers trade with an edge rests mostly on two studies by Alan Ziobrowski and co-authors. The first, published in 2004, found that stocks senators bought from 1993 to 1998 beat the market by 85 basis points a month, about 10% a year. The second, in 2011, found that House members’ purchases from 1985 to 2001 beat it by 55 basis points a month, over 6% a year. In the House study, Democrats’ purchases beat the market by nearly 9% a year and Republicans’ by about 2%, a gap the authors noted came while Democrats controlled the House for 10 of the 17 years.
Newer data told a different story. Andrew Eggers and Jens Hainmueller studied members’ actual portfolios from 2004 to 2008 and found the average investor in Congress trailed the market by 2% to 3% a year. They also pointed out that in the Senate study, just four senators accounted for nearly half the trades. A 2020 National Bureau of Economic Research paper by William Belmont, Bruce Sacerdote, Ranjan Sehgal and Ian Van Hoek covered senators from 2012, the year the STOCK Act passed, to March 2020. Stocks senators bought slightly trailed similar stocks. The paper’s title: “Relief Rally: Senators As Feckless As the Rest of Us at Stock Picking.”
The exception is at the top. A December 2025 NBER paper by Shang-Jin Wei and Yifan Zhou followed 20 lawmakers who traded both before and after rising to party leadership between 1995 and 2021. Before, they did about as well as matched colleagues, and both groups trailed the market. Afterward, the leaders beat those colleagues by up to 47 percentage points a year.
For the bar chart, we turned the two Ziobrowski studies’ monthly figures into yearly ones by multiplying by 12, and the 2020 paper’s daily estimate by 252 trading days. The 2020 result was not statistically significant.
What to Watch
As of Oct. 26, the JEC Democrats said the president had not yet reported his September and October trades, and members’ own reports keep coming under the 45-day rule. The Senate is out until after the Nov. 3 midterms, and whether a ban comes back may depend on who controls the Senate next year.
For the funds, NANC has been ahead of the S&P 500 fund since May 2023. Its lead peaked at 16.4 percentage points on Oct. 1 and had narrowed to 10.4 by Oct. 27. GOP has trailed the S&P 500 fund since March 2023, though it leads both this year.
Warren frames a stock ban as a matter of conflicts of interest. On returns, the record splits by era: studies of 1980s and 1990s trades found a large edge, and newer ones found none for Congress as a whole. Since 2023, the fund copying Democrats has beaten the S&P 500 by about 1.7 points a year while trailing the Nasdaq 100, and the fund copying Republicans has trailed both.