Where we heard itMorgan Stanley’s “Thoughts on the Market” podcast, “To Hike or Not to Hike,” Oct. 27, 2026, with Matthew Hornbach, global head of macro strategy, and chief U.S. economist Michael Gapen.
Matthew Hornbach has a short answer for why Treasury yields climbed so far this year. On Morgan Stanley’s Thoughts on the Market, recorded the morning of Oct. 27, Gapen asked him how to read a market where the 10-year yield had peaked above 5.25% and slipped back to about 5%. Hornbach pointed to energy prices.
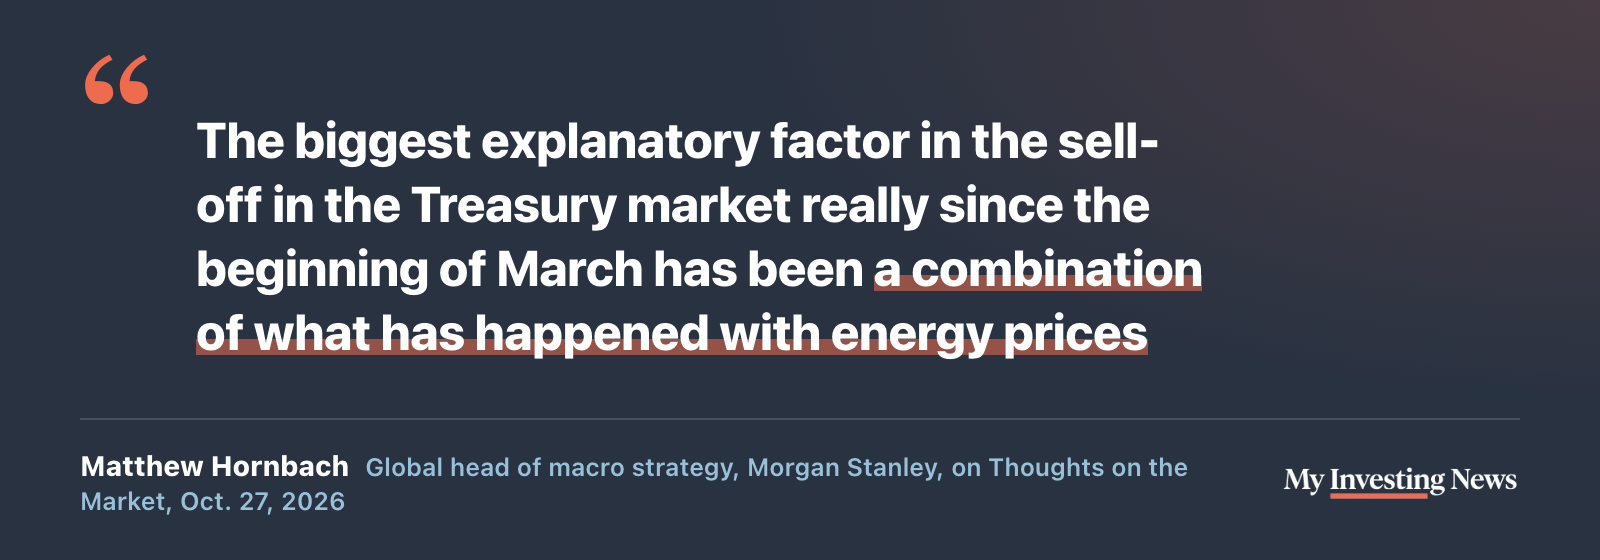
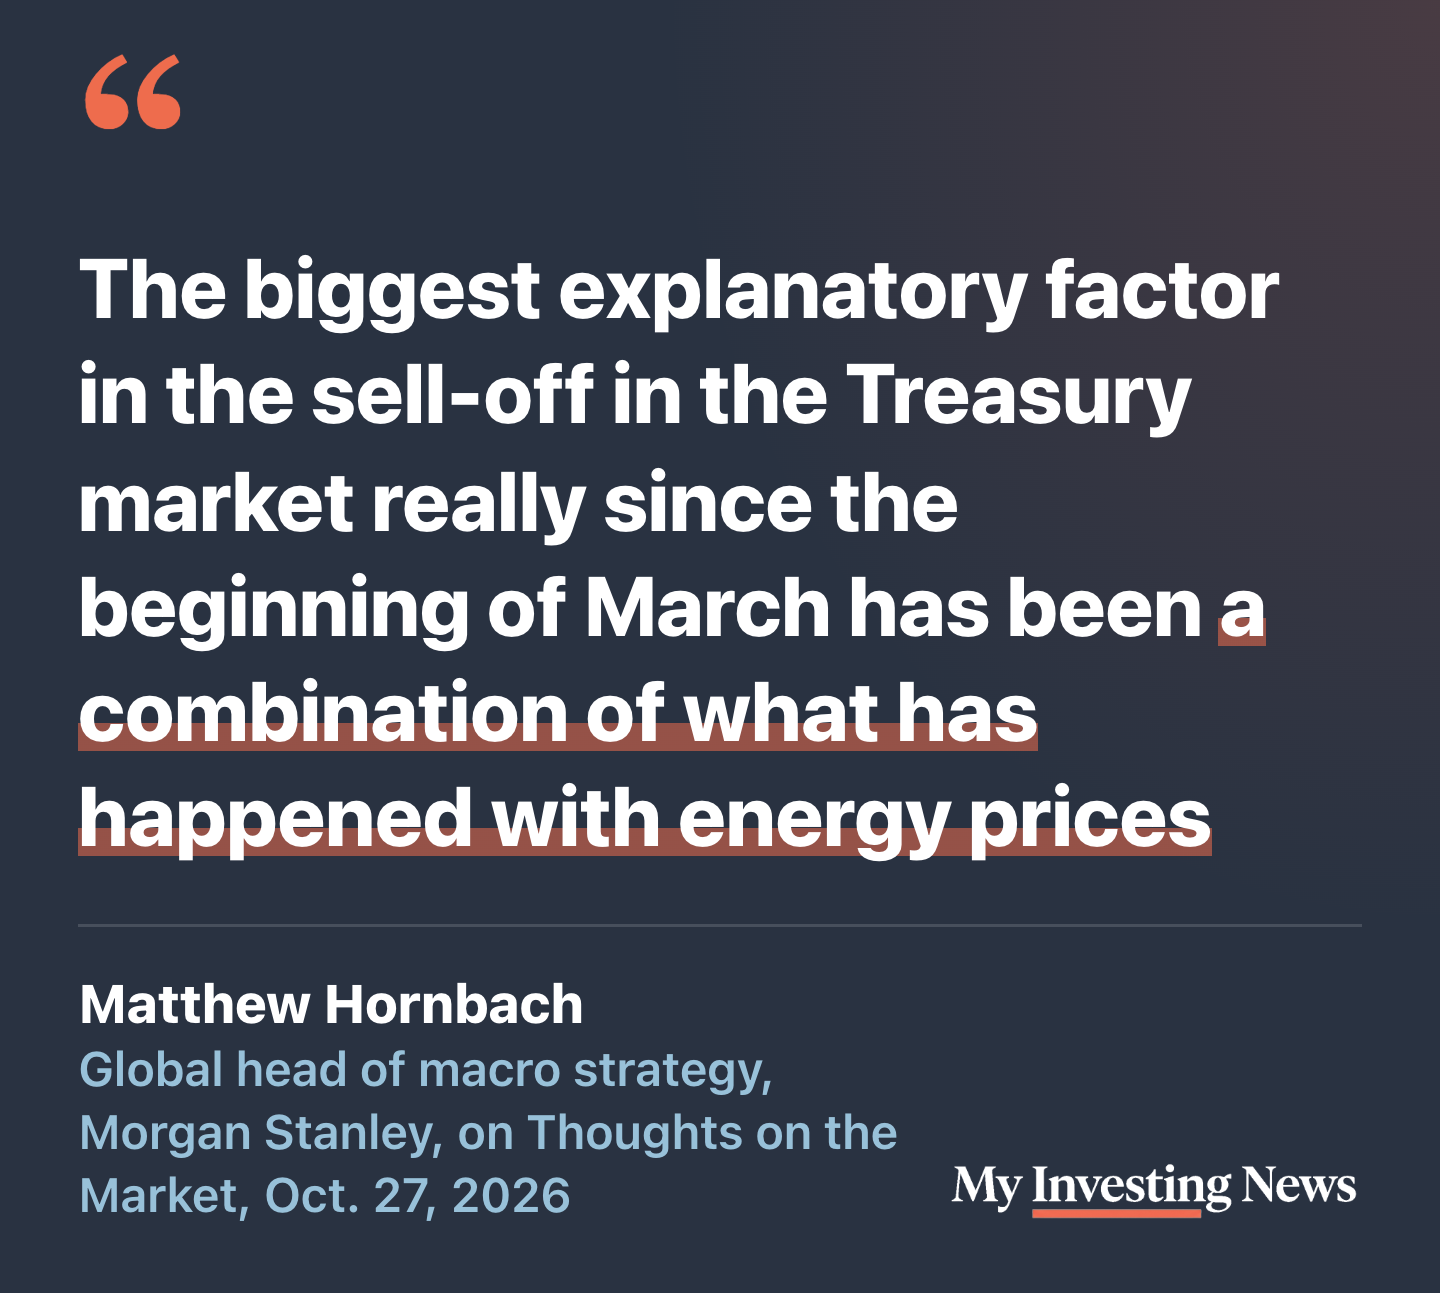
He named the second half of that combination too: how the central bank shifted its view on rates because of what higher energy prices were doing to underlying inflation. The Fed went from cutting in 2025 to raising rates in 2026, and “the bond market had to reprice,” he said. The final push to the peak was different. “We see the last 25 basis points as more of a technical dynamic that was driving yields to those peak levels,” Hornbach said, driven by flows across the broader bond market, including mortgage-backed and corporate bonds.
The record fits his outline. The 10-year yield closed at 3.97% on Feb. 27, the last trading day before March, peaked at 5.31% on Oct. 5, and closed at 4.99% on Oct. 27. That last stretch from 5% to the peak and back is the move he calls technical.
Splitting the 10-Year’s Rise
A 10-year Treasury yield can be split into two parts. One is the real yield on inflation-protected Treasuries. The other is breakeven inflation, the gap between the two, which is the bond market’s rough estimate of inflation over the next decade. If oil had pushed yields up by stoking inflation fears, breakevens would carry the move.
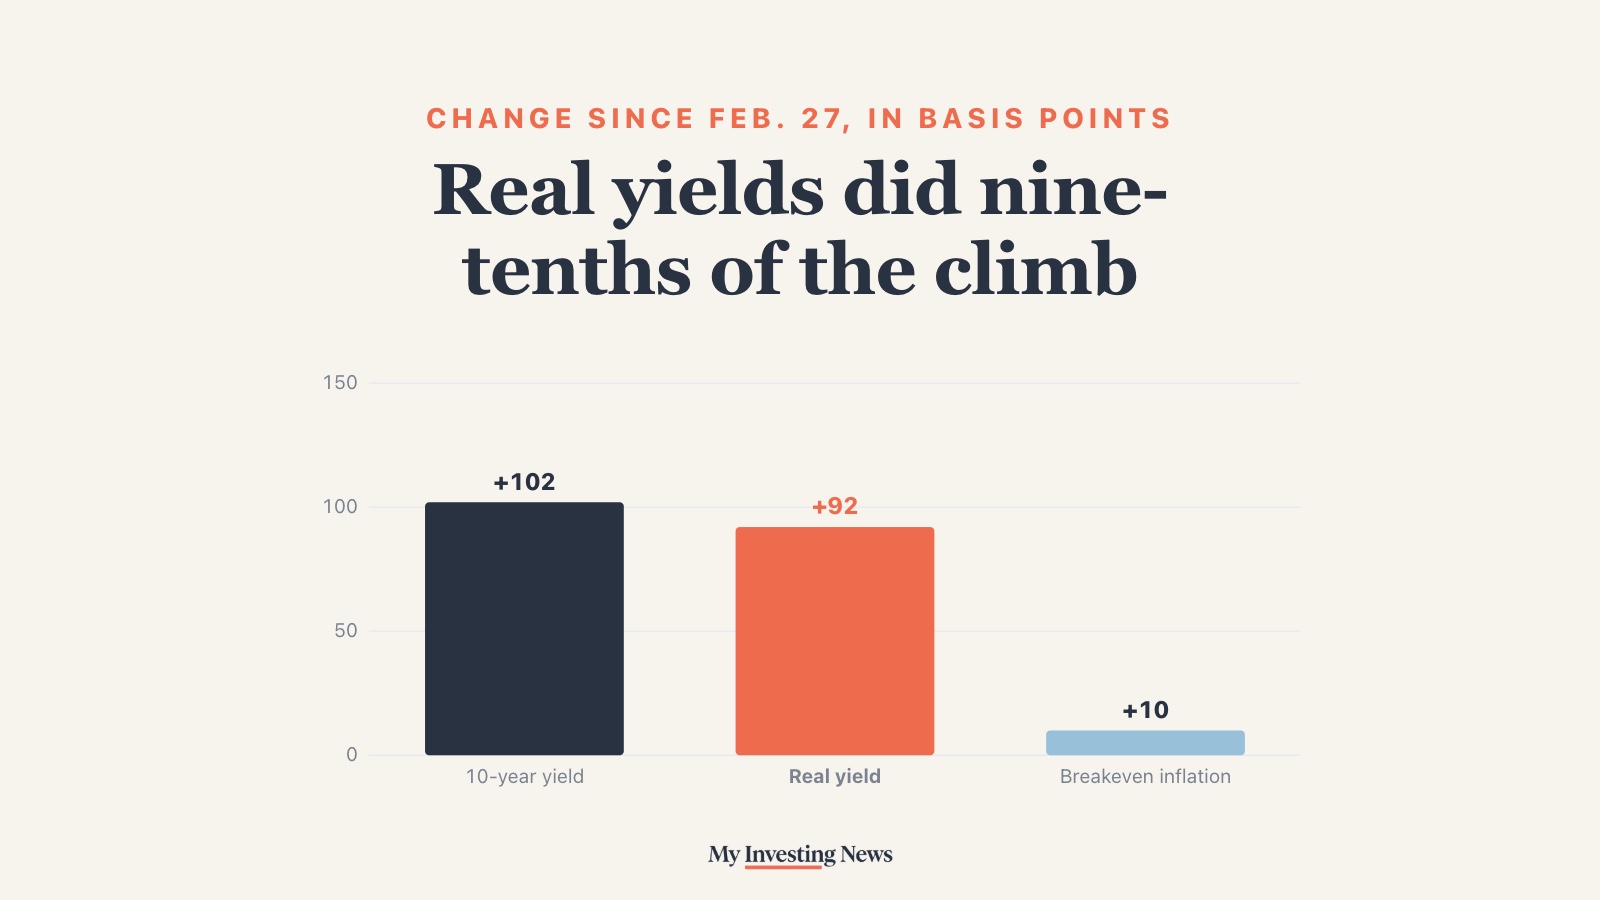
They didn’t. From the Feb. 27 close to the Oct. 27 close, the 10-year rose 102 basis points. The real yield rose 92 basis points, from 1.72% to 2.64%. Breakeven inflation rose 10 basis points, from 2.25% to 2.35%, about a tenth of the total. It peaked at 2.50% on May 4 and has drifted back since.
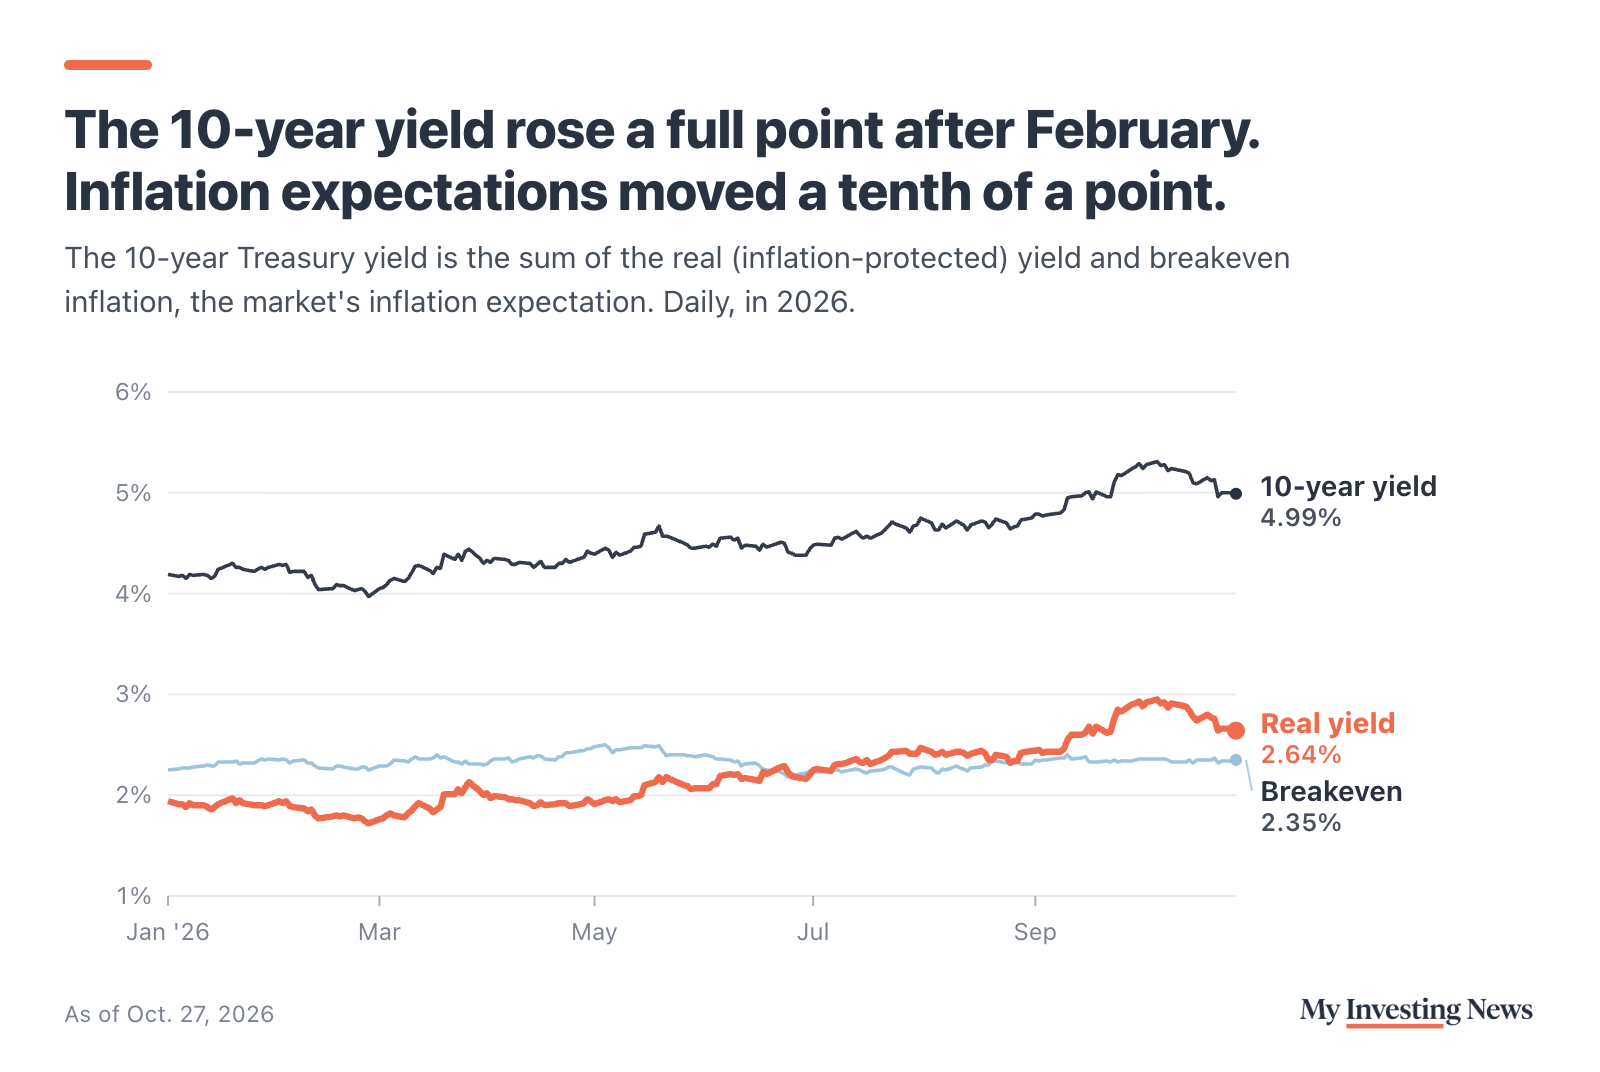
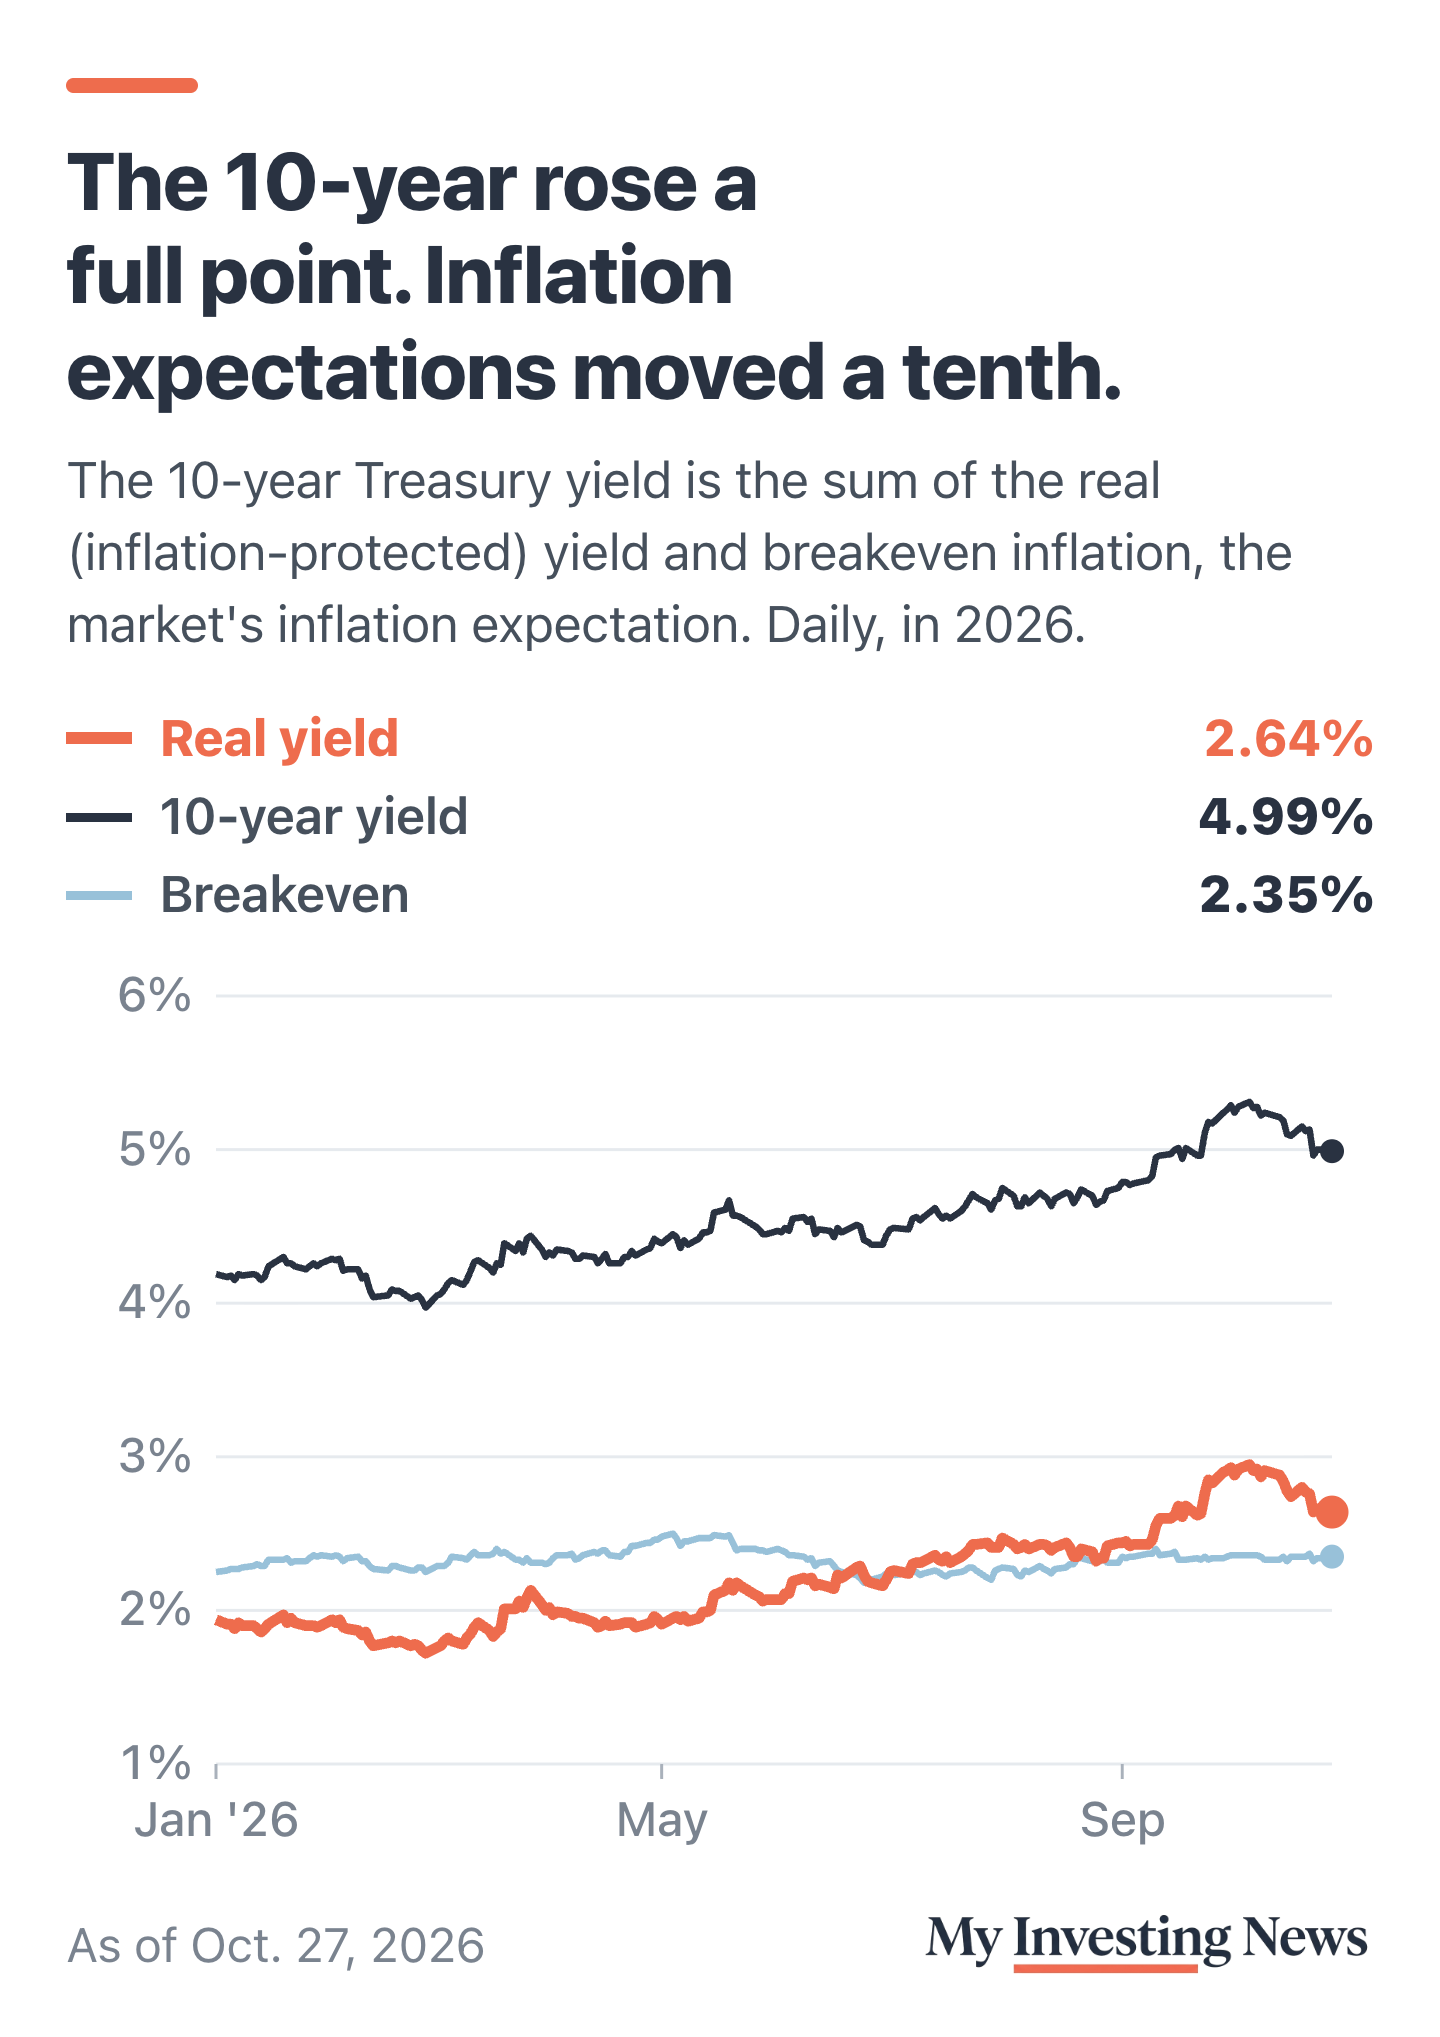
That happened while oil surged. West Texas Intermediate crude went from $66.96 a barrel on Feb. 27 to $107.89 on Oct. 20, the latest spot price the Energy Information Administration has published, up 61%. The real yield, meanwhile, closed at 2.64% on Oct. 27, a level not seen before this year since November 2008. It reached 2.95% on Oct. 5.
The 10-year since Feb. 27
The Fed Did the Work
That split points to the second half of Hornbach’s answer. Real yields move with what investors expect the Fed to do, and expectations changed fast. The Fed cut its target three times in late 2025, to a range of 3.5% to 3.75%, then raised it to 3.75% to 4% on Sept. 17, its first hike since July 2023. The 2-year Treasury yield, which tracks expected Fed policy closely, rose 132 basis points after February, from 3.38% to 4.70%, more than the 10-year did.
So the data supports Hornbach’s claim in a specific way. Energy prices mattered through the Fed’s response, and the bond market’s long-run inflation outlook barely moved. Other strategists have read the same rise differently: Ed Yardeni has argued that surging yields are a sign of strength.
On the episode, Hornbach said Morgan Stanley did not expect a hike at the Fed’s Oct. 28 meeting, and Gapen said he expects one more increase in March, after which the Fed stops hiking once it is clear inflation is slowing.
Oil First, Yields Later
The month-by-month record shows the order of events. Oil jumped in March and averaged more than $100 a barrel in April and May, yet the 10-year’s monthly average rose only 0.35 points from February to May. Oil then fell back to about $80 in July, and the 10-year kept climbing as the Fed moved toward its September hike. It added another 0.67 points from May to October, a run that also lifted mortgage rates to a 52-week high.
Oil jumped first, in March. The 10-year’s biggest climb came later, as the Fed turned to hiking.
Each dot is one month since January 2025: the average price of WTI crude across and the average 10-year Treasury yield up. October uses oil through Oct. 20 and yields through Oct. 27.
What Would Bring Yields Down
Hornbach said the path of Fed policy in 2027 will drive the Treasury market again. If investors decide the Fed is comfortable holding rates after its hikes, and might even reverse some of them as inflation cools, he expects 10-year yields to fall along with those expectations. Morgan Stanley’s next checkpoint is the Fed’s early December meeting.
Two things could test that view before then. Oil is still high: WTI futures settled at $99.90 on Oct. 27, and DCLA’s Sarat Sethi has warned that high oil prices haven’t hit stocks yet. And all the yields here are as of Oct. 27, before the Nov. 3 midterm elections, which could move Treasuries on their own.
Hornbach says energy prices and the Fed’s reaction to them drove the Treasury selloff since March. The numbers back the Fed half: real yields did 92 basis points of the 10-year’s 102 basis points rise, while the market’s inflation expectation added 10 basis points. The risk to his call for lower yields is oil staying high enough to keep the Fed hiking.