Where we heard itCNBC’s “Halftime Report,” Nov. 6, 2026 (“More Tech Trouble Ahead?”), with Jim Lebenthal, chief markets strategist at Cerity Partners, and Jenny Harrington, CEO of Gilman Hill Asset Management.
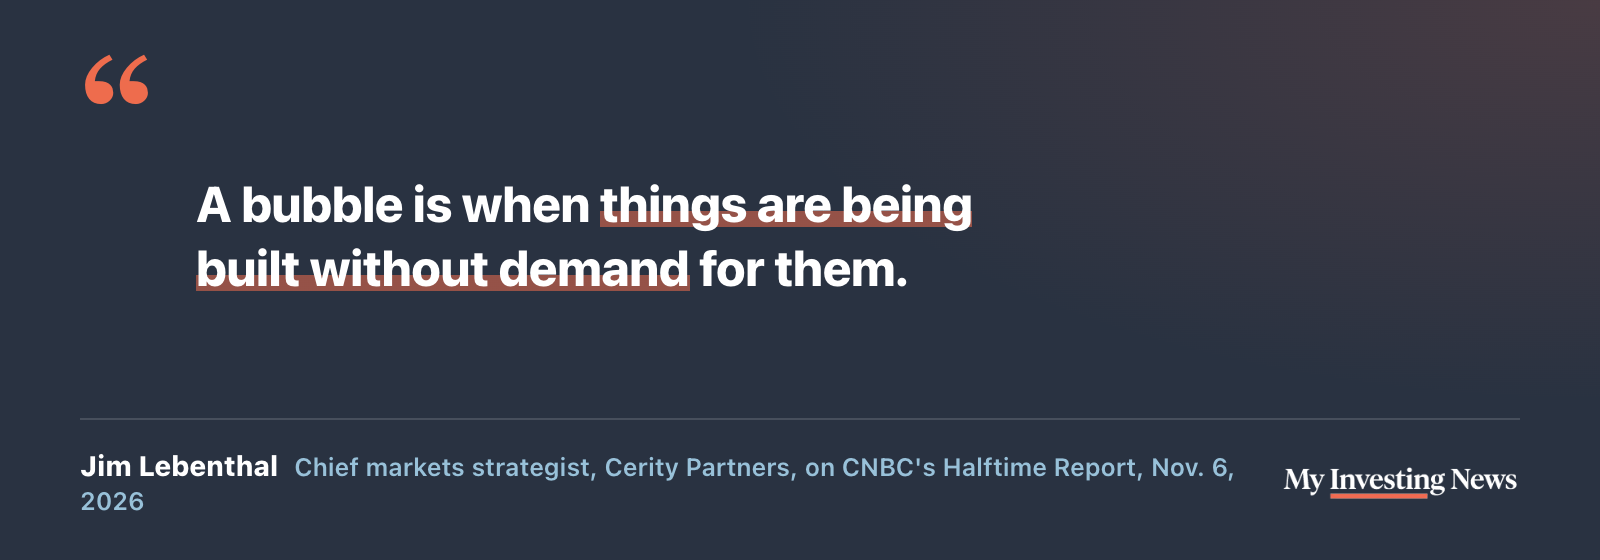
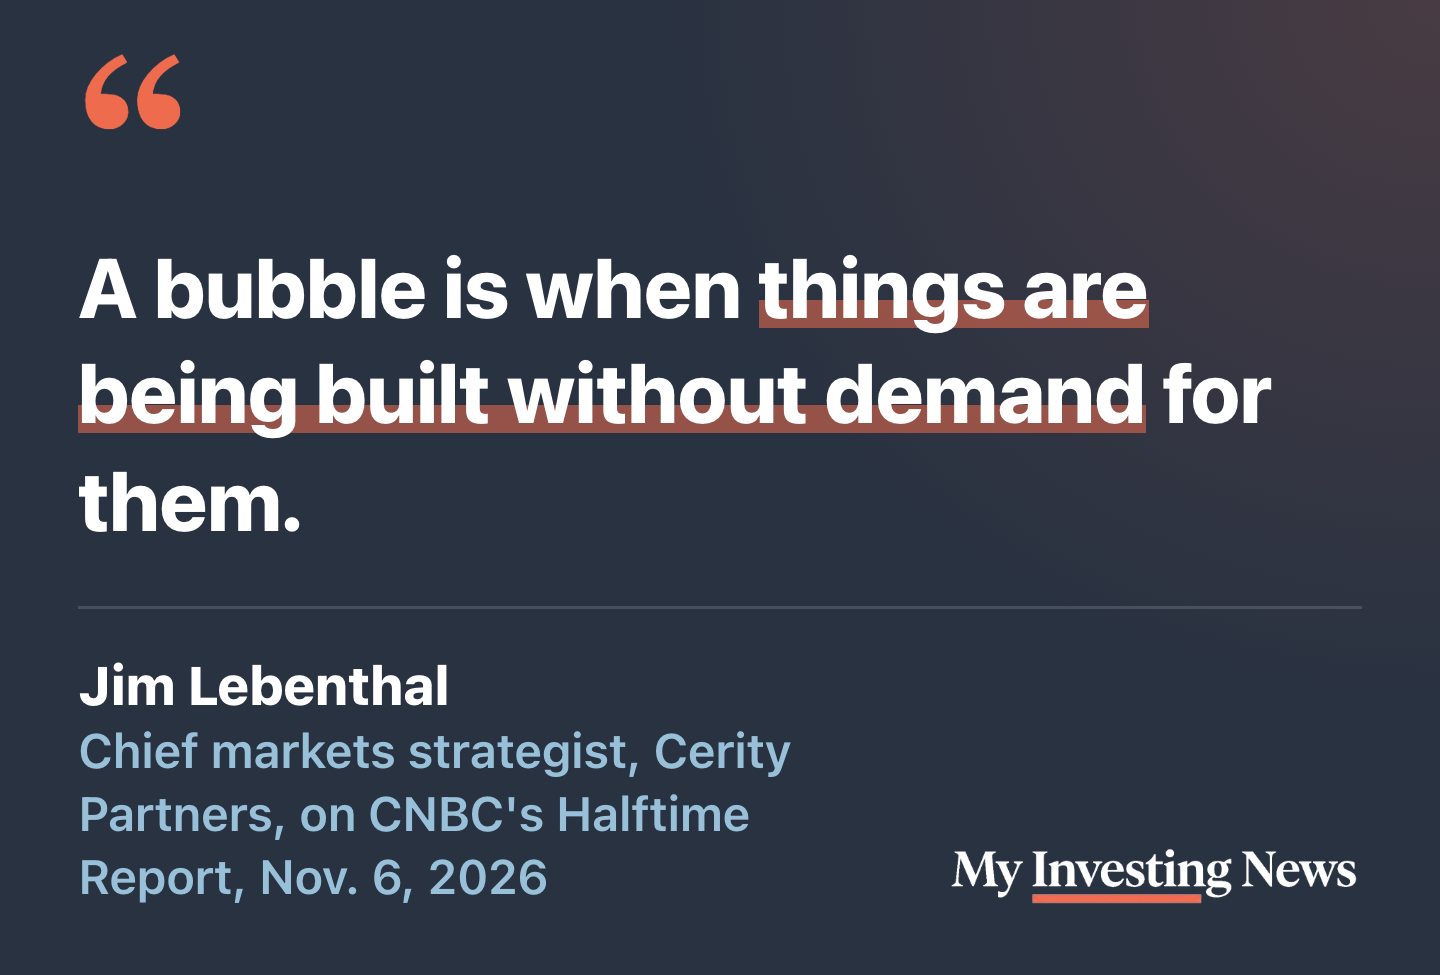
Jim Lebenthal has a one-line test for a bubble. On CNBC’s Halftime Report on Nov. 6, the day after the S&P 500 fell 4.4%, host Scott Wapner ran through data center and power stocks sitting anywhere from 30% to more than 50% below their highs. Lebenthal, chief markets strategist at Cerity Partners, had just bought one of them, Quanta Services PWR, and said the buy only works if the data center trade isn’t a bubble. Then he defined the word.
His evidence was cloud revenue. “In Google’s case 100% plus year over year,” he said, and “in Azure’s case over 40%.” Both numbers check out against the September-quarter reports. Google Cloud revenue rose 103% to $30.7 billion at Alphabet GOOGL, and Microsoft MSFT said Azure revenue grew 48%. Amazon Web Services grew 39% at Amazon AMZN. “These companies are telling us that they have more demand than they can meet with supply,” Lebenthal said.
Jenny Harrington, CEO of Gilman Hill Asset Management, took the other side on the same panel. “Maybe there’s not an AI bubble but maybe there is a data center bubble,” she said, pointing to Microchip Technology’s CEO, who she said had told analysts on the company’s earnings call that data centers are in a bubble.
Telecom Had Demand, Too
Lebenthal’s definition can be tested, because the last great build-out left a record. The comparison he reached for was the late 1990s, and in those years telecom wasn’t building into a void. Revenue for the U.S. broadcasting and telecom industry, as measured by the Bureau of Economic Analysis, grew 10.6% in 1998, 13.2% in 1999 and 11.3% in 2000. The demand was real. The question was how much the industry spent to chase it.
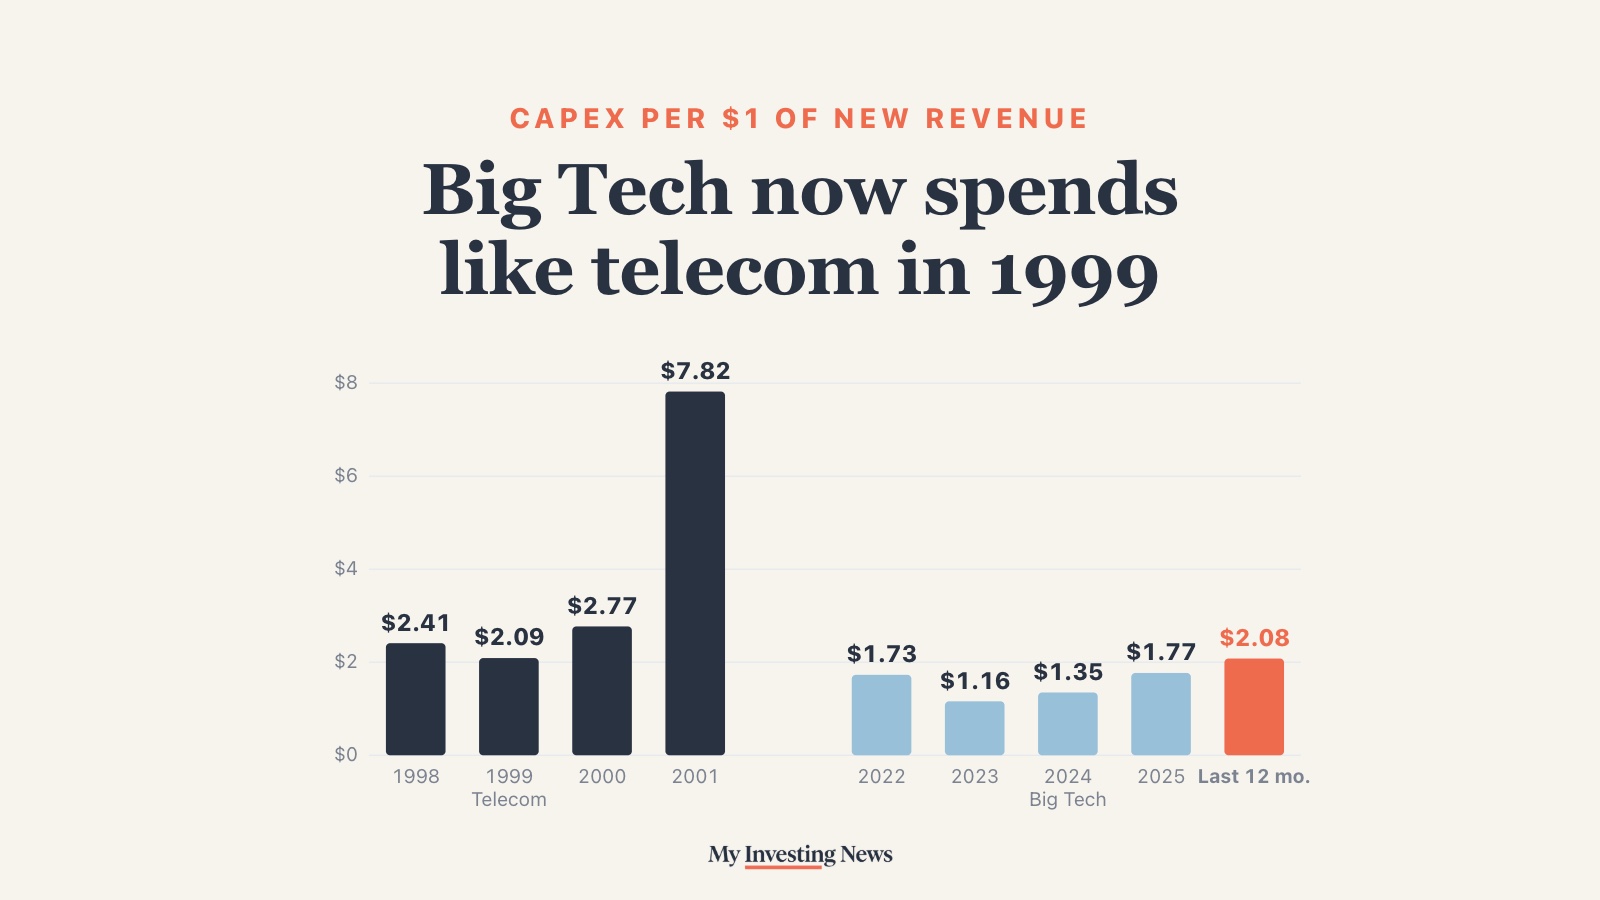
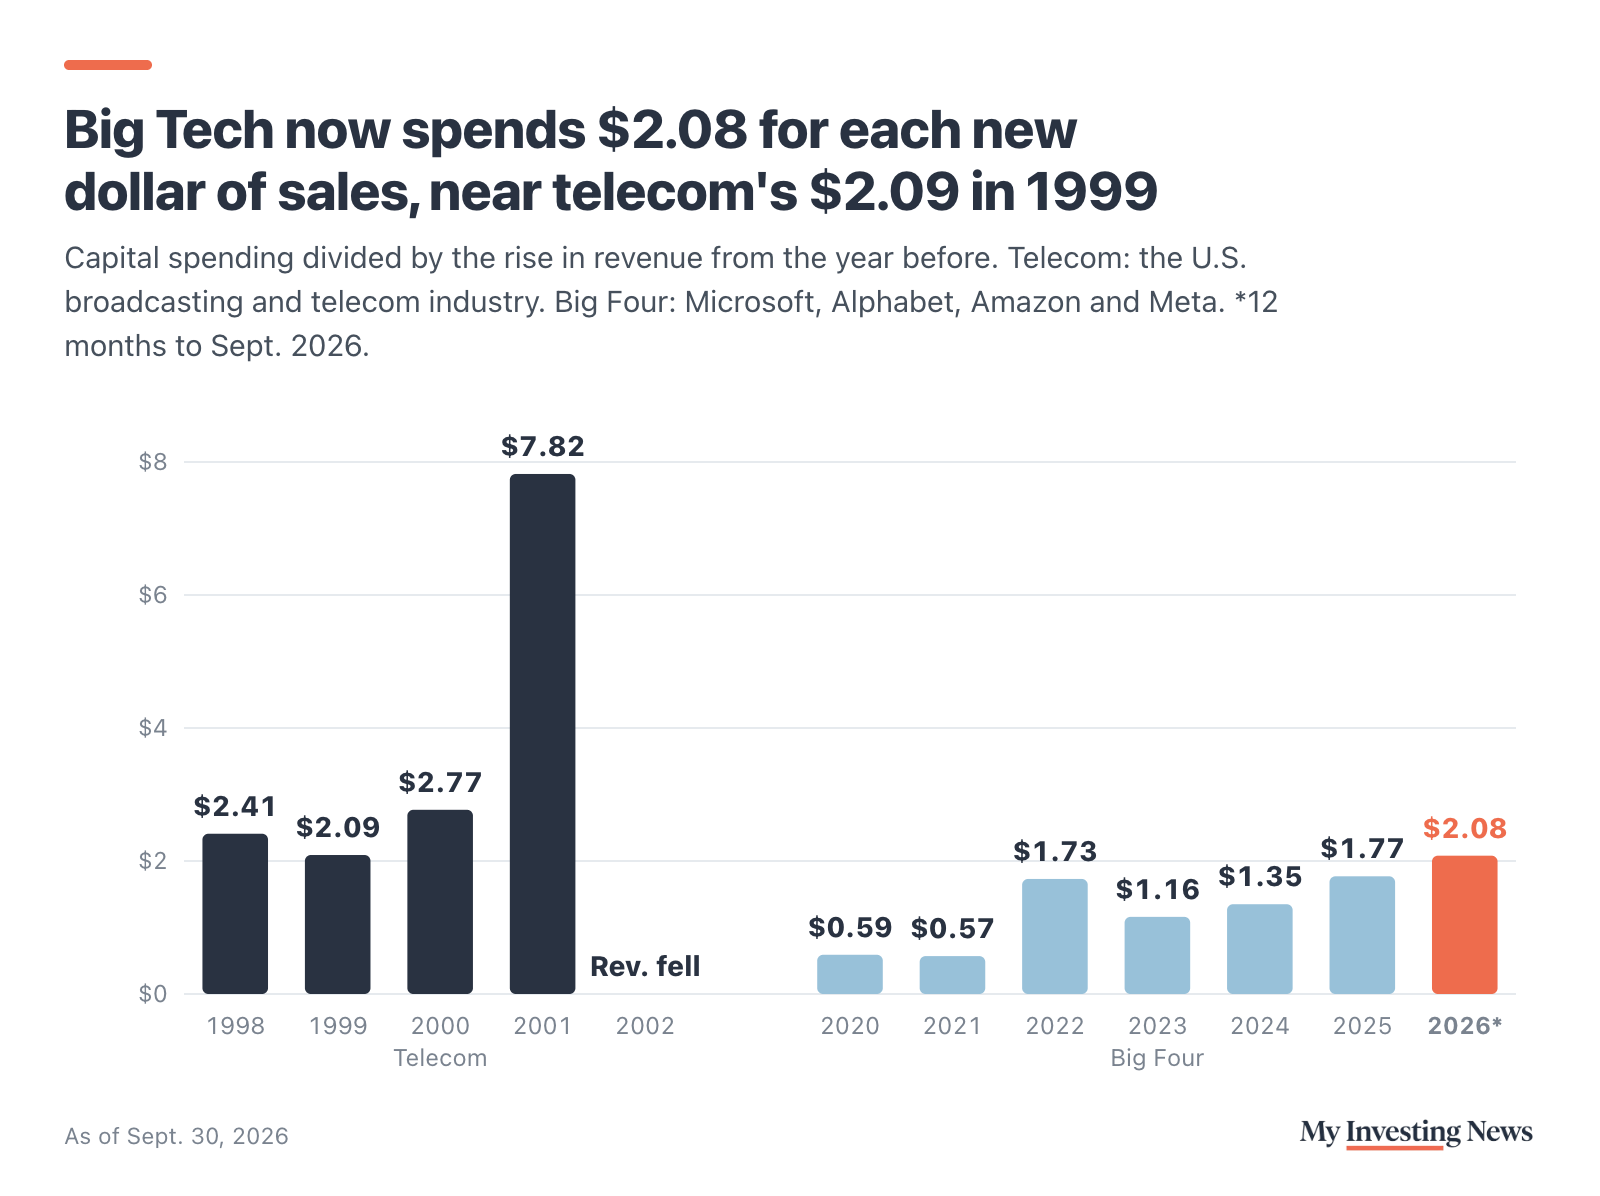
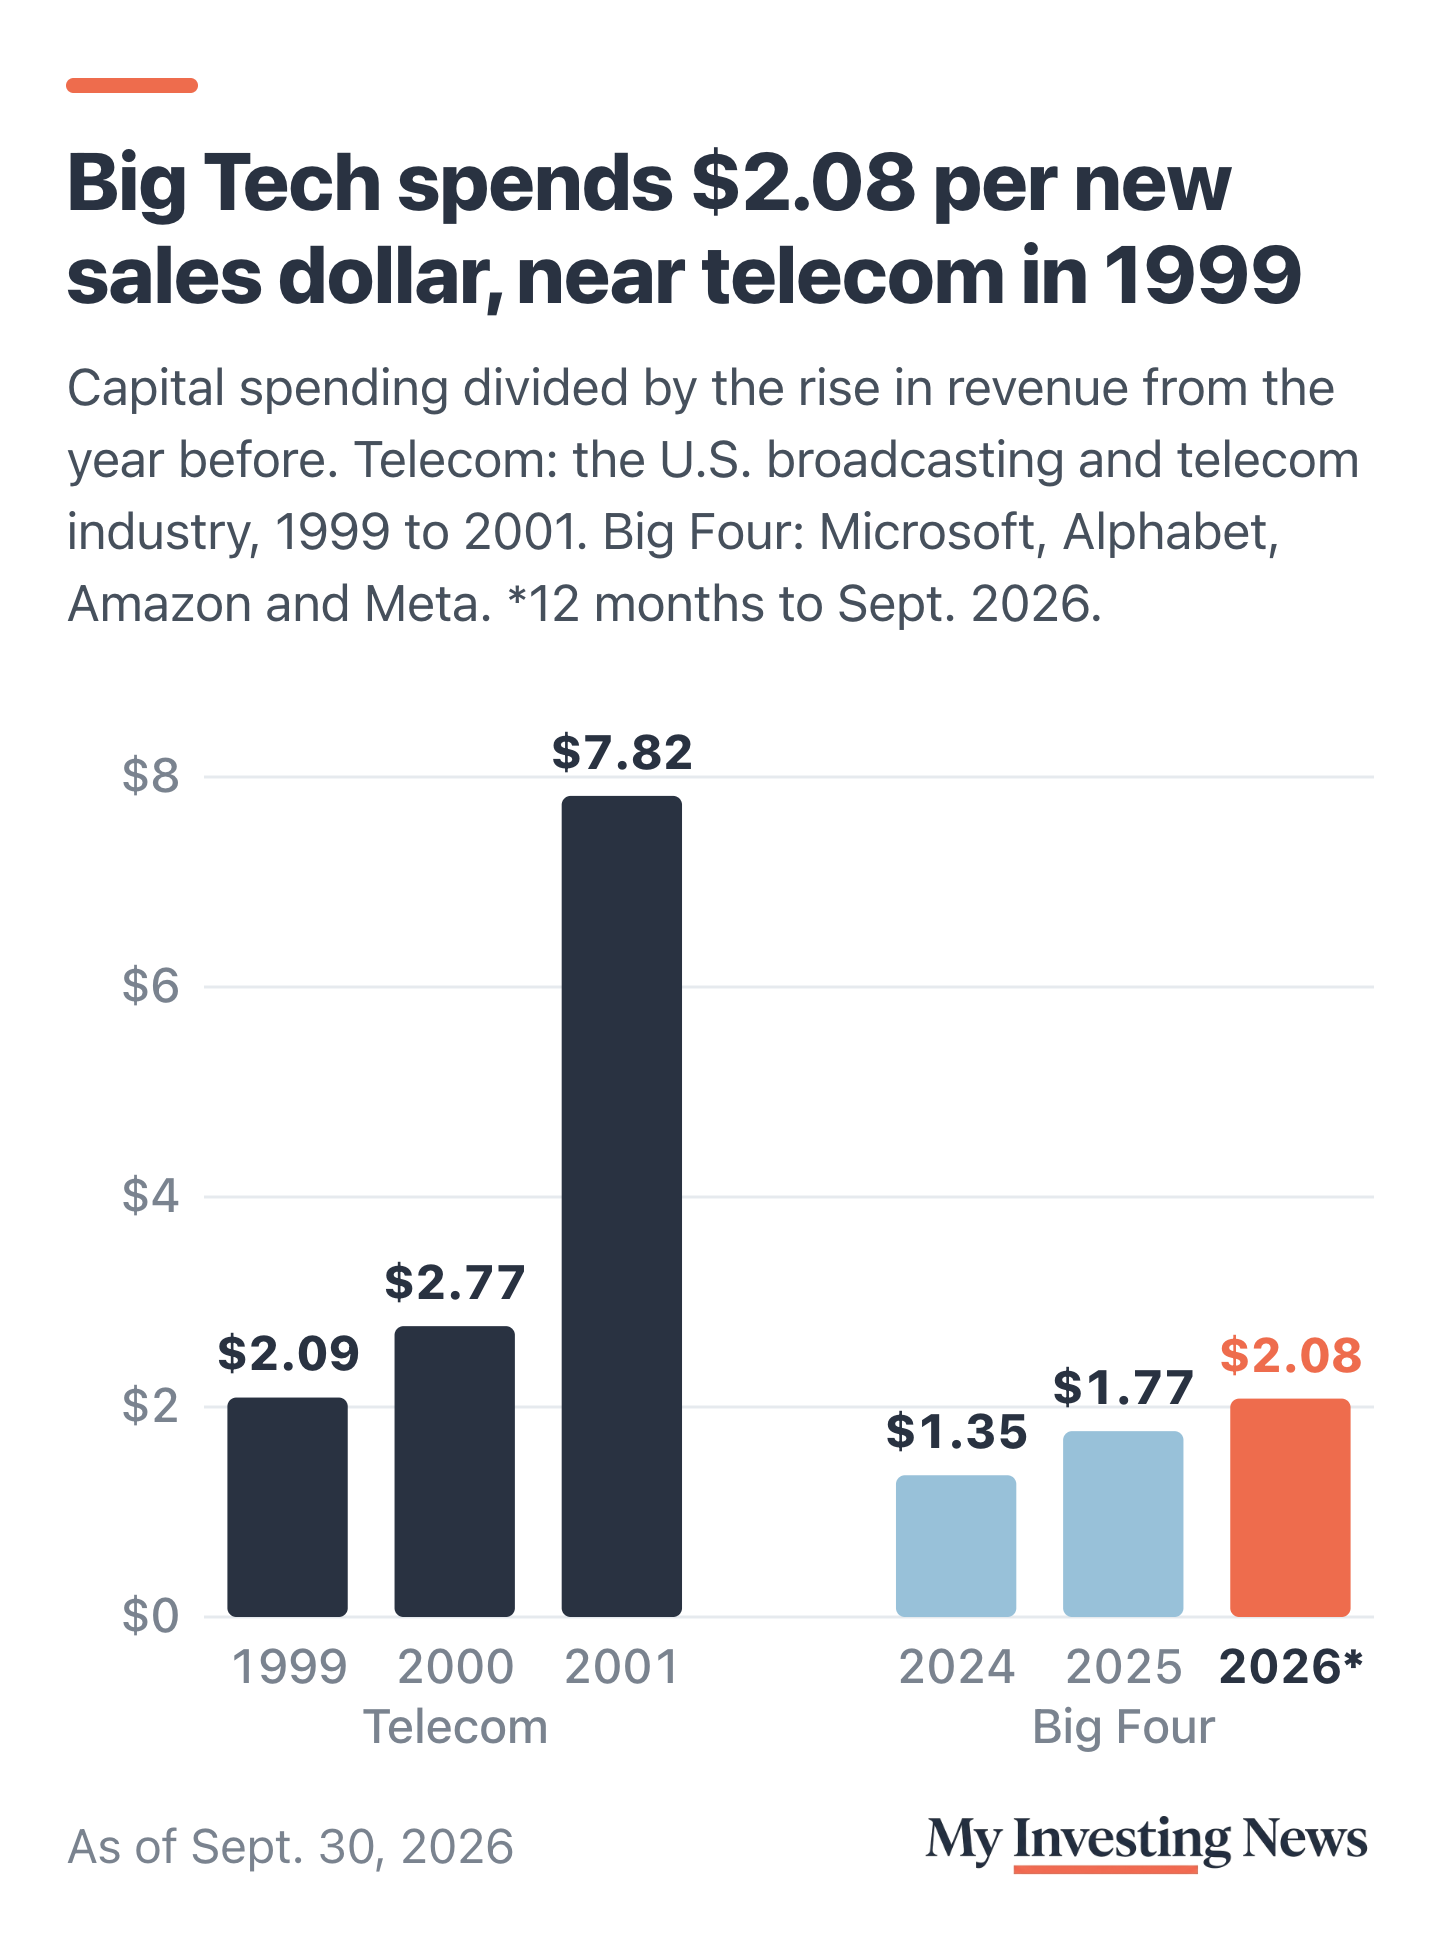
One way to measure that is capital spending for each dollar of new revenue. Telecom spent $2.41 in 1998, $2.09 in 1999 and $2.77 in 2000, when its investment peaked at $158 billion. Then revenue growth slowed to 3.2% in 2001 and the ratio jumped to $7.82. In 2002 revenue fell, and investment was 37% below its 2000 level.
Where Big Tech Sits Now
Run the same math on the four biggest spenders, Microsoft, Alphabet, Amazon and Meta Platforms META. In the 12 months through September, their cash spending on property and equipment came to $615 billion. Their combined revenue rose $297 billion, or 19%, from the 12 months before. That is $2.08 of capex for each new dollar of revenue, inside telecom’s 1998 to 2000 range and up from $1.16 in 2023 and $0.57 in 2021.
The September quarter alone carried $202 billion of that spending. The comparison isn’t exact: the companies sell ads, software and retail as well as cloud, and the telecom figures cover a whole industry. Still, the test Lebenthal set is about demand, and on this measure the four now buy about as much build-out per dollar of growth as telecom did at its height.
The build-out, then and now
The 90% Figure
Lebenthal’s sharpest contrast with 2000 was the fiber. “The fiber optic networks that were laid in the ground all over these cities were 90% unused,” he said. “That’s the exact opposite of what we have now.” If anything, 90% understates it. A June 2002 FDIC report on the telecom sector put it this way: “Only about 2 to 5 percent of the fiber optic cable in the U.S. are actually lit.”
The same report explains why that number overstates the waste. Putting cable in the ground was about 5% of the total cost of lighting it, so carriers laid extra on purpose. The costly part was the equipment, and that spending stopped when growth slowed. Much of the spare glass was used later, and fiber laid in the dot-com era still works today. A data center budget is mostly the costly part: chips, power gear and buildings.
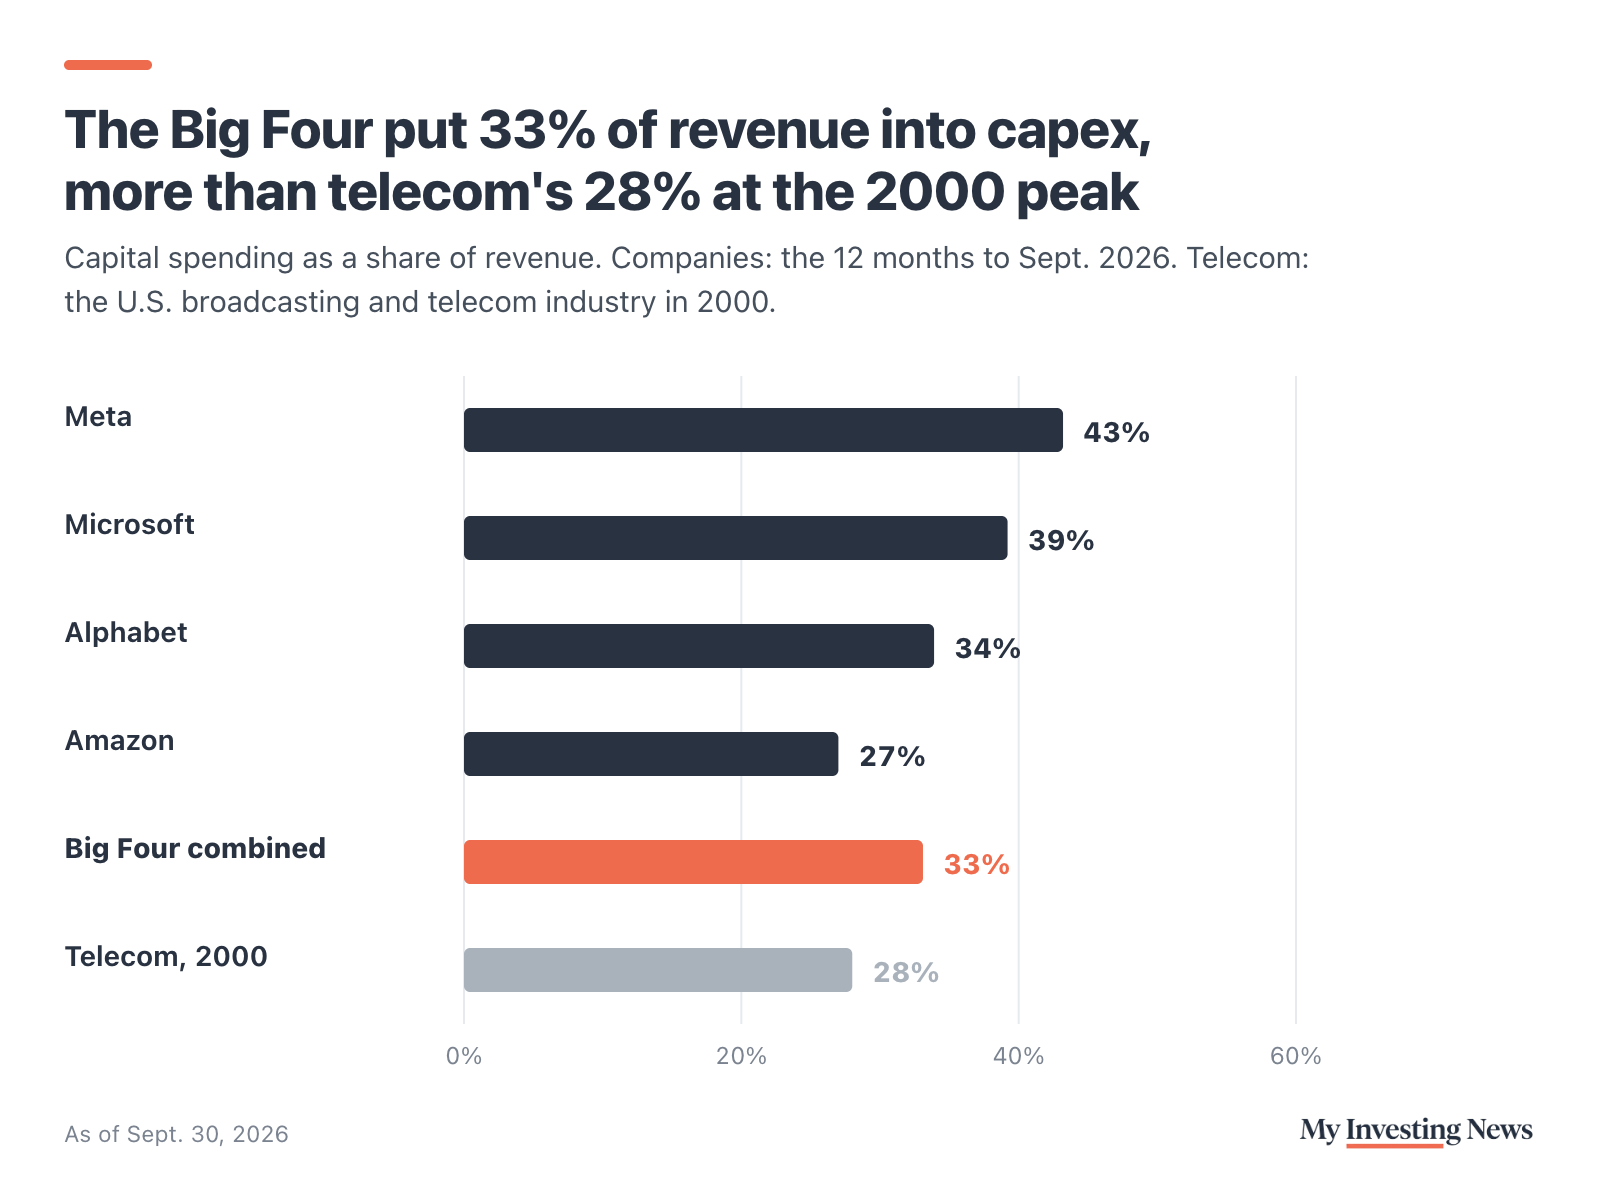
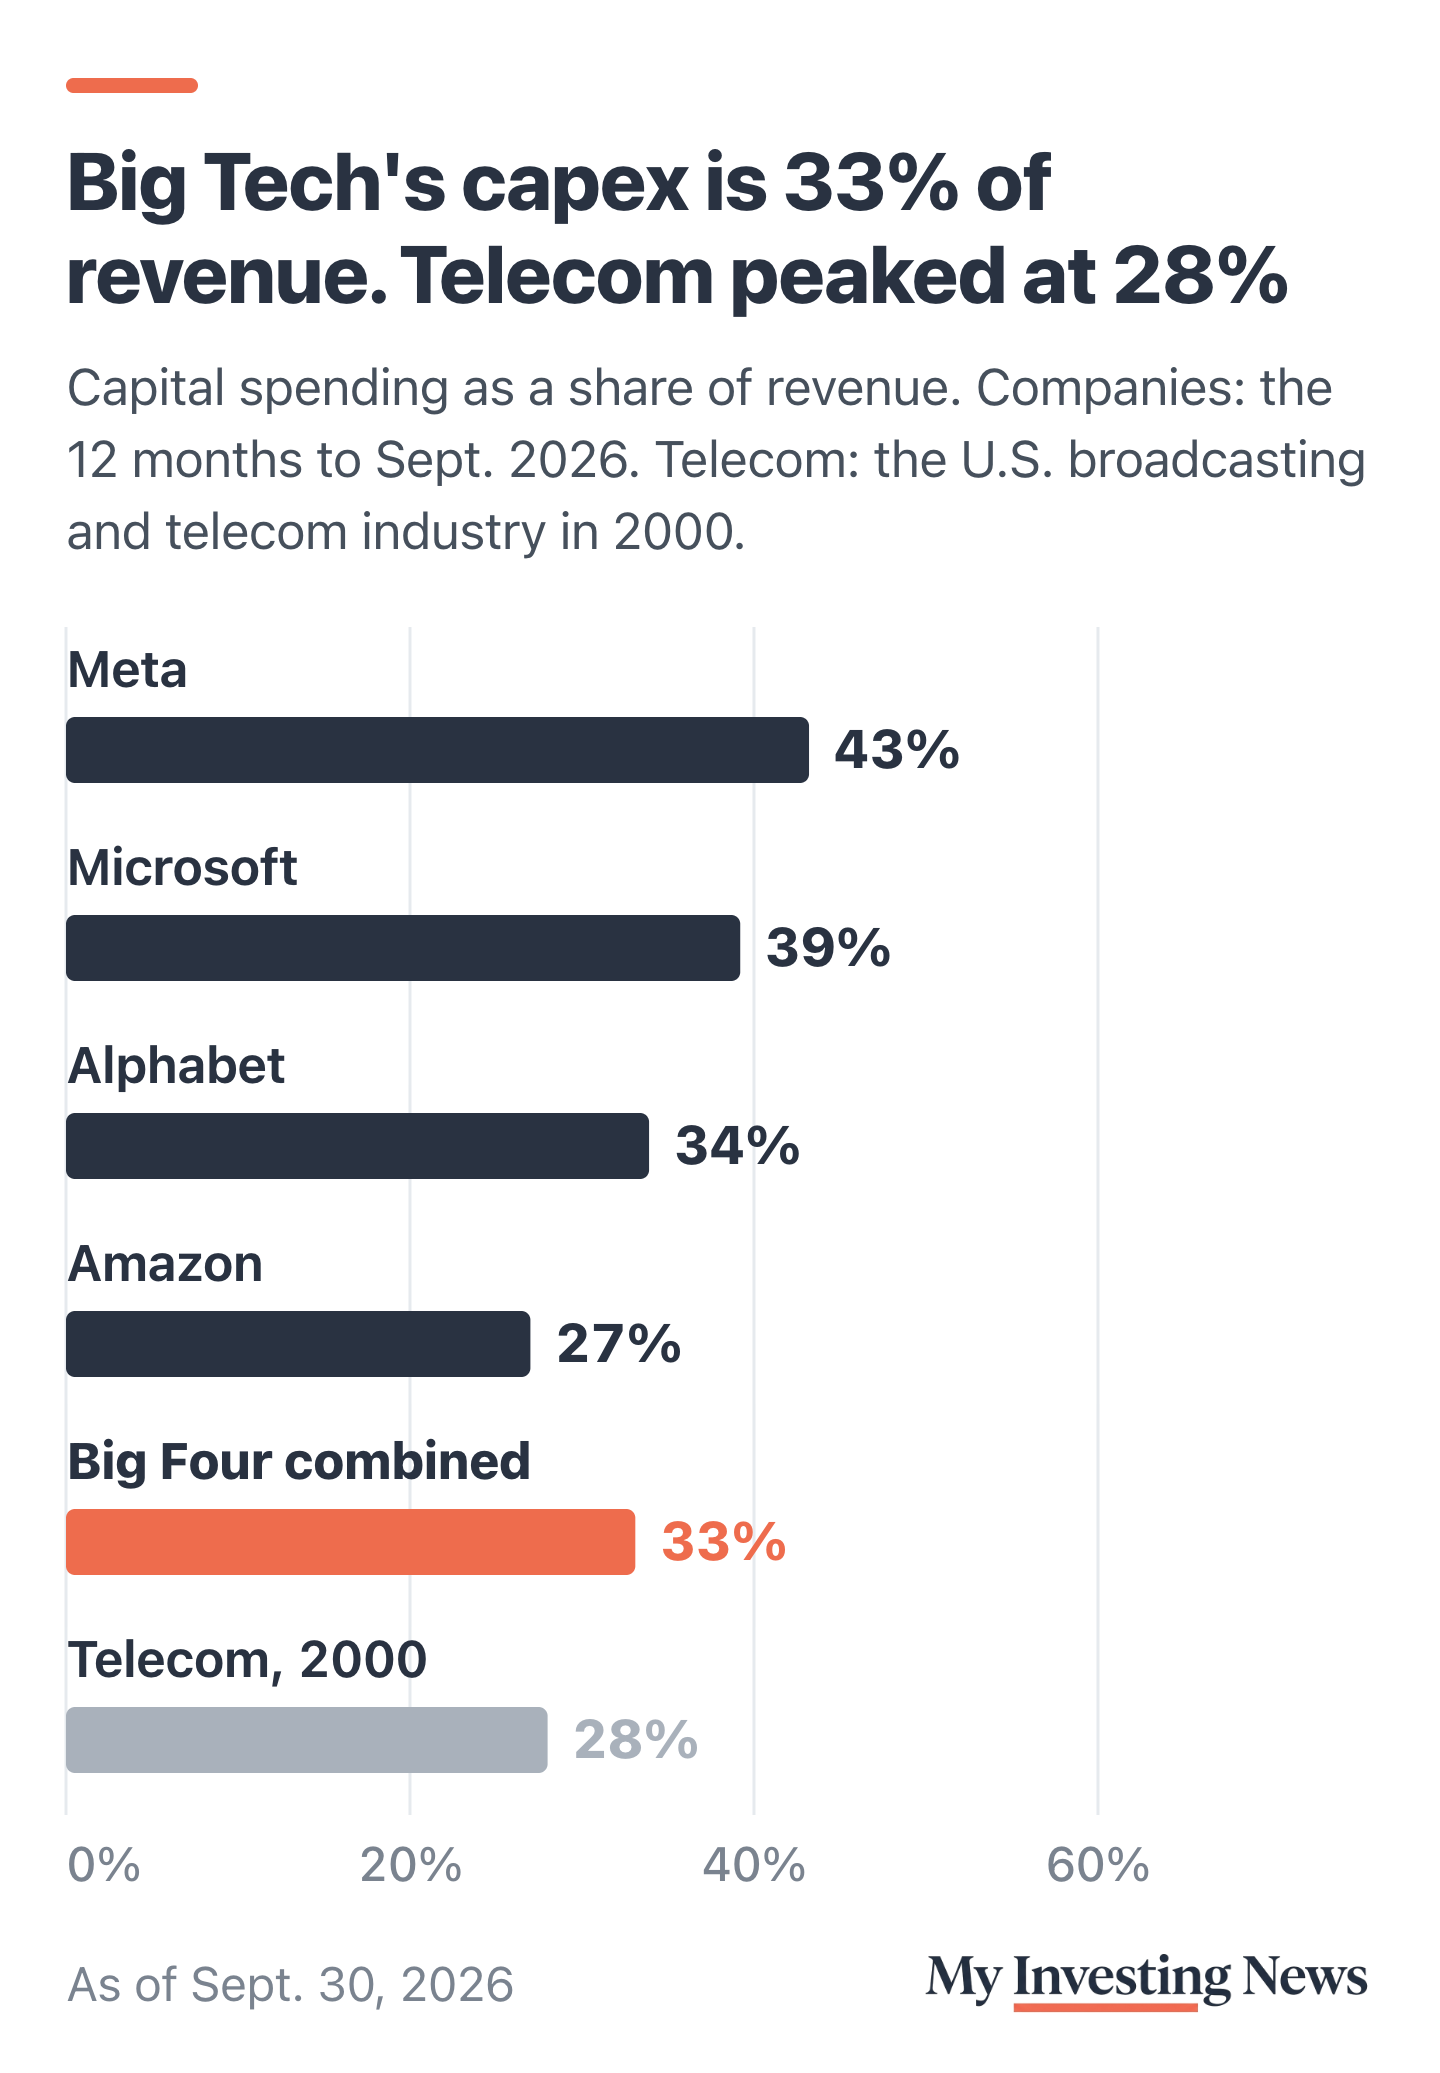
Measured against revenue, the four already spend more than telecom did at its peak: 33% of revenue over the past year, against 28% for the telecom industry in 2000. Meta is highest at 43%, and Amazon, with its big retail business, is lowest at 27%.
What to Watch
Telecom’s ratio jumped in 2001 when revenue growth fell from about 11% to 3% in a single year, with the spending already committed. The four companies grew revenue 19% over the past year, and their next reports, for the December quarter, are the next check on whether demand keeps pace with the spending. Where that demand comes from matters too: Chamath Palihapitiya has said 1% of companies drive 90% of AI spending.
Lebenthal didn’t rule a bubble out. Pressed by Wapner, he said “it is probable, based on human history, that a bubble eventually forms, gets highly inflated and pops,” and added that “a Democratic-led slowdown of this buildout might actually be welcome.” Democrats won control of both the House and the Senate in the Nov. 3 elections.
Lebenthal is right that the demand is real and that his fiber figure, if anything, was low. But telecom had real demand in 2000 too. The Big Four now spend $2.08 for each new dollar of revenue, in telecom’s 1998 to 2000 range, and the risk is the one telecom hit in 2001: growth that slows while the spending is already committed.