Where we heard itThe Pomp Podcast, “Everyone Is Bearish And That’s Exactly Why You Should Buy,” Oct. 27, 2026. Speaker: Ryan Detrick, chief market strategist at Carson Group.
Ryan Detrick closed his Oct. 27 interview with Anthony Pompliano on The Pomp Podcast with a statistic. When the S&P 500 has “a 10% jump in the second quarter,” the Carson Group strategist said, the fourth quarter has “never been lower.” He put the record at “nine out of nine.”
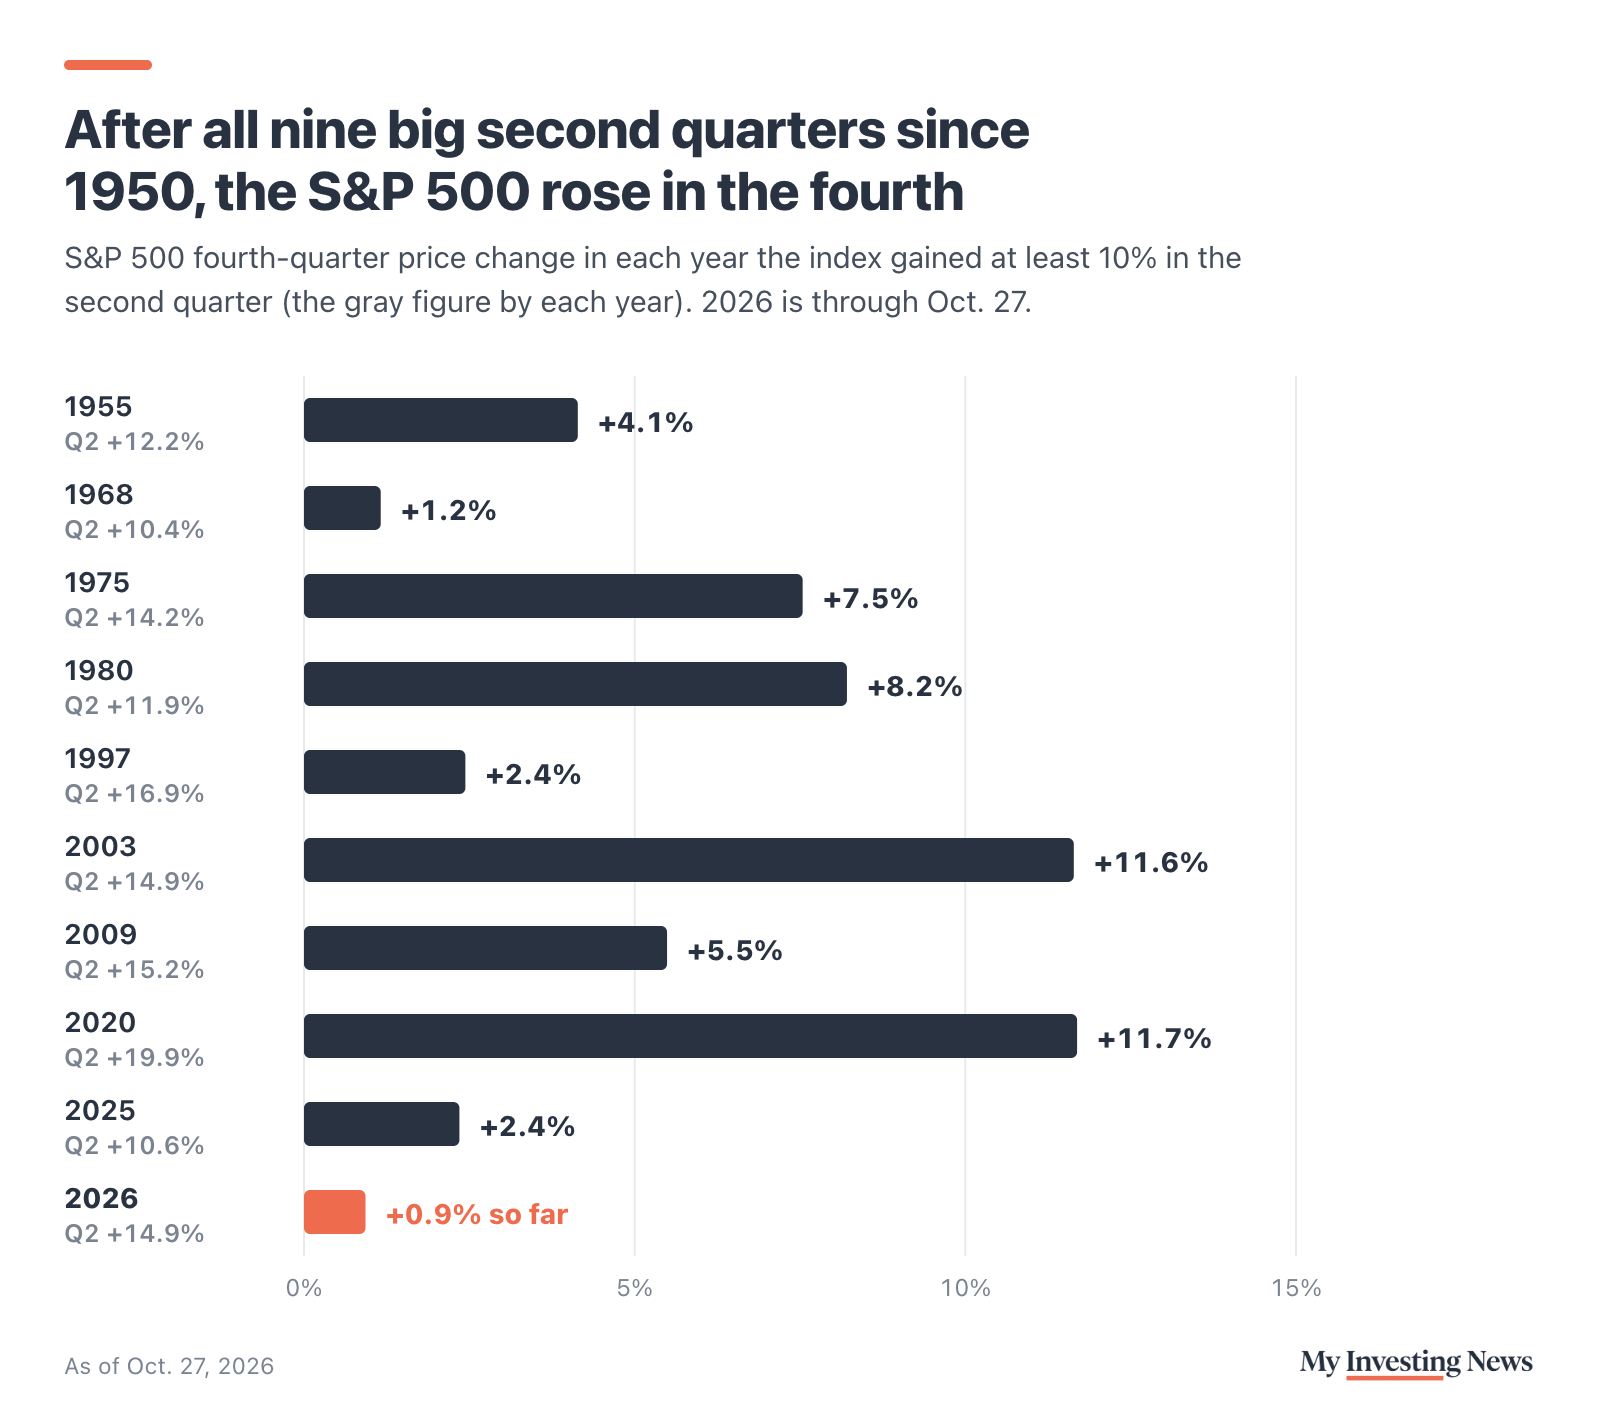
This year qualifies. The index rose 14.9% from March 31 to June 30, its best second quarter since 2020. But the fourth quarter has started slowly: the S&P 500 was up 0.9% from its Sept. 30 close through the Oct. 27 close. We checked the claim against daily index closes back to 1950, and then further back.
Every Case Since 1950
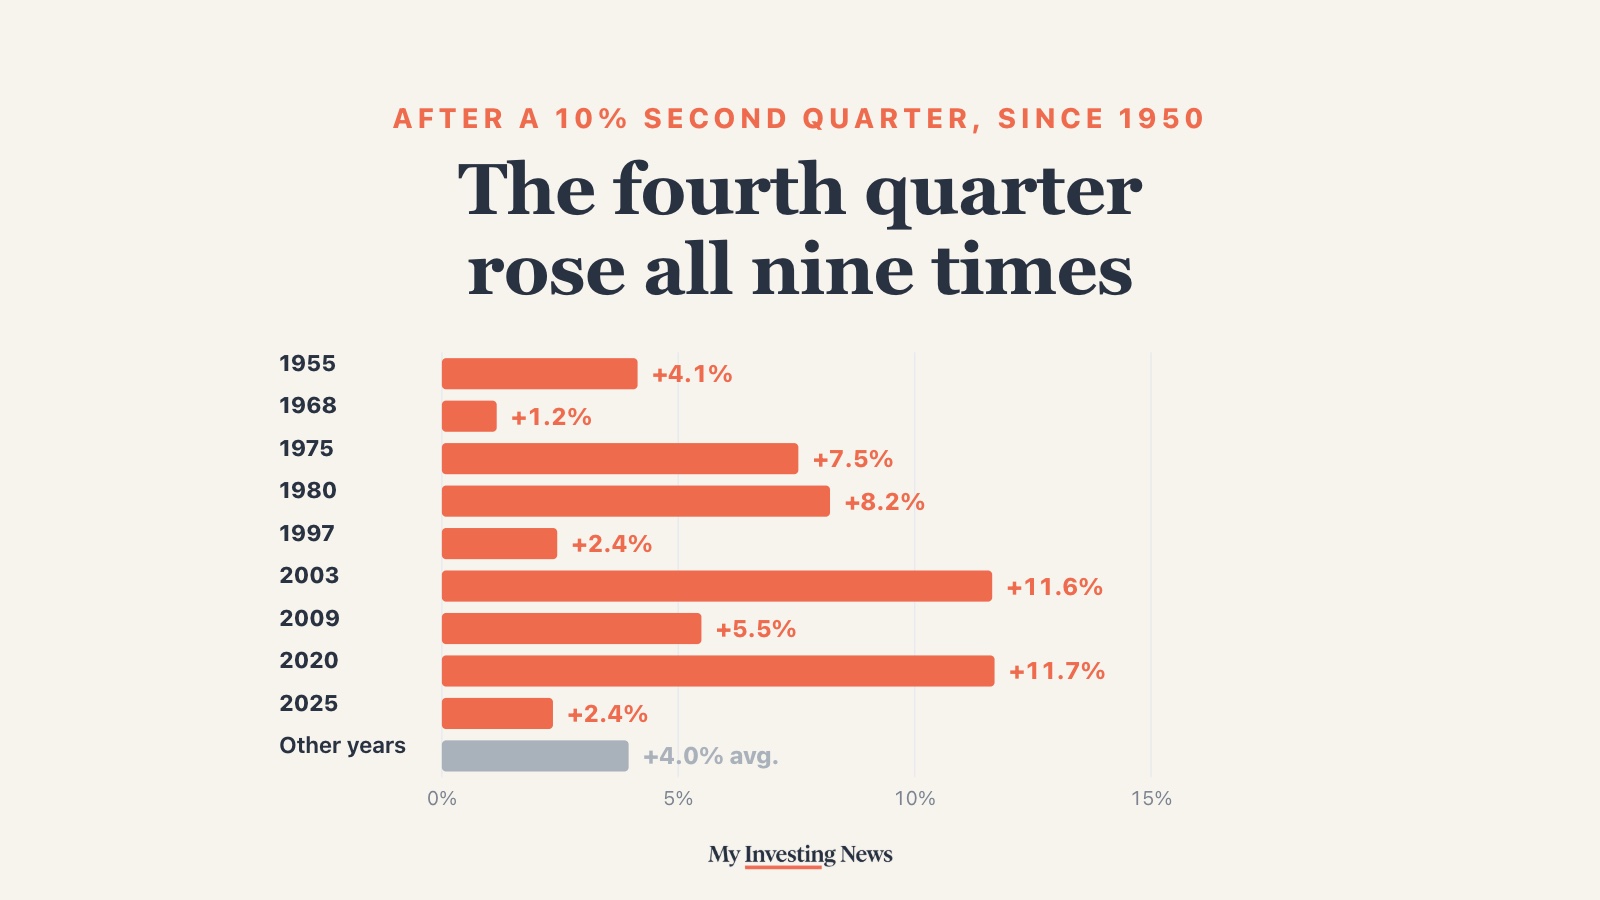
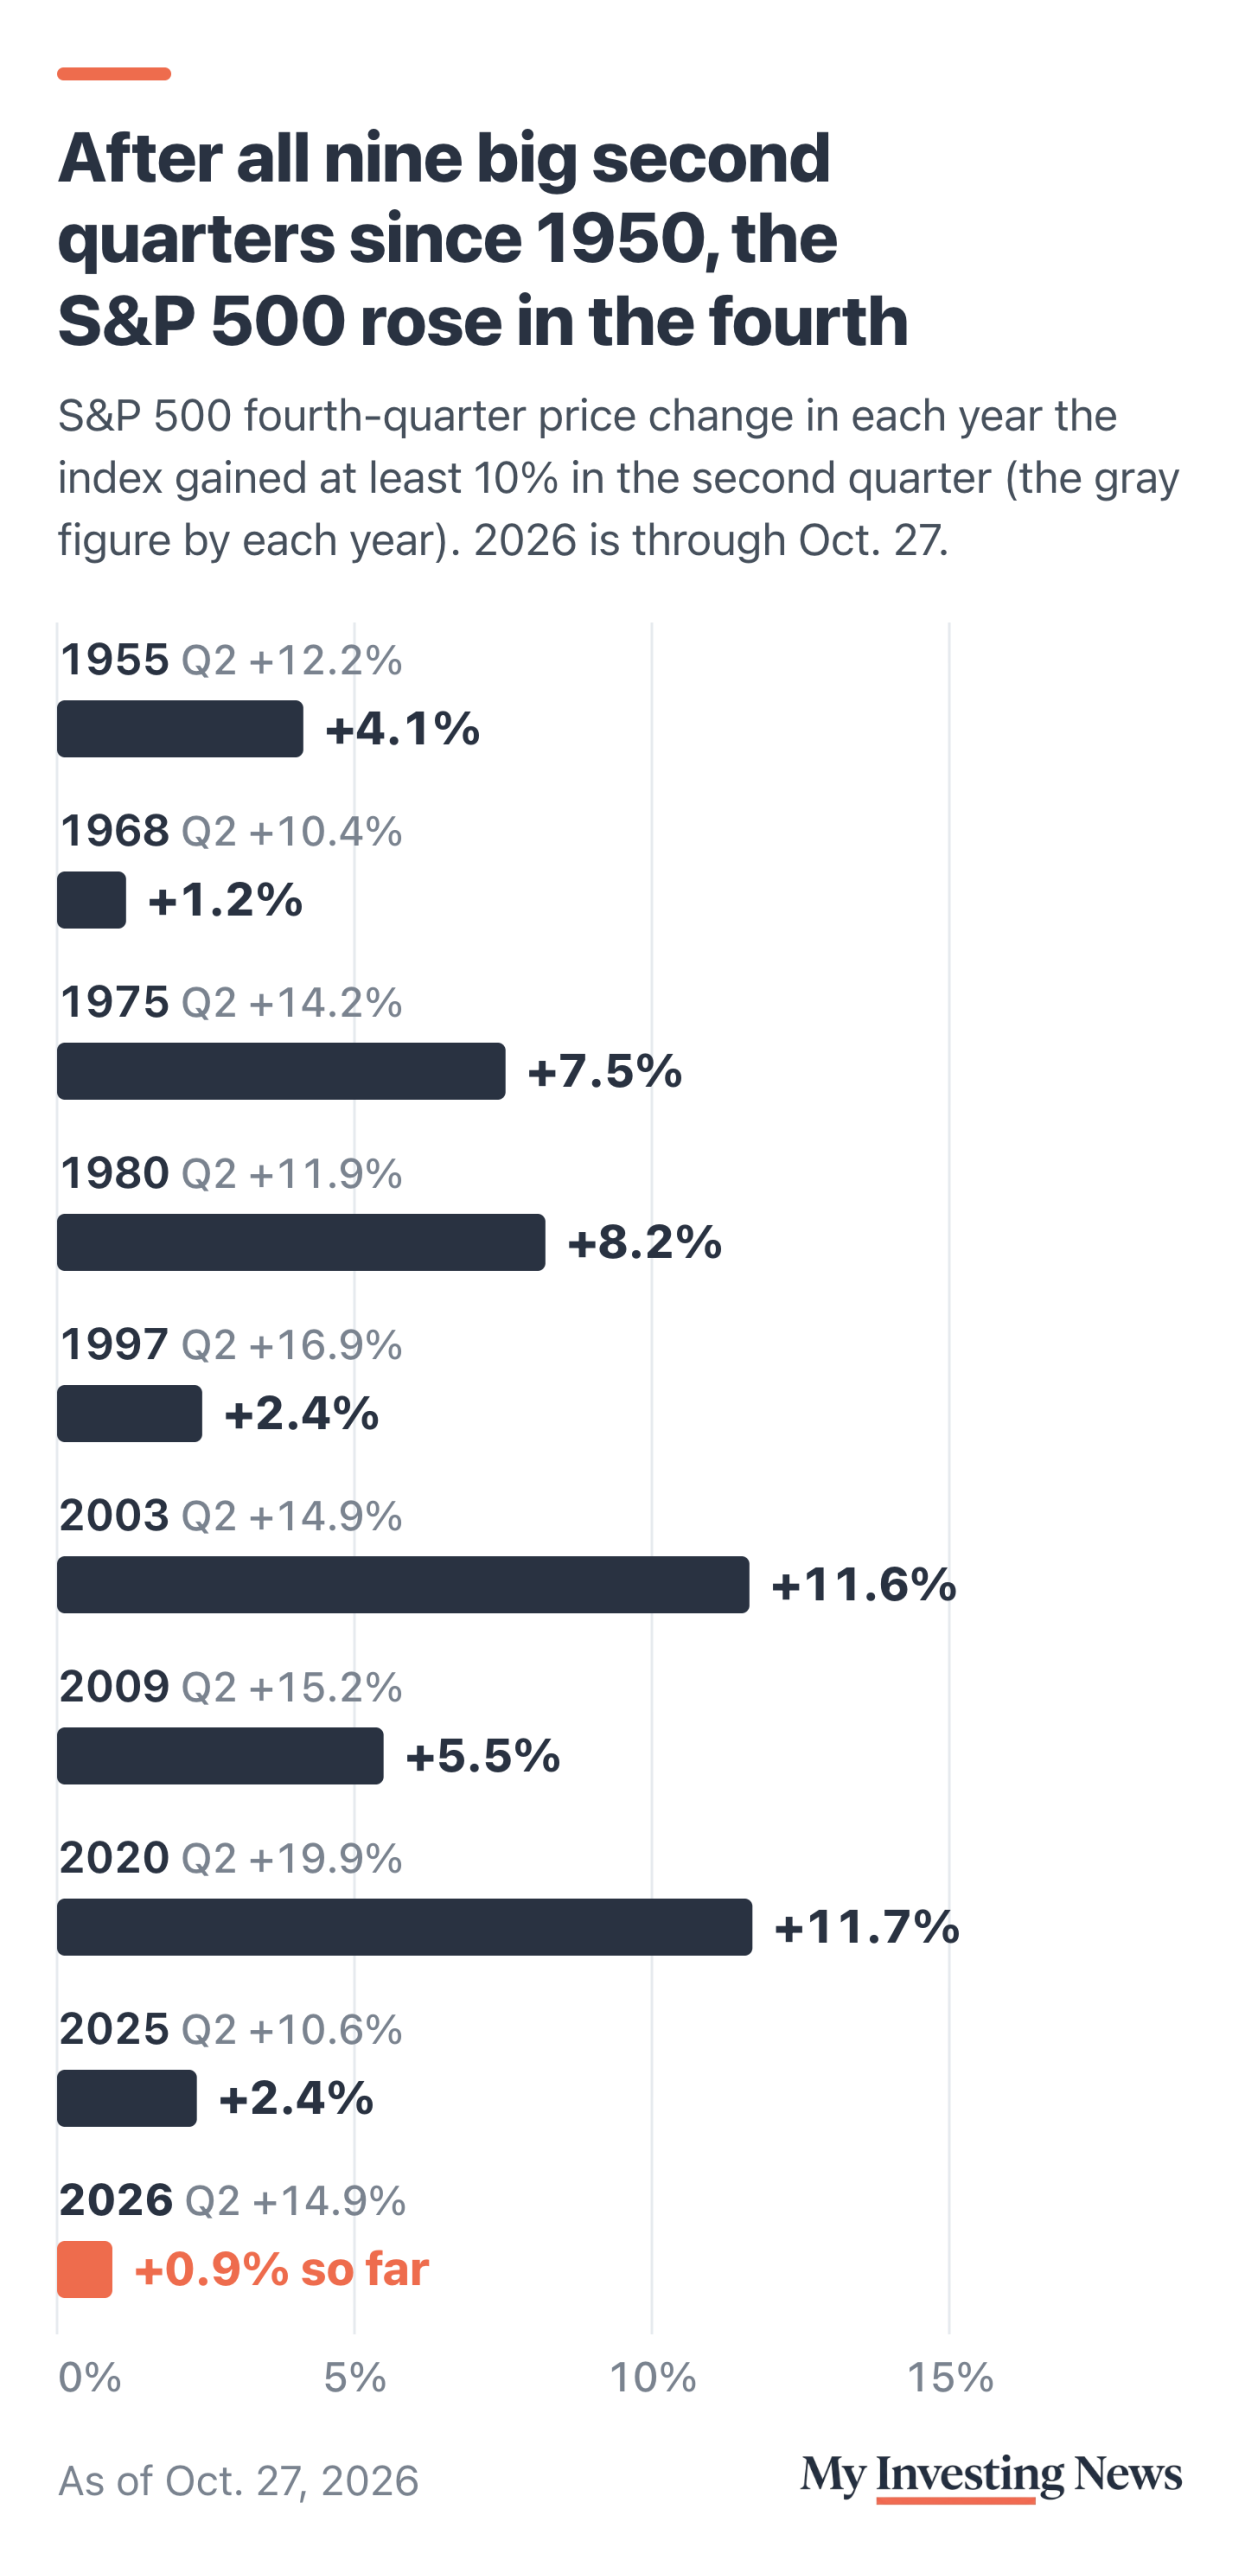
From 1950 through 2025, the S&P 500 gained at least 10% in the second quarter in nine years: 1955, 1968, 1975, 1980, 1997, 2003, 2009, 2020 and 2025. The index rose in the fourth quarter of all nine. Detrick’s count is exact.
The gains were not all large. The smallest came in 1968, when the index added 1.2% in the last three months of the year. The biggest were 11.7% in 2020 and 11.6% in 2003. Last year, after a 10.6% second quarter, the fourth quarter added 2.4%.
How Unusual Is Nine for Nine?
Less unusual than it sounds. The fourth quarter is usually a good one. Since 1950, the S&P 500 has risen in 61 of 76 fourth quarters, or 80% of the time. If each year were a coin weighted to come up heads 80% of the time, nine heads in a row would happen about 14% of the time by chance alone.
Where the big-spring years stand out is size. Their fourth quarters averaged a 6.1% gain, against 4.0% in every other year since 1950. Nine years is a small sample, so one bad quarter would change that math quickly.
The 10% line also matters. In 1983, the index gained 9.6% in the second quarter, just short of the cutoff, and then slipped 0.7% in the fourth. Go back before 1950, using S&P’s earlier composite index, and the streak breaks once. In 1948, an 11.0% second-quarter gain was followed by a 1.9% fourth-quarter drop, the stretch that included Harry Truman’s upset election win. Counting from 1928, big second quarters were followed by fourth-quarter gains 12 times out of 13.
Fourth quarters after a 10% second quarter, since 1950
His Other Numbers Hold Up Too
Detrick added that the fourth quarter has been higher in 12 of the past 13 years. Our count from 2013 through 2025 matches: the only loss was 2018, when the index fell 14.0% in the fourth quarter. He also said the index was “virtually flat” for the quarter as they spoke. Through Oct. 27 it was up 0.9%.
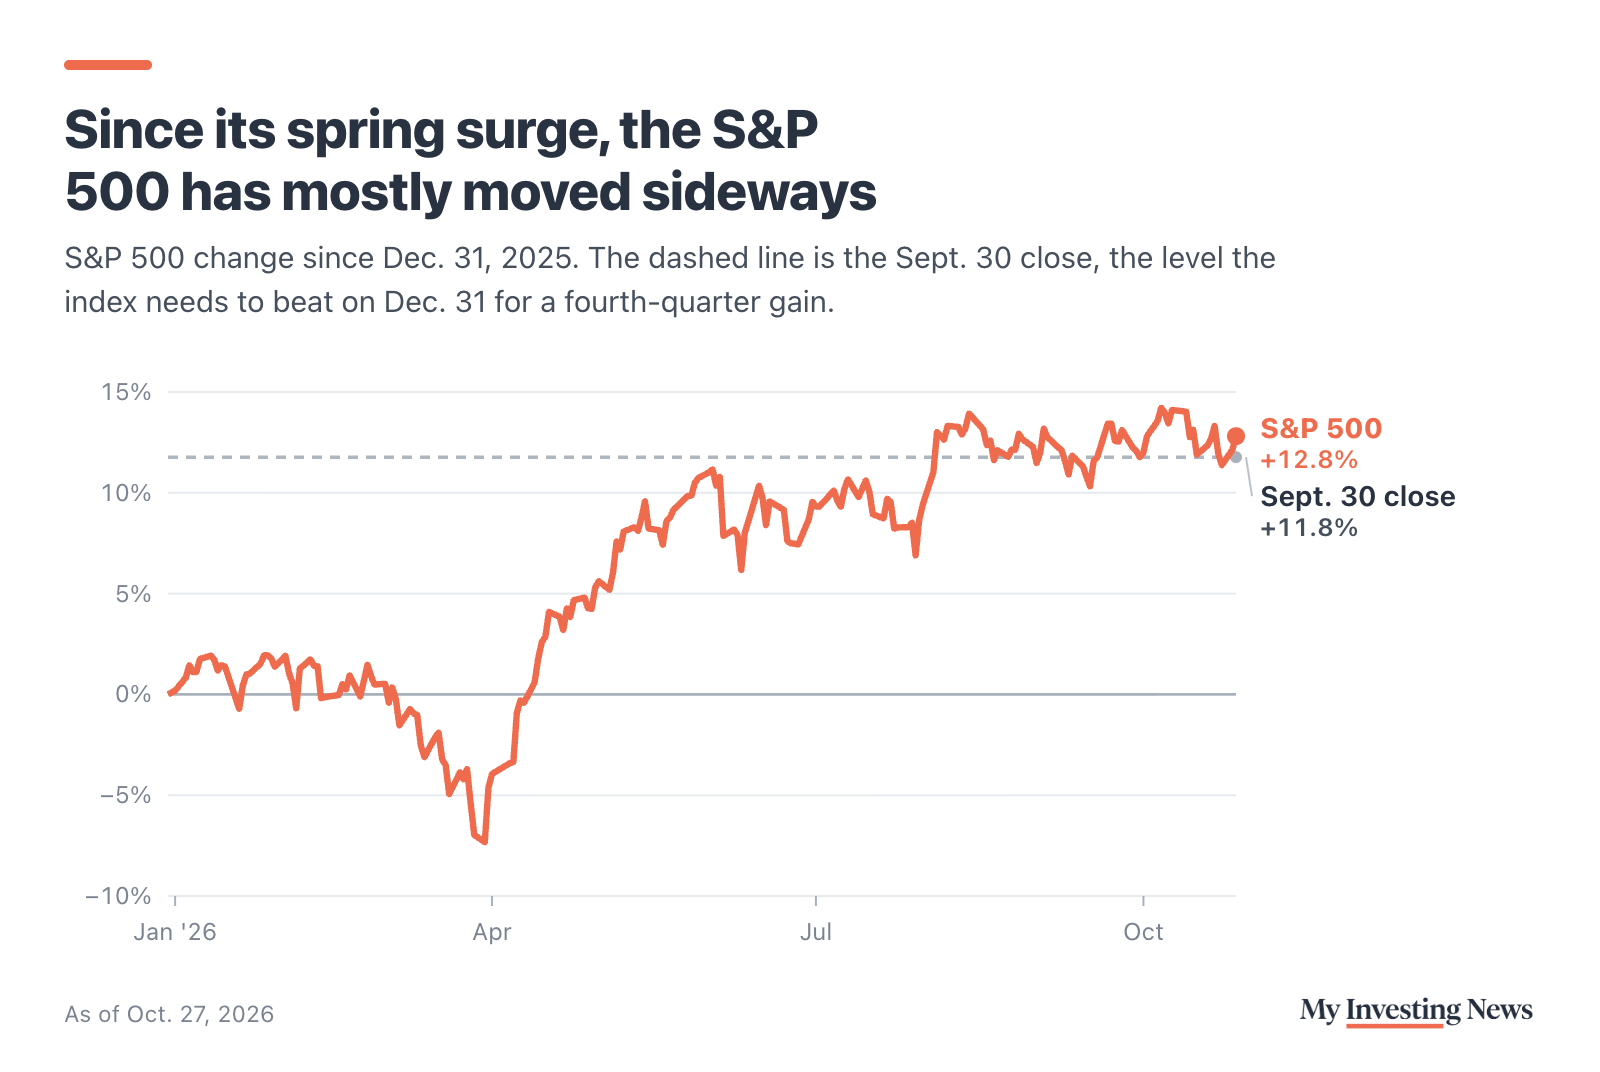
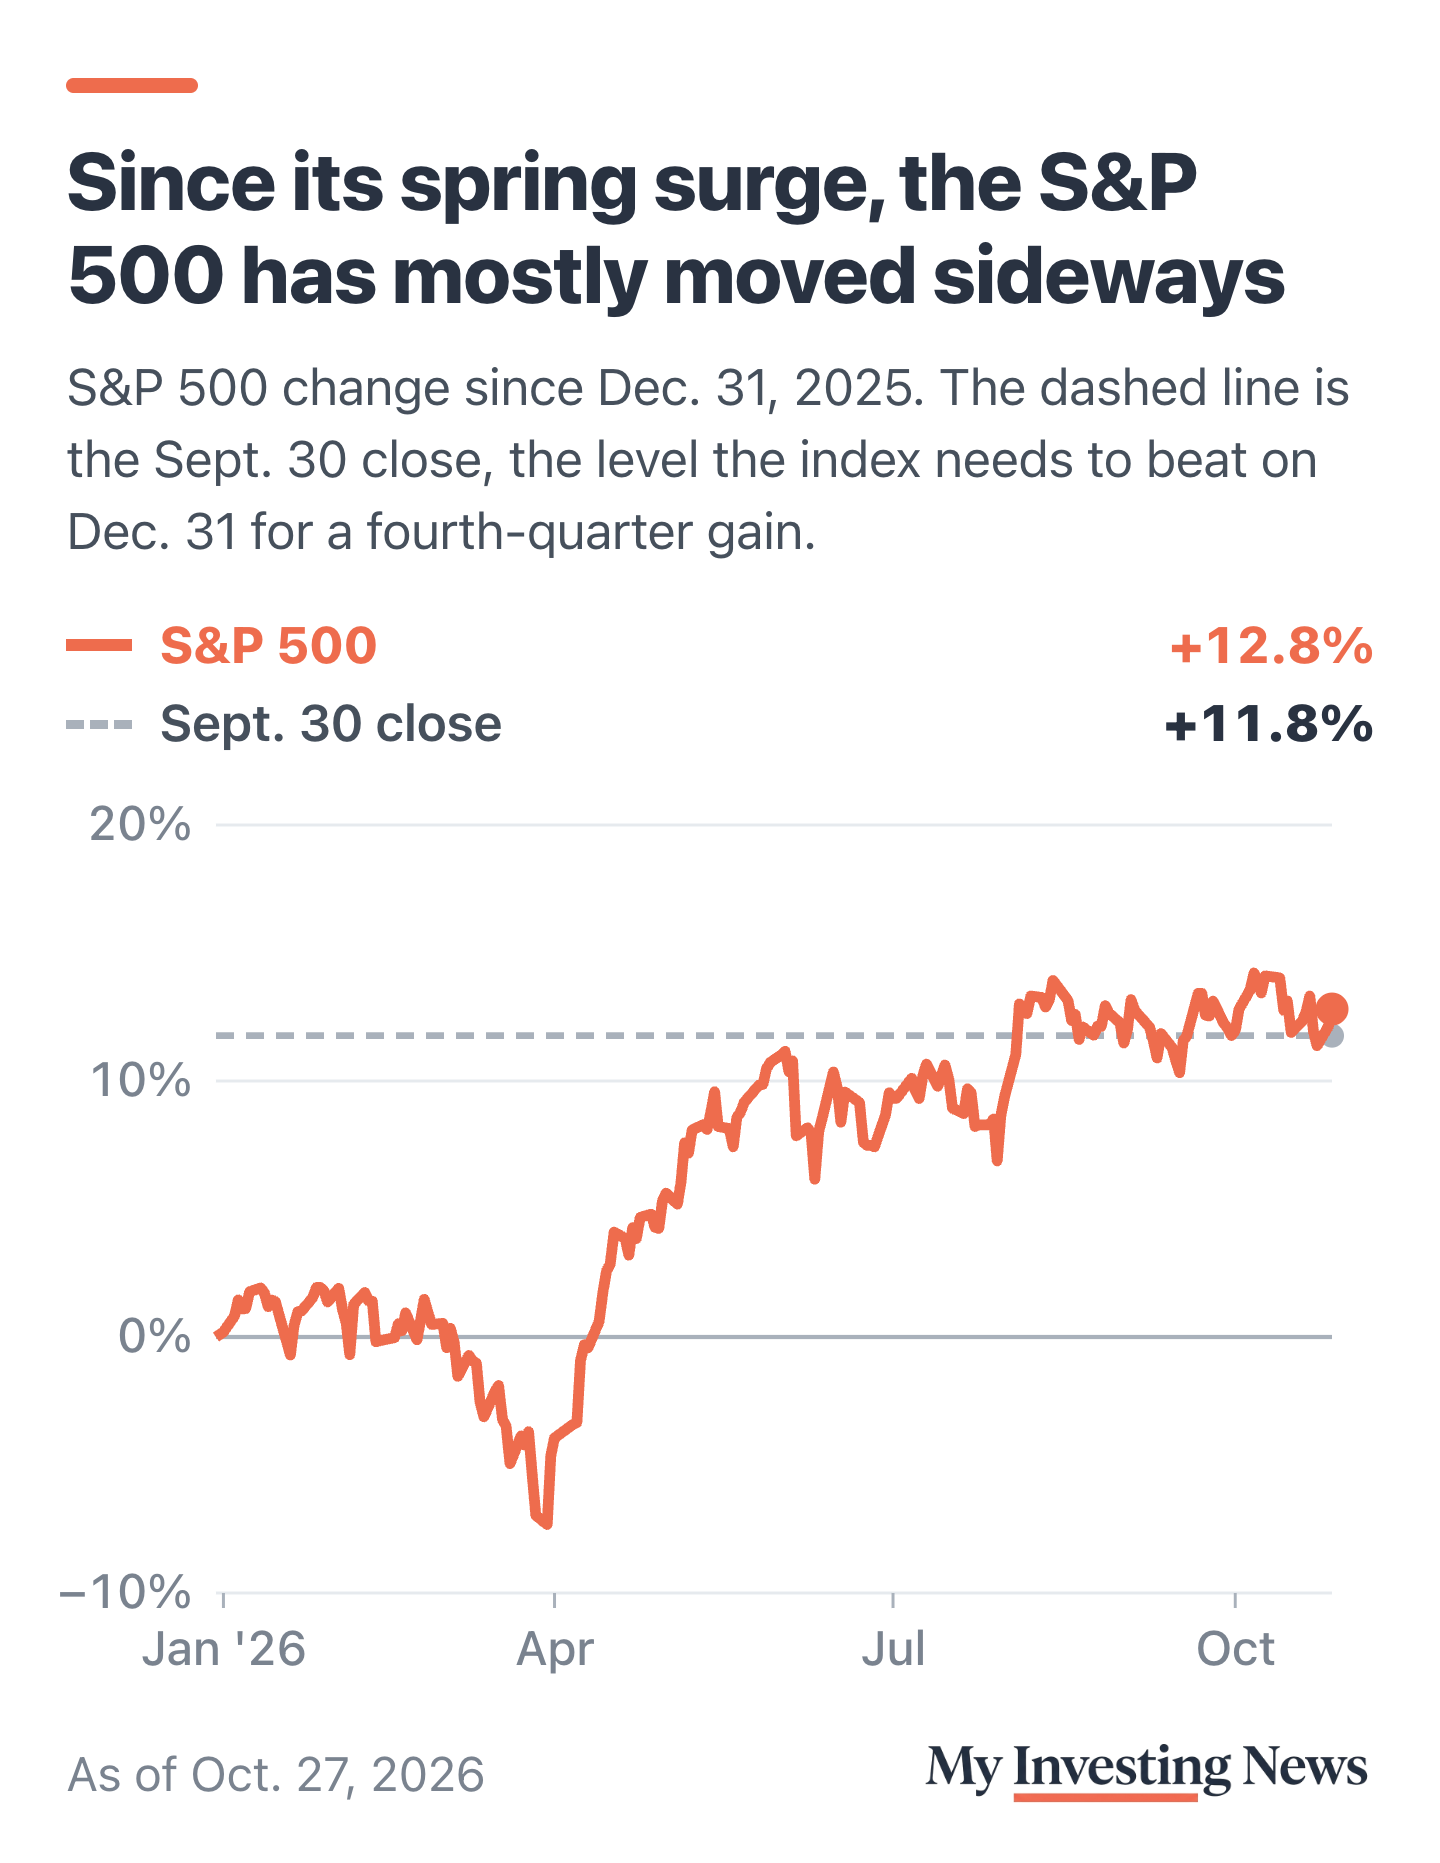
Earlier in the episode, he described “a 15% rally in April and May” followed by about five months of going nowhere. From the March 31 close to the May 29 close, the S&P 500 rose 16.1%. Since then it has gained 1.9%, trading between 7,266.99 on June 10 and a record close of 7,818.93 on Oct. 6.
What to Watch Into Dec. 31
The test this year is simple. The S&P 500 closed at 7,651.54 on Sept. 30 and at 7,722.60 on Oct. 27. To keep Detrick’s streak alive, it has to finish the year above 7,651.54. A drop of about 0.9% from the Oct. 27 close would put the quarter in the red.
The calendar adds a second test. 2026 is a midterm election year, and the last two months of the year have been the bumpiest stretch of past midterm years. Detrick has stayed upbeat through the fall: on Oct. 16, he called the rotation out of tech healthy.
Detrick’s nine-for-nine record is accurate for every year since 1950, and those fourth quarters were stronger than average. The streak is less rare than it sounds, since most fourth quarters rise anyway, and it broke once in 1948. This year’s fourth quarter is up 0.9% so far, a small cushion for the next two months.