Where we heard itPosts on X by Thierry Borgeat, chief investment officer at the Swiss investing app arvy, Oct. 17 and Oct. 27, 2026. Read the Oct. 27 post
Although midterm years tend to rattle portfolios, 2026 paid its toll on Wall Street and kept moving. The benchmark S&P 500, tracked by the SPDR S&P 500 ETF TrustSPY, closed at $769.66 on October 27. That leaves it up 12.87% year to date, after SPY fell 9.1% from its $695.49 close on January 27 to $631.97 on March 30. Over that stretch, the CBOE Volatility Index (VIX) climbed to a 12-month closing high of 31.05 on March 27. But the number that matters most is a date: the November 3 midterm vote opens what cycle analysts call the strongest window of the four-year presidential calendar.
A Swiss Strategist Just Flagged the Best Nine Months of the Cycle
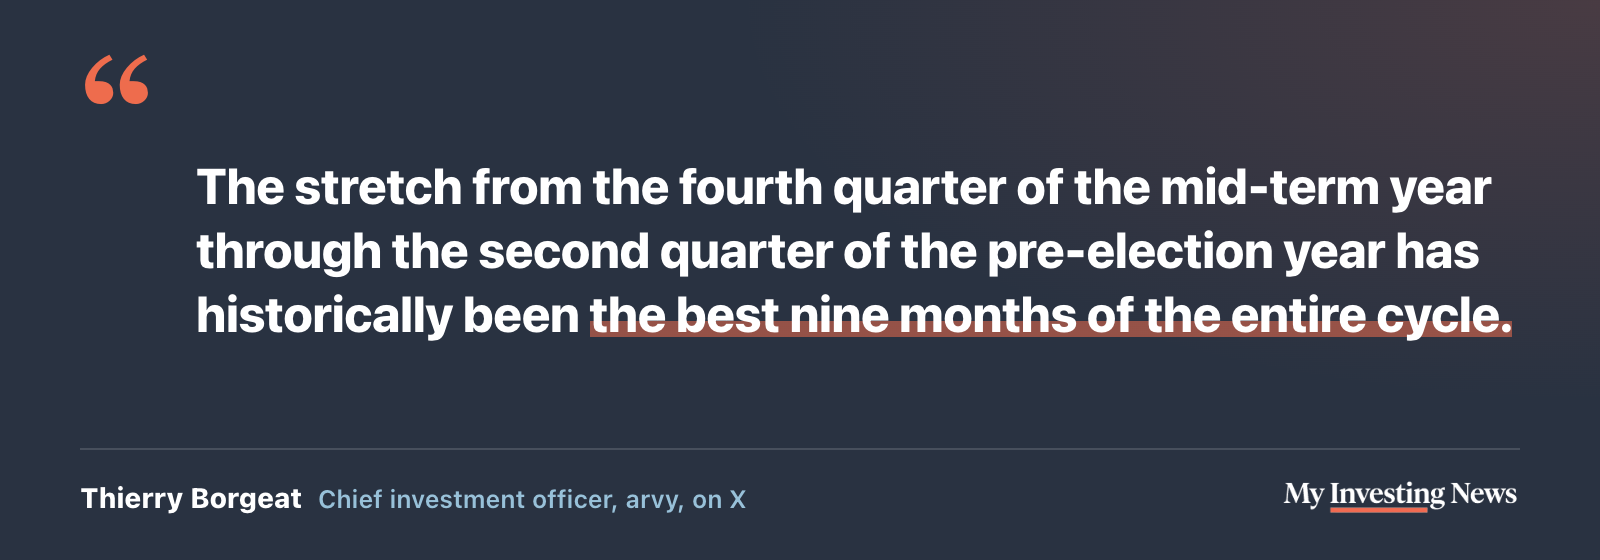
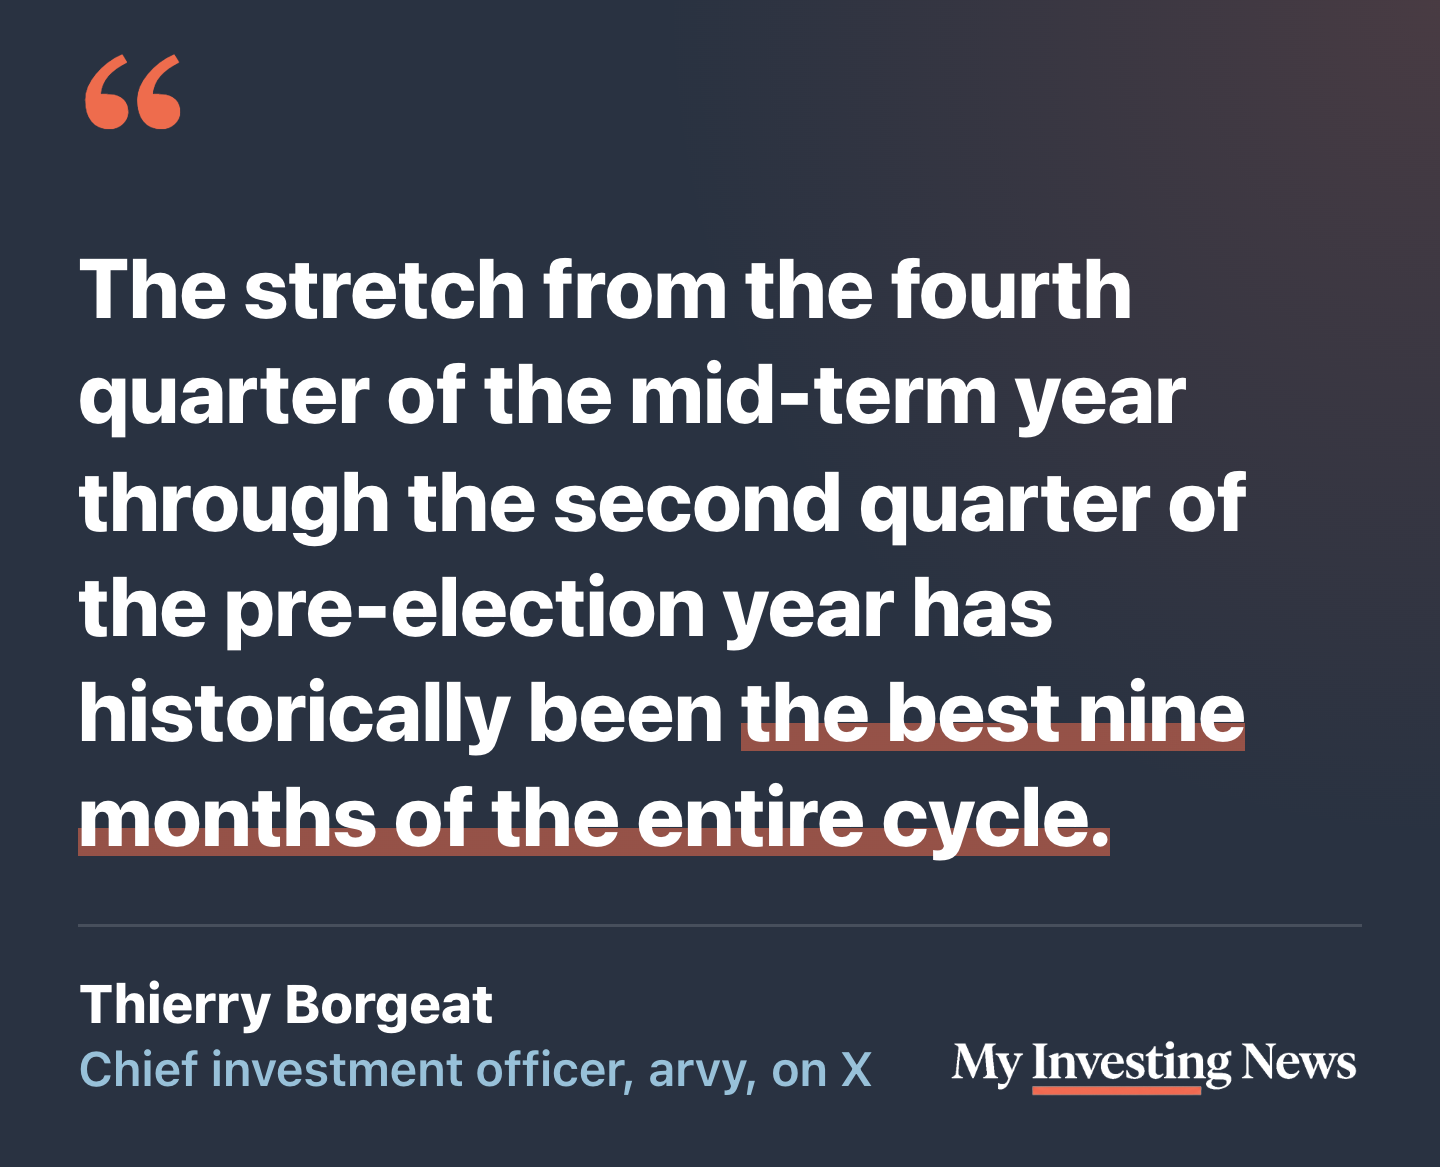
On October 27, Thierry Borgeat, chief investment officer at the Zurich-based investing app arvy, posted that the stretch from the fourth quarter of a midterm year through the second quarter of the pre-election year “has historically been the best nine months of the entire cycle, with the S&P 500 gaining around 20% on average since 1949.” He shared a tally from the account @aleabitoreddit claiming November-to-June returns after midterms were “21/21 times were positive” with an “Avg. index gain was 16.6%.” That quoted post piled up 1,524 likes in a matter of hours. Viral tallies deserve a second check, so I’m holding these figures up against independent data before leaning on them.
Independent Data Backs the Post-Midterm Rally
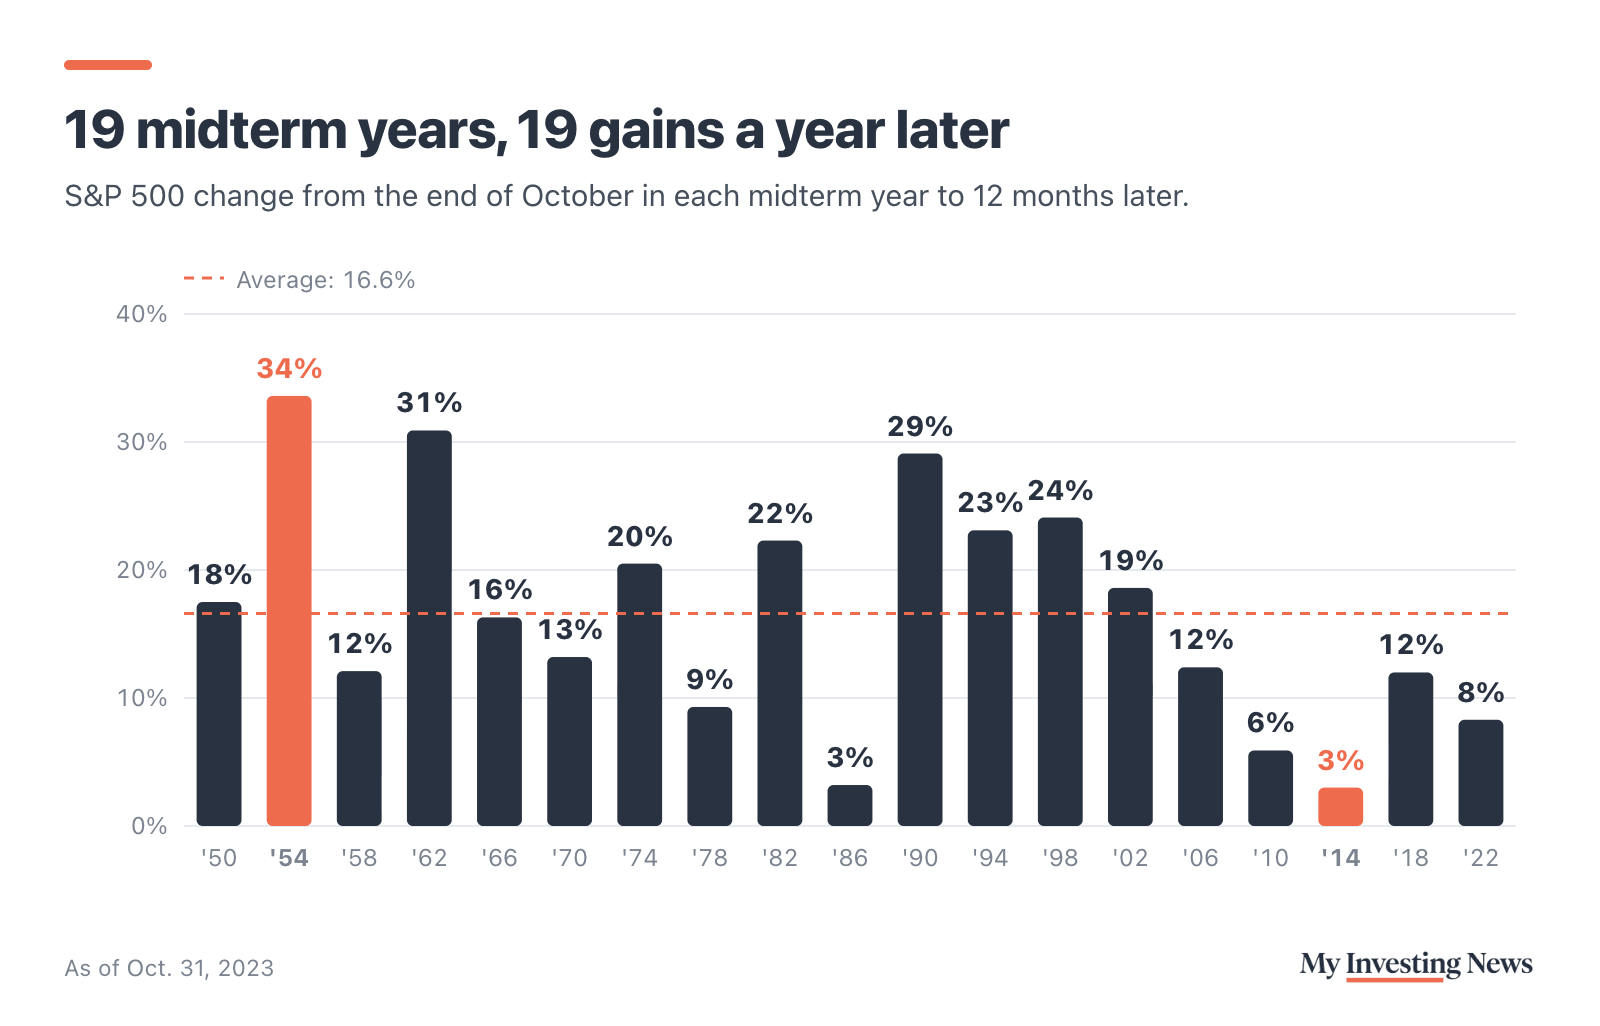
A review of TradingView data covering 19 midterm elections since 1950 found the S&P 500 was higher 12 months after the end of October in every case, according to Yahoo Finance. The average gain was 16.6% and the median was 16.3%. Even the weakest run, from October 2014 to October 2015, doled out about 3%, while the strongest, after the 1954 vote, reached about 34%. The measurement window differs from the viral November-to-June tally, but the direction matches, and that gives the post real credibility.
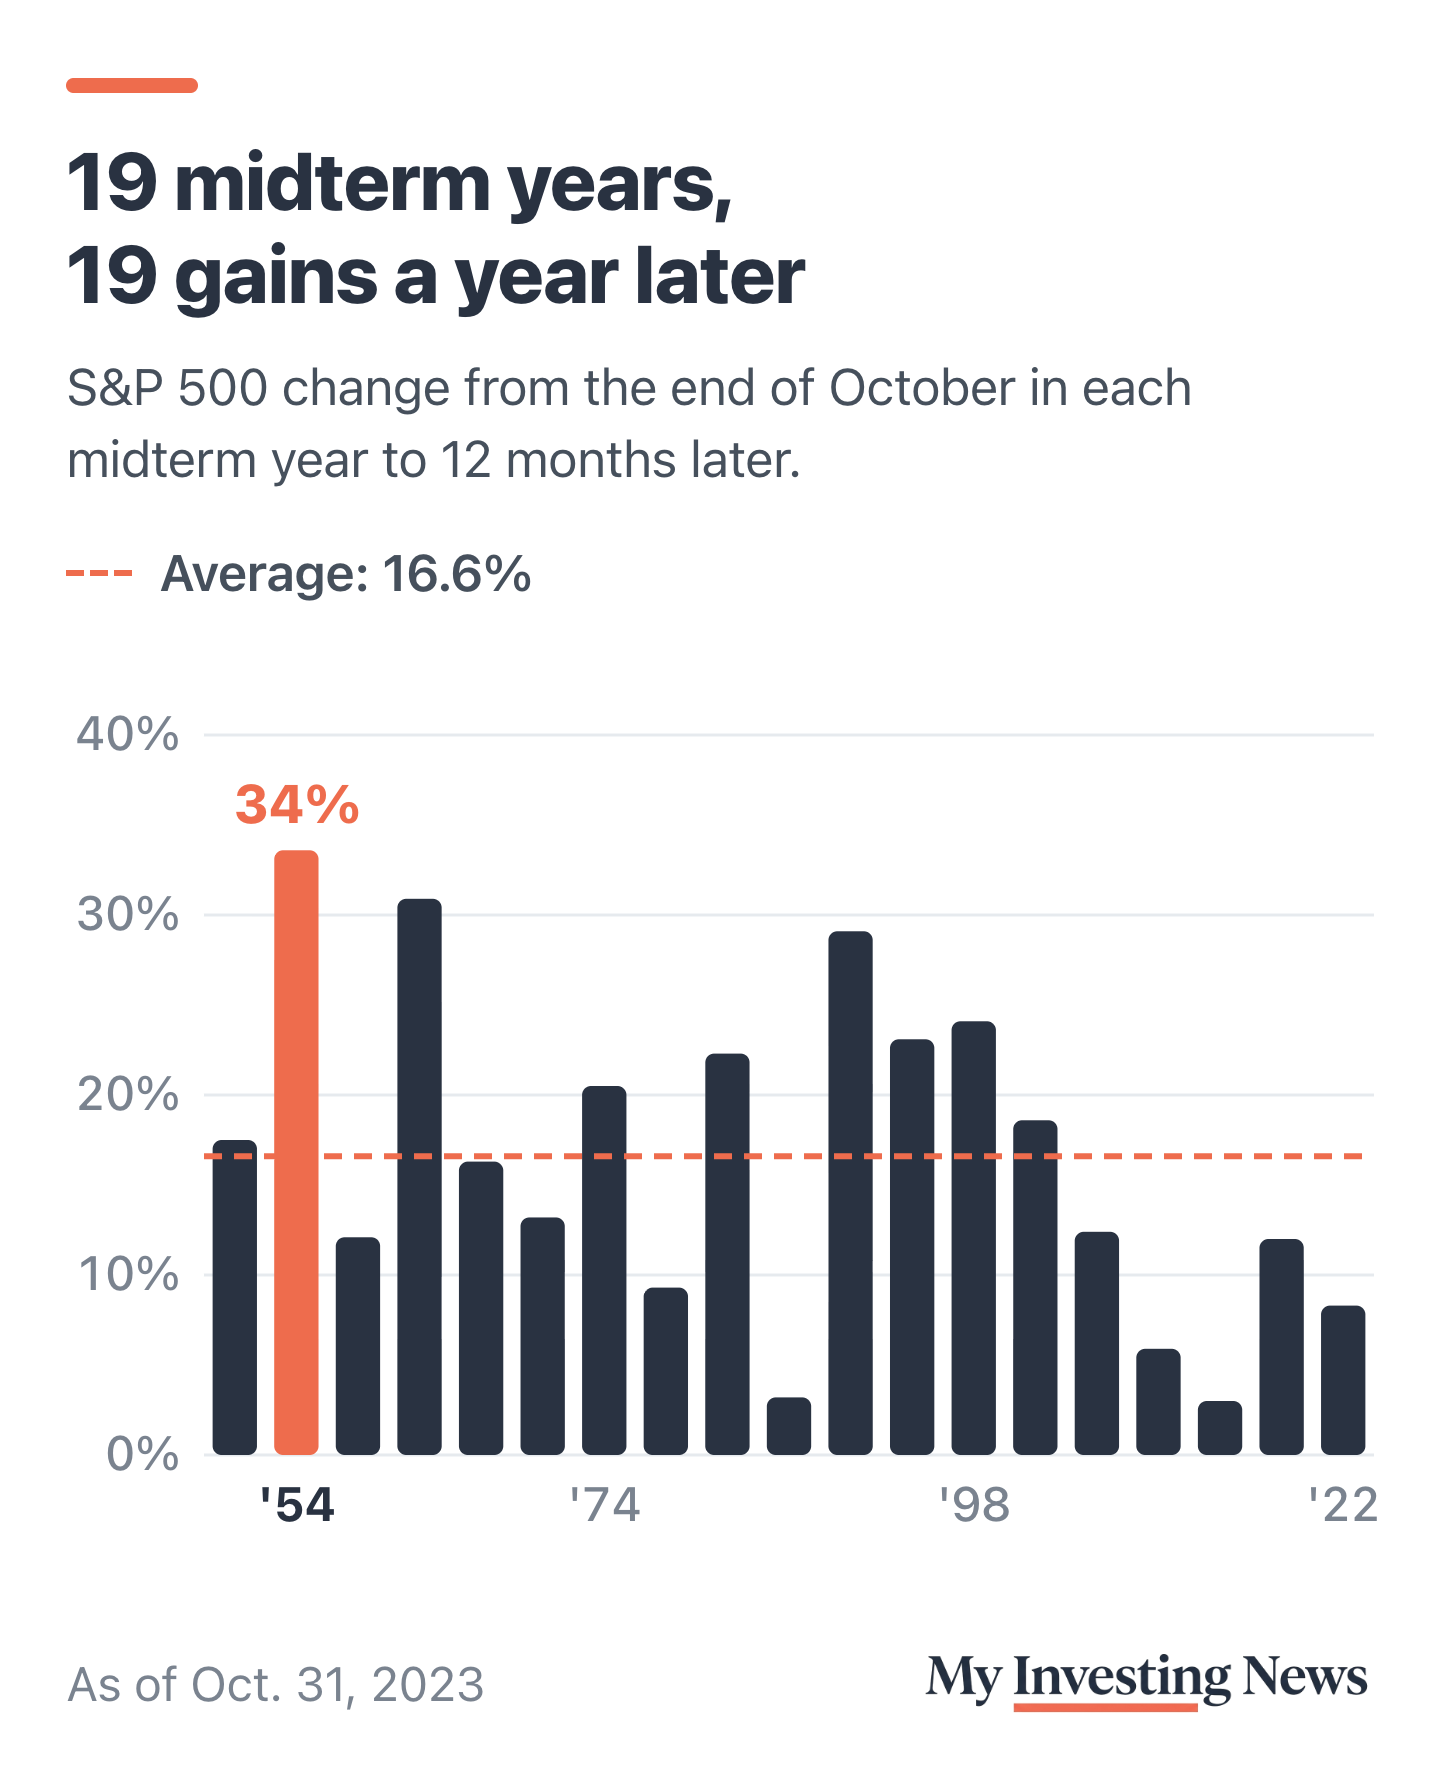
The logic holds together. Policy uncertainty peaks before the vote, investors trim risk, and once control of Congress is settled, sidelined cash tends to flow back into equities. Gridlock also makes sweeping legislative surprises less likely in the following year.
Every Midterm Delivers a Drawdown, and 2026 Paid on Schedule
The bullish half of the playbook carries weight because the bearish half already showed up. On October 17, Borgeat published a midterm map listing a drawdown in every midterm year from 1974 through 2022, including 35% under Ford, 34% under Bush II, 20% under Trump and 17% under Obama. The smallest drawdown on his list was 8%, a reminder that each cycle sizes its own damage. This year’s selloff peaked in fear terms when the VIX closed at 31.05 and then 30.61 on March 30, before cooling to 18.39 by October 26.
2026’s selloff and recovery
The window when midterm-year drawdowns typically hit has now closed, and SPY trades within sight of its October weekly high of $781.62. Carson Group’s Ryan Detrick still sees record highs by year-end.
Short-Term Turbulence Still Lurks Before the Payoff
However, the 12-month record masks a choppier near term. From October to year-end, the S&P 500 rose in only 13 of those 19 midterm years, averaging a 3.6% gain. In 2018, the index tumbled 7.6% in the last two months of the year, its worst post-midterm stretch in the sample. Twelve months after the October close, it stood 12% higher, rewarding anyone who held through the storm.
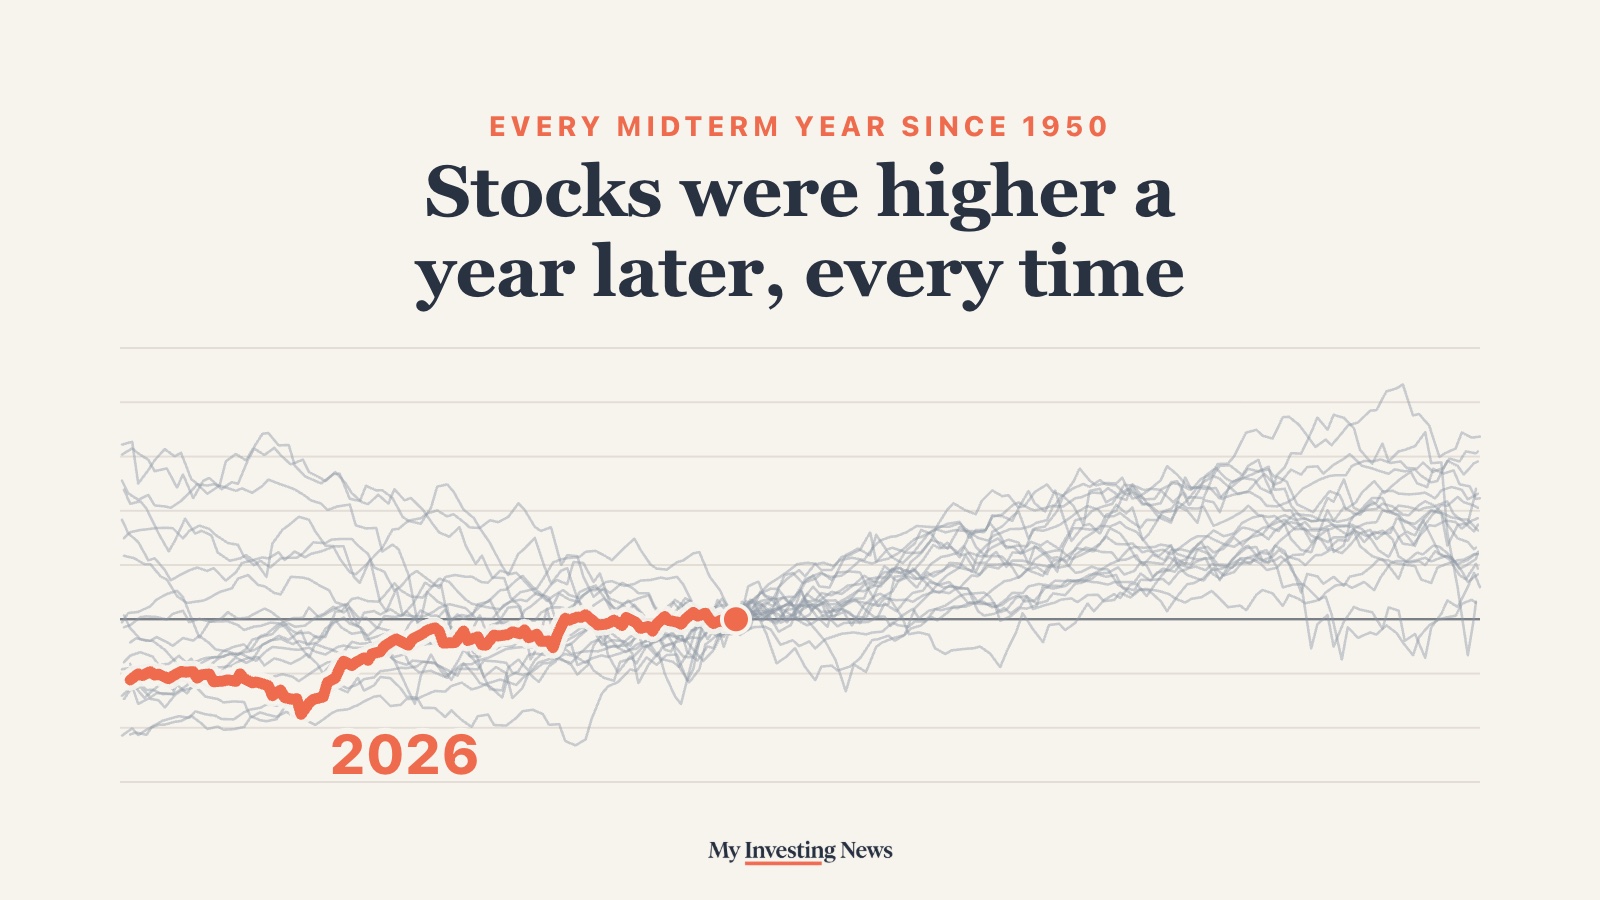
Six of 19 midterm years slipped by Dec. 31. A year out, all 19 were higher.
The S&P 500 in each midterm year since 1950, lined up at the end of October (0%; 2026 at the Oct. 27 close). Gray lines are 1950 to 2022. 2026 is coral.
Volatility is creeping up into the vote. The VIX reading on October 26 was up 23.7% from a month earlier, though it still sits within the normal 15-to-20 band. If a post-election dip sends the index lower, history suggests it tends to fade within the following year.
Scenarios That Put the Pattern to the Test
A quick gut-check on price comes first. SPY has skyrocketed 261% over ten years and 69.6% over five, so the market enters this window with momentum and a fuller price tag than it carried in past midterm troughs. If the next 12 months match the 16.6% post-midterm average, SPY would reach roughly $897.42. A repeat of the weakest run on record, about 3%, would still lift it to about $792.75. If 2026 becomes the first miss in the sample, the likely cause would be a shock unrelated to the election calendar, such as a recession or a credit event.
Seasonality describes a tendency and carries no guarantee, and the post Borgeat shared asked whether 2026 will be an anomaly. Still, the drawdown his map predicted has already arrived and been absorbed. Over the long run, Wall Street has historically come out stronger after every midterm cycle, and the decades ahead are likely to follow suit.
Borgeat’s view is that the midterm-year selloff is behind us and the strongest stretch of the four-year cycle starts now. History backs him: the S&P 500 rose in the 12 months after all 19 midterms since 1950, by 16.6% on average. The risk is the near term and the starting price, since six of those 19 years fell from October to year-end and SPY enters this window up nearly 13% for the year.