Where we heard itThoughts on the Market, Morgan Stanley’s daily podcast, “The Next Stage of the Market Correction,” Oct. 26, 2026. Speaker: Mike Wilson, chief investment officer and chief U.S. equity strategist at Morgan Stanley. Podcast page
Morgan Stanley’s Mike Wilson thinks the stock market’s pullback since June is in its last stage, and he named the midterm elections as one of three events that could finish it. His advice for the days around the Nov. 3 vote is to treat a sharp drop as a chance to buy.
“Historically, post-midterm returns have been very strong, so I would be ready to embrace a sharp downdraft in stocks in the days and weeks around Election Day,” Wilson said on the firm’s Thoughts on the Market podcast on Oct. 26.
Three Clearing Events
Wilson listed three things he thinks the market has to get through. The first is AI spending, where he expects more stock and debt supply over the next few weeks. “Specifically, I see another 10 to 15% lower for the semiconductor index into mid-November,” he said. The second is the election. The third, and the one he called most important, is tighter financial conditions.
On the vote itself, he said the outcome isn’t what worries him. “A blue wave is not a surprise anymore, though. The larger overhang is what may happen after the vote, including the possibility of a renewed military escalation in Iran,” he said. Bettors agree on the first part. As of Oct. 27, bettors on Polymarket put the odds of Democrats winning the House at 92% and of a Democratic sweep of both chambers at 66%, with the race for the Senate closer, at 67% for Democrats.
If the index does fall further, Wilson said, “7100 to 7200 on the S&P 500 is where the correction should find material support.” The S&P 500 closed at 7,722.60 on Oct. 27, 1.2% below its Oct. 6 record of 7,818.93. The middle of his range is about 7.4% lower.
Checking the Days Around the Vote
We tested the call on all 19 midterms since 1950, using the S&P 500’s daily closes from 10 trading days before each Election Day to 20 trading days after. We counted a dip as a pullback of 3% or more, from a high close to a later low close, in the 10 trading days on either side of the vote. (Through 1966 the New York Stock Exchange closed on Election Day, so for those years we used the Monday close.)
Stocks dipped in 12 of the 19 midterms. The median biggest pullback was −3.6%, and six of them reached 5% or more, led by 9.3% in 1974 and 6.1% in 2018. That is more often than usual. In the same calendar window in the other 57 years since 1950, stocks dipped 27 times, and about 47% of all comparable 21-day stretches since 1950 had a 3% pullback.
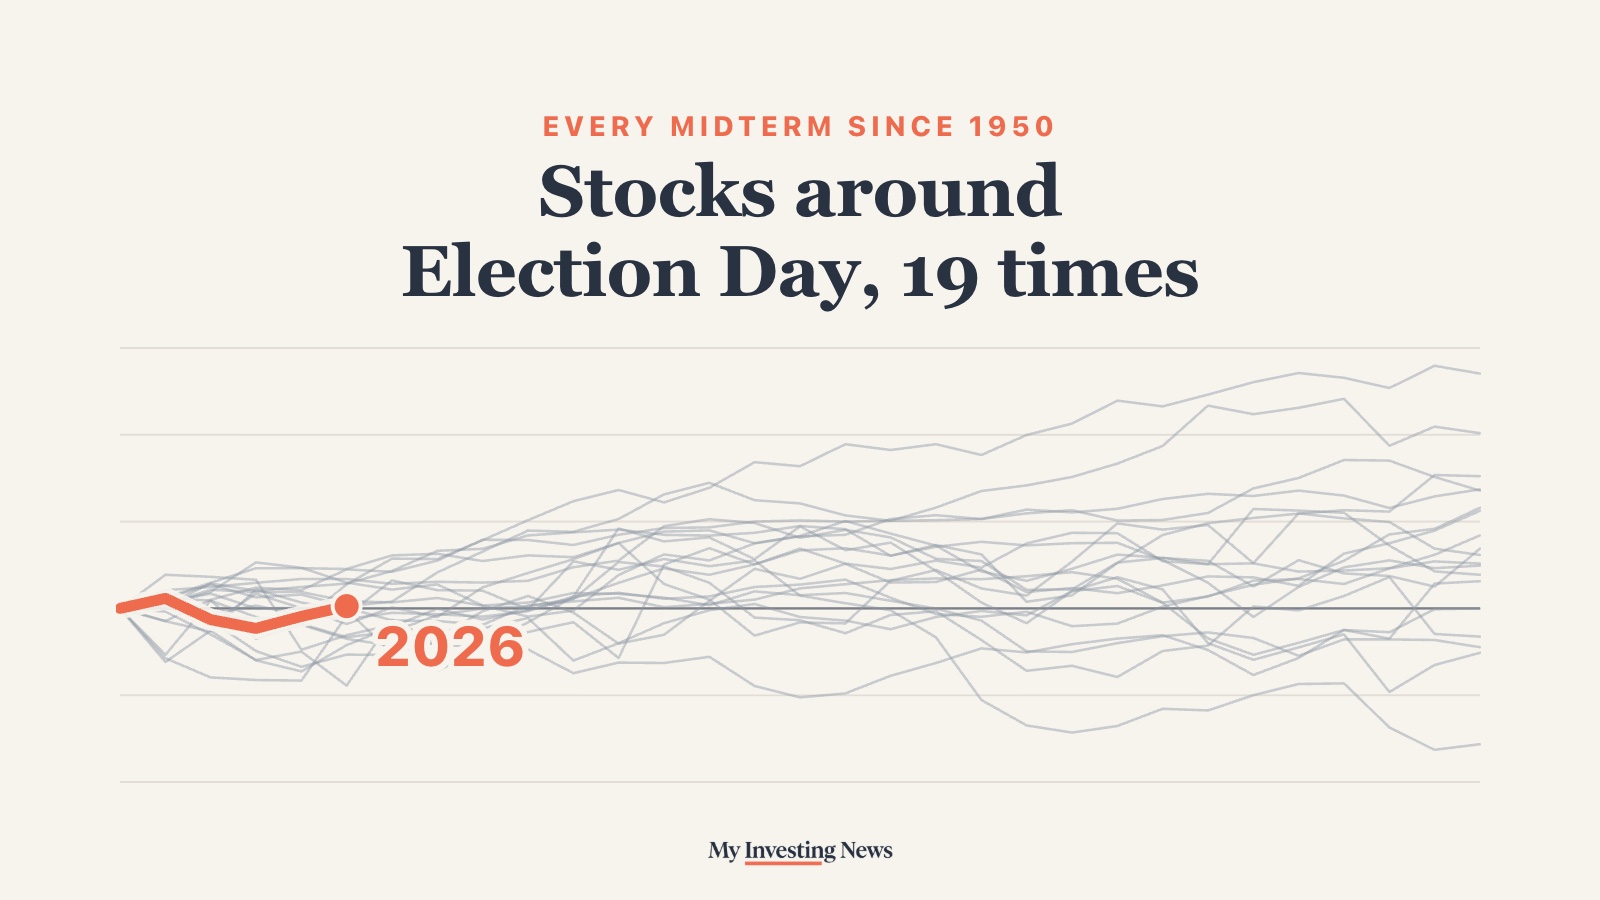
Stocks pulled back 3% or more around the vote in 12 of 19 midterms since 1950. Most were higher a month later.
The S&P 500 from 10 trading days before each midterm Election Day to 20 trading days after, in percent from the start of that window. Gray lines are 1950 to 2022. 2026 is coral, through Oct. 27.
This year’s window opened on Oct. 20, when the S&P 500 closed at 7,712.57. Through Oct. 27, five trading days before the vote, it was +0.1% from there, and its biggest pullback so far was −1.7%. The index is up 12.8% this year. The longer midterm-year pattern is covered in our look at what stocks did after the midterm selloff.
The midterm window since 1950, in four numbers
What Came After the Vote
Wilson’s case rests on what follows. The S&P 500 was higher 20 trading days after Election Day in 16 of the 19 midterms, with a median gain of +2.2%. Across every 20-day stretch since 1950, the index rose about 62% of the time, with a median gain of +1.1%.
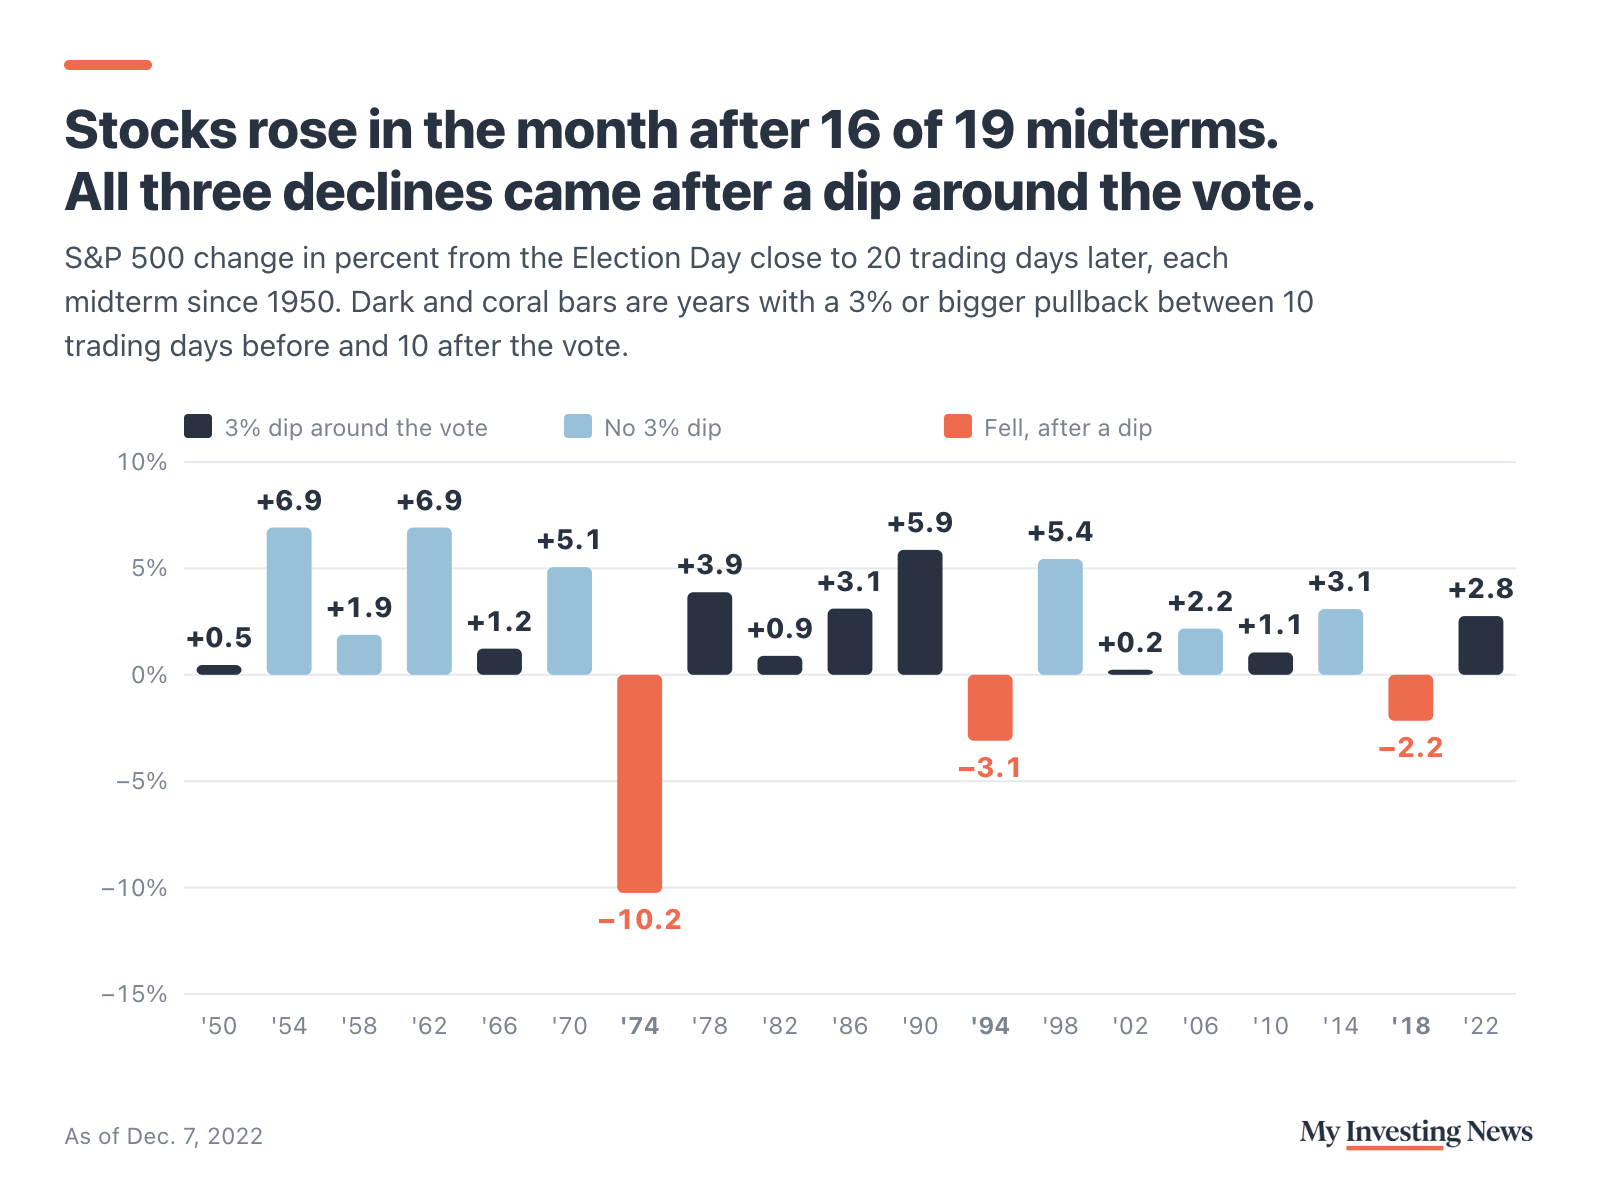
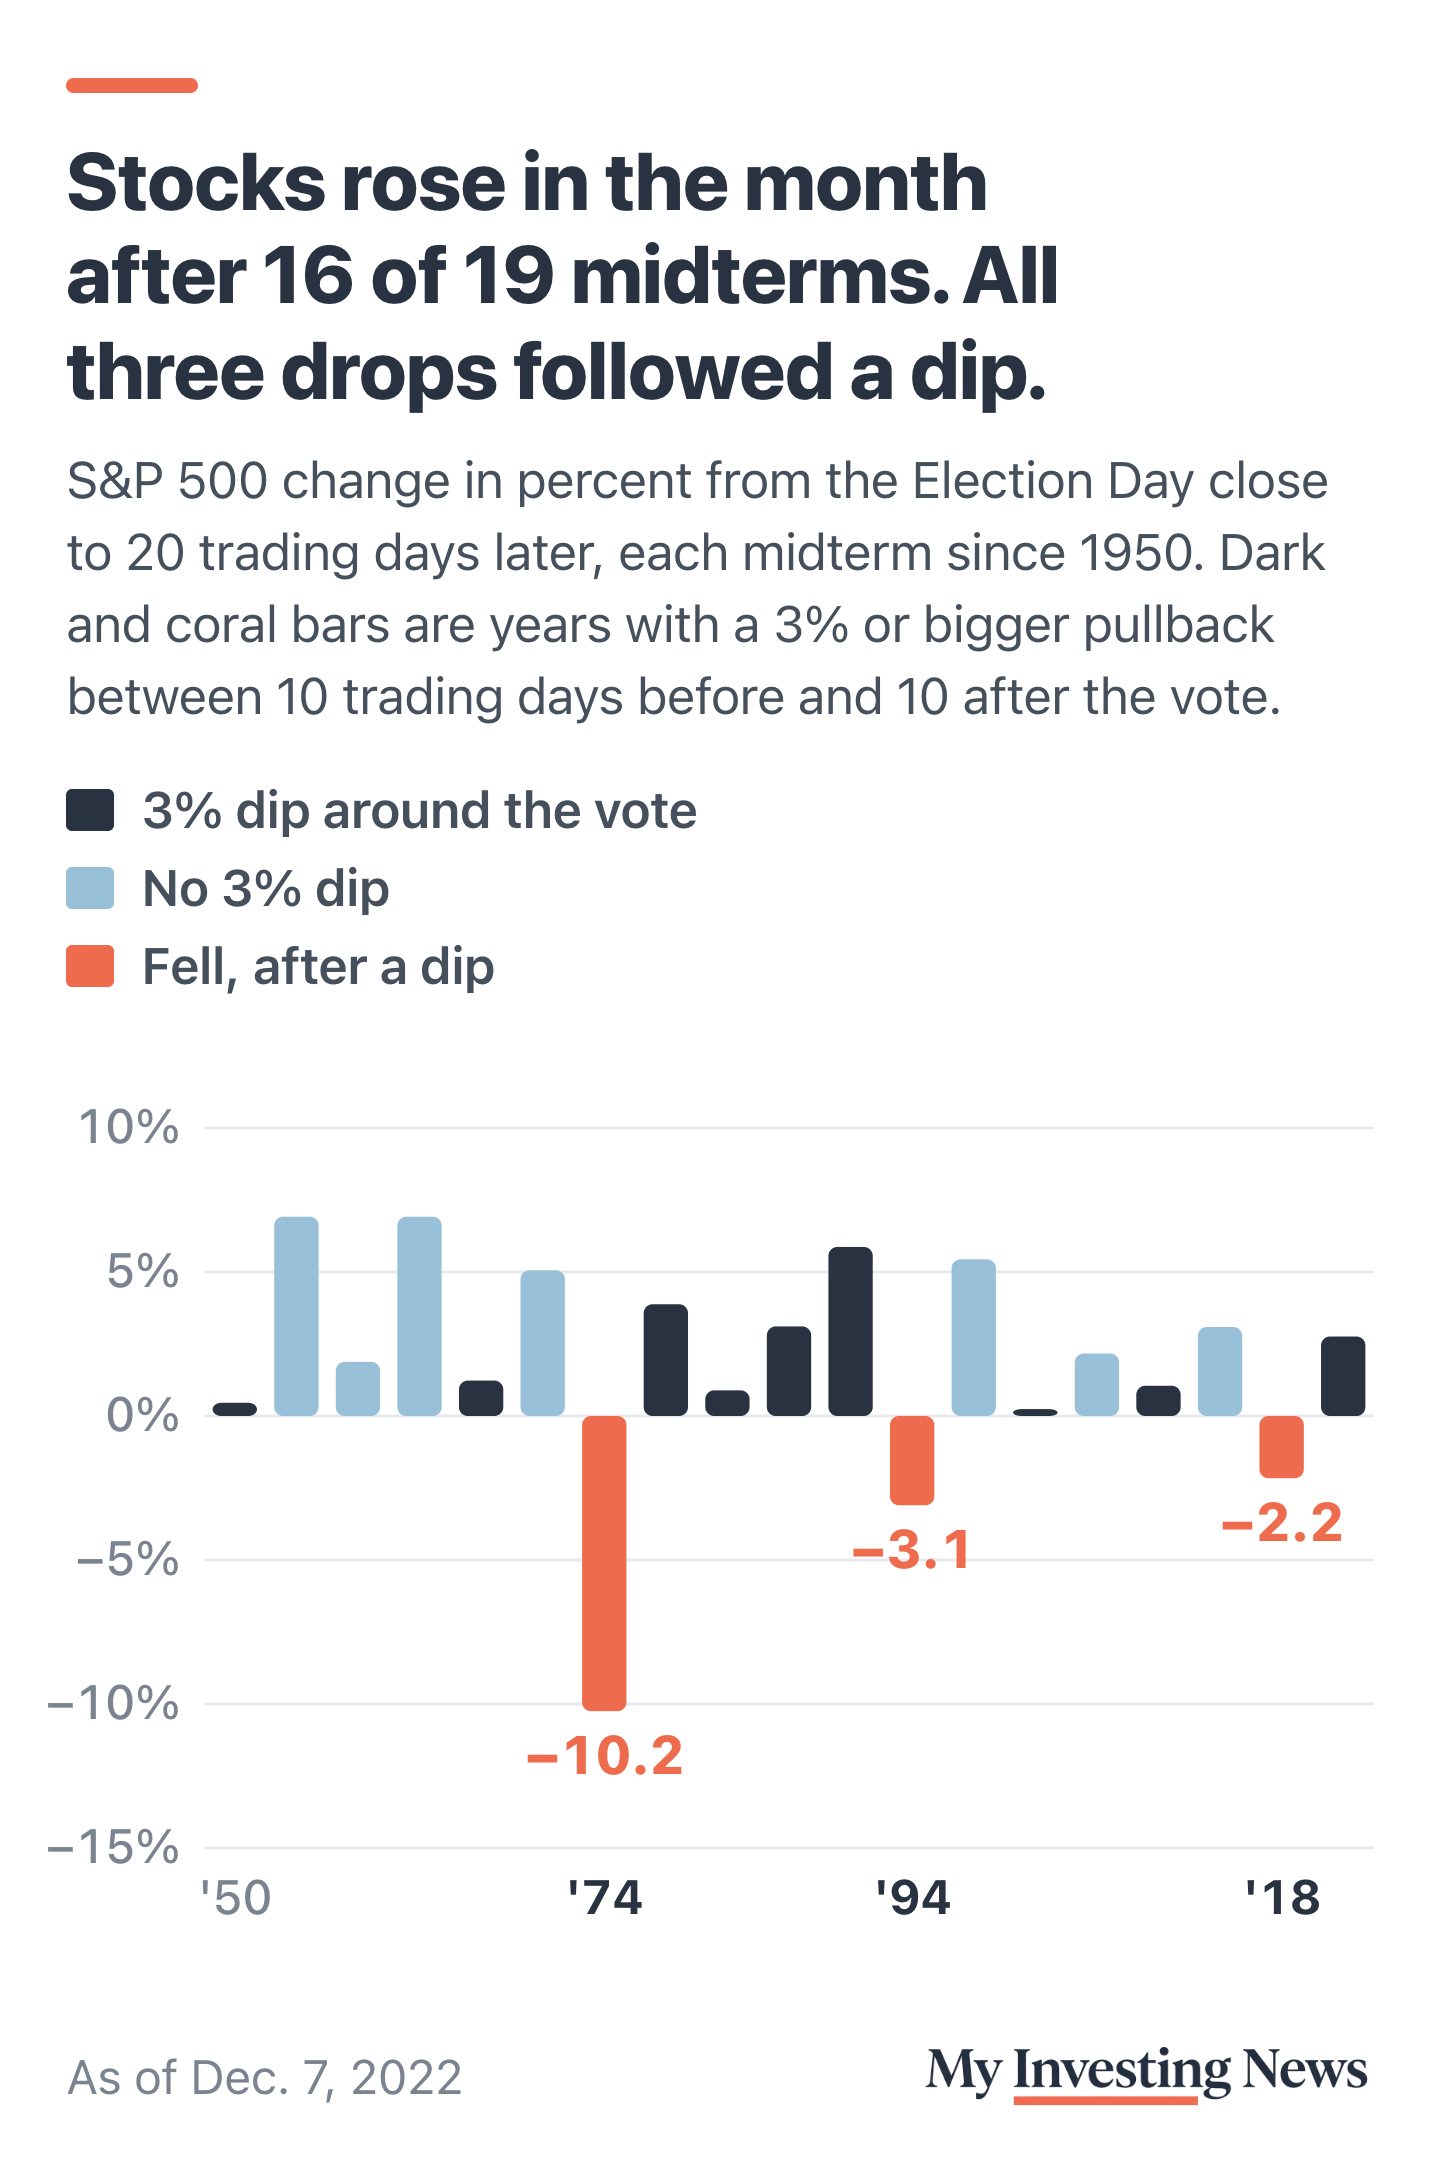
Buying a dip still took nerve. All three declines came in dip years: −10.2% in 1974, −3.1% in 1994 and −2.2% in 2018. In 1974 and 1994, the S&P 500’s lowest close of the window came 10 trading days after the vote, so the selling was still going when the window closed. Of the 12 dip years, 9 ended the next 20 trading days higher. Nineteen midterms is a small sample, and none of them came with a possible war as the overhang.
Wilson’s Record on the Index
Wilson made his name in 2022. His target for that year, set in November 2021, was 4,400, below where the index traded, and the S&P 500 ended 2022 at 3,839.50. He stayed bearish too long after that. He told CNBC in November 2022 to expect the S&P 500 between 3,000 and 3,300 in early 2023; its lowest close from January to April was 3,808.10. The index ended 2023 at 4,769.83, 22% above his 3,900 target, and ended 2024 at 5,881.63, 31% above his starting 2024 target of 4,500. He had raised that target to 5,400 in May 2024.
He turned bullish in late 2024. The S&P 500 finished 2025 at 6,845.50, 5.3% above his 6,500 target. On March 30, 2026, he said the S&P 500’s correction was nearing its end, CNBC reported; that day’s close of 6,343.72 is still the low of the year. His 12-month target of 7,800 from November 2025 was reached on Oct. 6. He raised his year-end goal to 8,000 in May, and the index is 3.5% short of it as of the Oct. 27 close.
What to Watch
Semiconductors are his early test. The PHLX Semiconductor Index closed at 11,083.47 on the day he spoke and rose 3.6% on Oct. 27, to 11,482.50. A 10% to 15% drop from the Oct. 26 close would take it to about 9,421 to 9,975 by mid-November. The iShares Semiconductor ETFSOXX closed at $491.83 on Oct. 26 and $511.06 on Oct. 27, after options traders piled into chip puts the week before.
After that come the Nov. 3 vote, any move by Iran or the U.S. after it, and the S&P 500’s 7,100 to 7,200 zone if the selling spreads to the index. By our count, the window closes 20 trading days after the vote, on Dec. 2.
Wilson says a sharp drop around Election Day would be a chance to buy. History backs the pattern: stocks dipped 3% or more around the vote in 12 of 19 midterms since 1950 and were higher a month later in 16. The three times they weren’t all followed a dip, and this year the risk he names after the vote, Iran, has no match in the record.