Where we heard itBloomberg Businessweek podcast, “Epstein Haunts GOP in Midterms as Democrats Vow Fresh Probes,” Oct. 27, 2026. Speaker: Josh Wingrove, White House correspondent at Bloomberg News. Episode page
Bloomberg News White House correspondent Josh Wingrove thinks Republicans have already lost the House, and he says they are not alone in thinking it. Asked on the Bloomberg Businessweek podcast on Oct. 27 whether the polling had improved for the party, he answered: “I mean, the House, the House looks gone. Many, many Republicans are saying this aloud, including like Kevin McCarthy.”
He then made a narrower claim that can be checked. The playing field, he said, is smaller than it was when Democrats took the House in 2018, so the same swing in the vote would win them fewer seats this time.


What Wingrove Said About the Map
“The core battlegrounds, the map has shrunk since 2018. I think that’s important for people to remember,” Wingrove said. “If the same vote swing that happened in 2018 that ushered Nancy Pelosi back to the speakership, the exact same swing would generate far fewer actual seats flipping. But it’s looking like it could be more of a swing.”
He added that the year’s new congressional maps were “redrawn in an environment where you kind of assumed that a 10-point district is safe. Doesn’t seem like a 10-point district is safe.” He called the Senate the likely Republican firewall, a race prediction markets have priced much closer than the House: Polymarket had Democrats at 66.5% for the Senate as of Oct. 27.
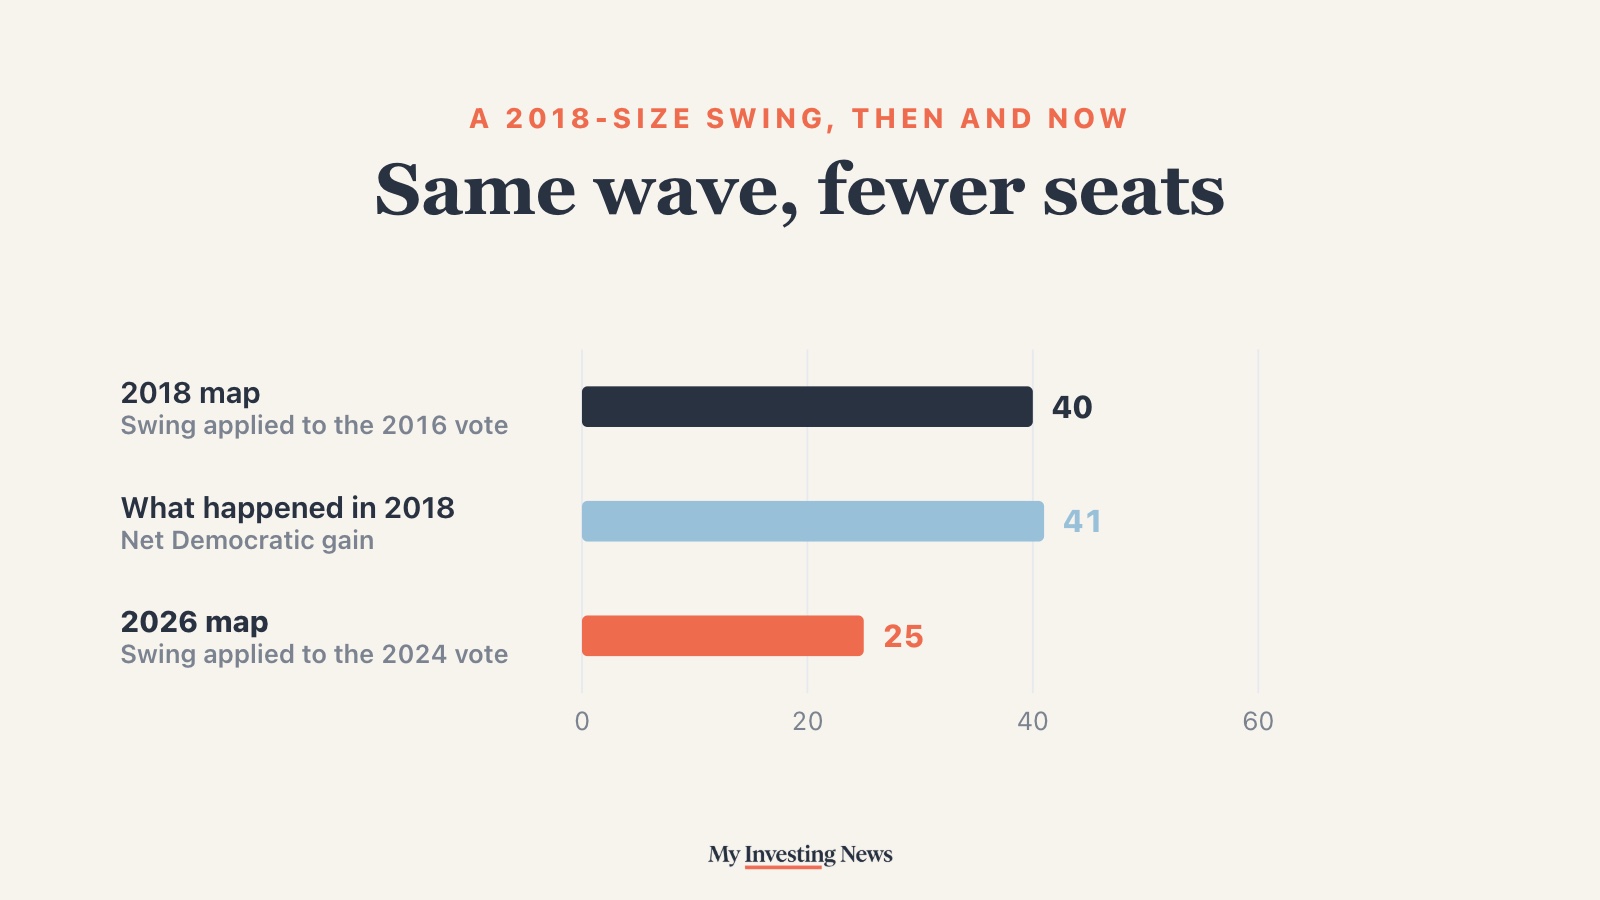
The 2018 swing is the benchmark. Republicans won the national House vote by 1.0 point in 2016, and Democrats won it by 8.6 points in 2018, a swing of about 9.7 points, according to the Clerk of the House. Democrats went from 194 seats to 235, a gain of 41.
Swing Districts Hit Bottom in 2018
The first half of the claim doesn’t hold up against the standard measure. The Cook Political Report counts swing districts as those with a Cook Partisan Voting Index between D+5 and R+5, meaning the district voted within about five points of the nation in the last two presidential races. By Cook’s own history, those seats fell from 164 on the map used in 1998 to 70 on the map used in 2018, the fewest on record.
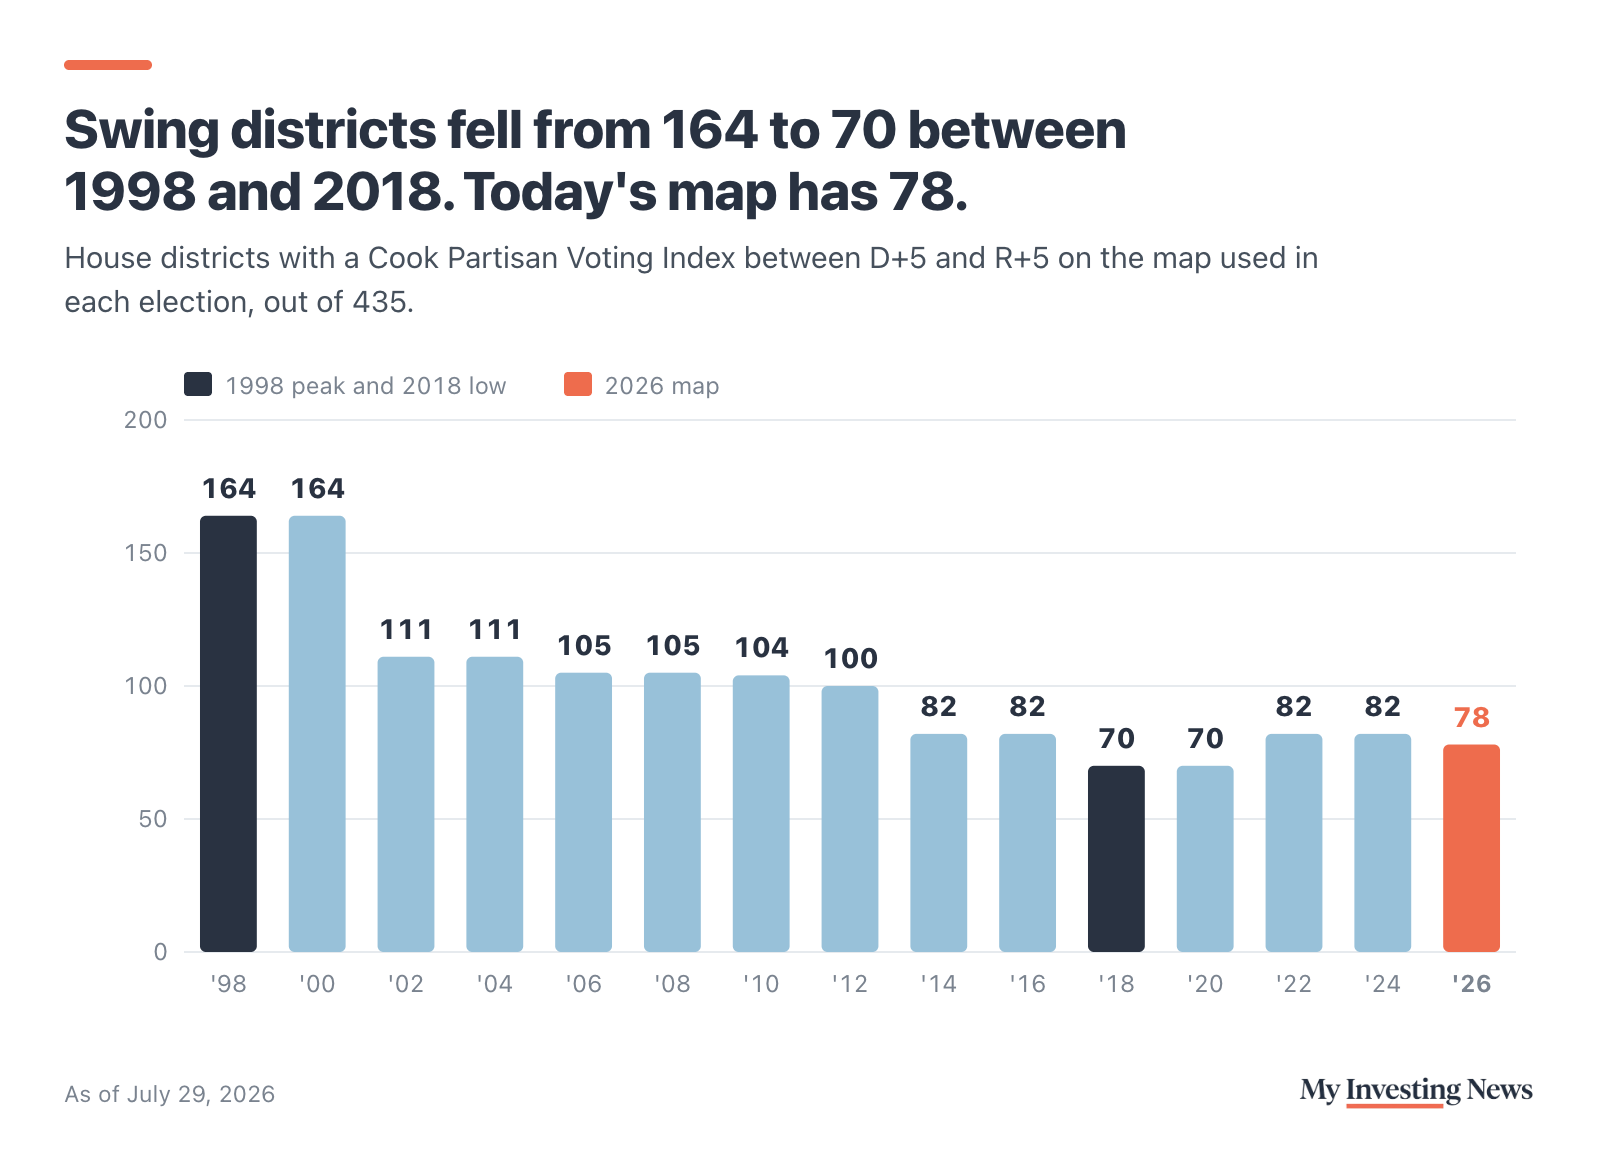
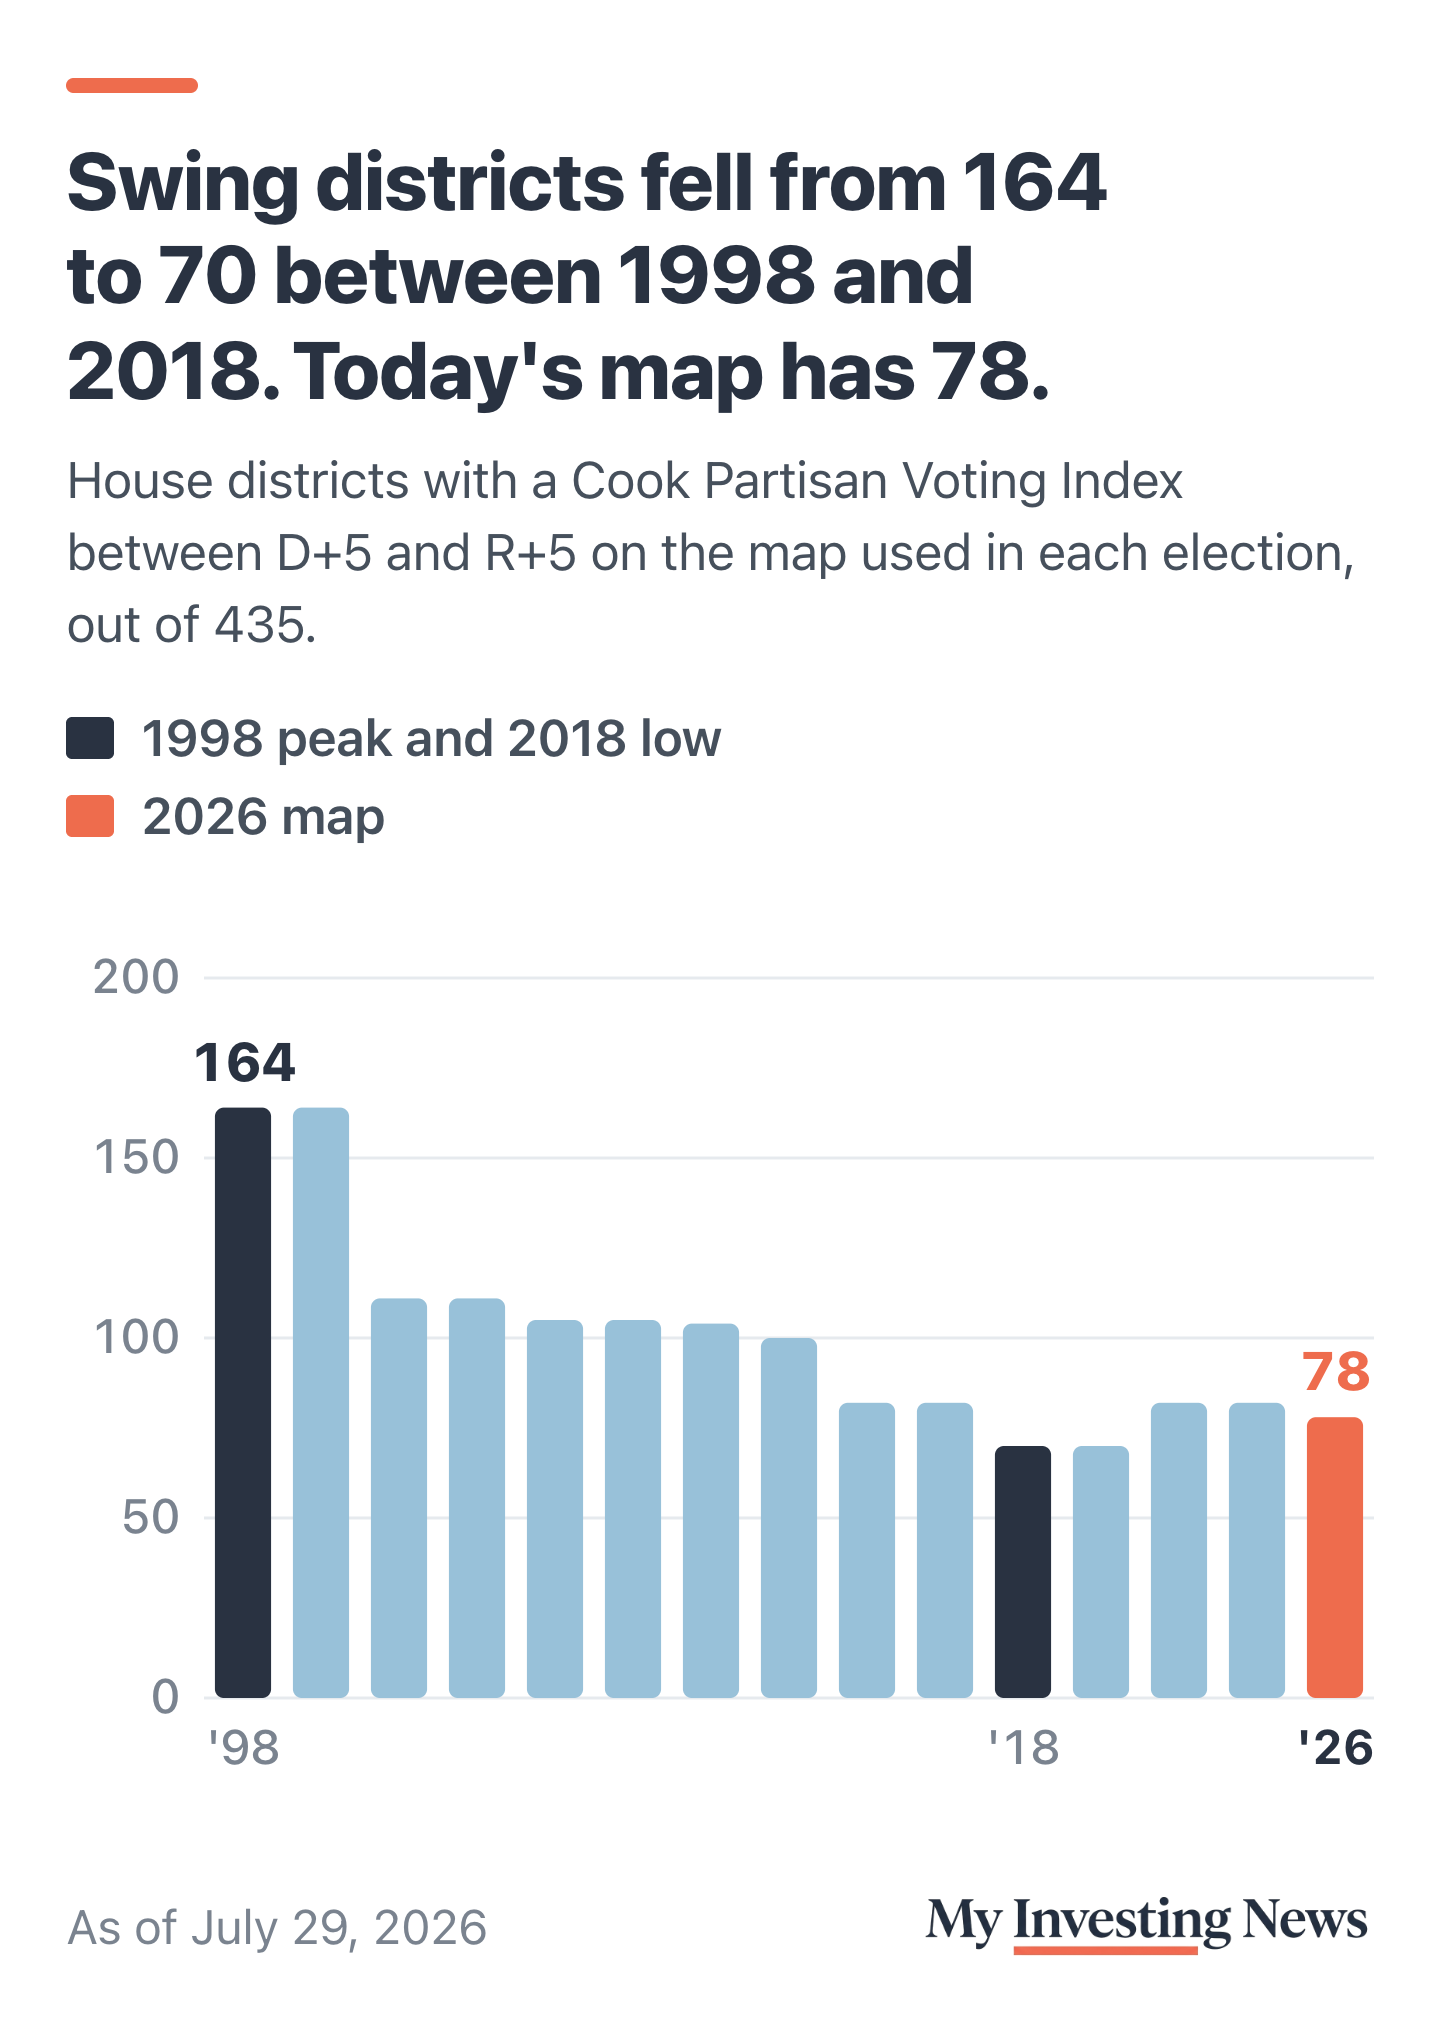
The count has edged up since. Cook found 87 swing seats in its 2025 index. Ten states then redrew their lines for 2026, and Cook’s July update covers the new maps. Using the same rule Cook applied in 2025, which counts unrounded scores, we count 78 swing seats on the 2026 map (89 using rounded scores). Either way, that is more than the 70 of 2018. Cook has written that voters sorting themselves by party did more than gerrymandering to empty the middle, which is also why, as Stanford’s Brandice Canes-Wrone has argued, money can shape primaries more than general elections.
Where His Seat Math Holds Up
The second half of the claim is about seats, and it holds. We applied a 2018-size swing to both maps. For each district we took its margin in the last presidential race and moved it toward Democrats by the gap between the midterm House vote and that presidential vote nationally. A Republican-held seat flips if the result crosses zero. Like any uniform-swing model, it ignores incumbents, candidates and turnout.
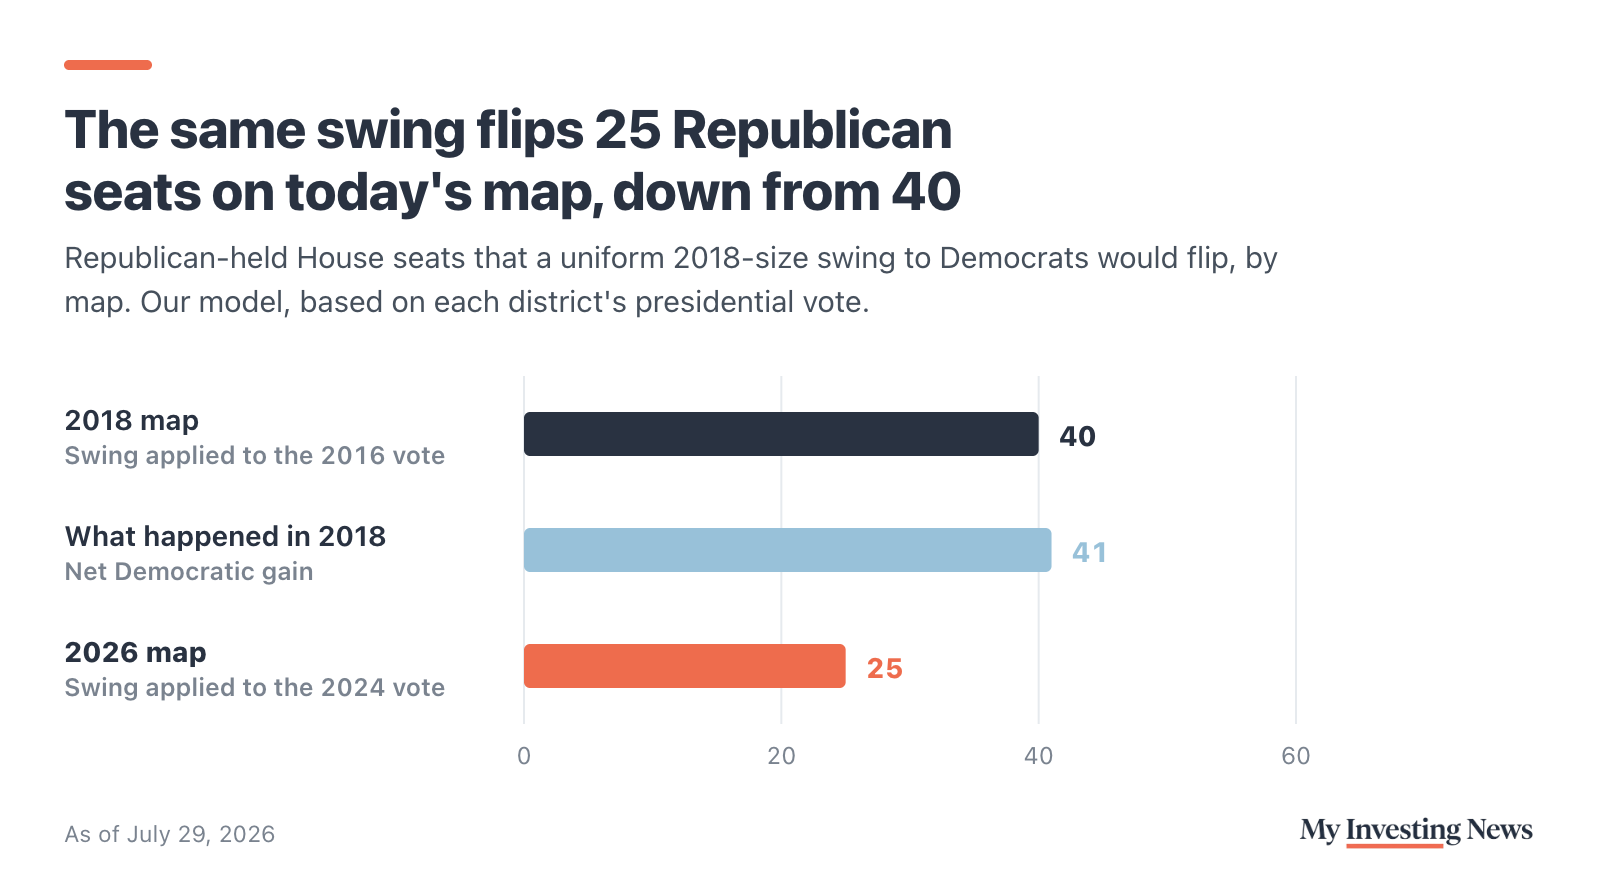
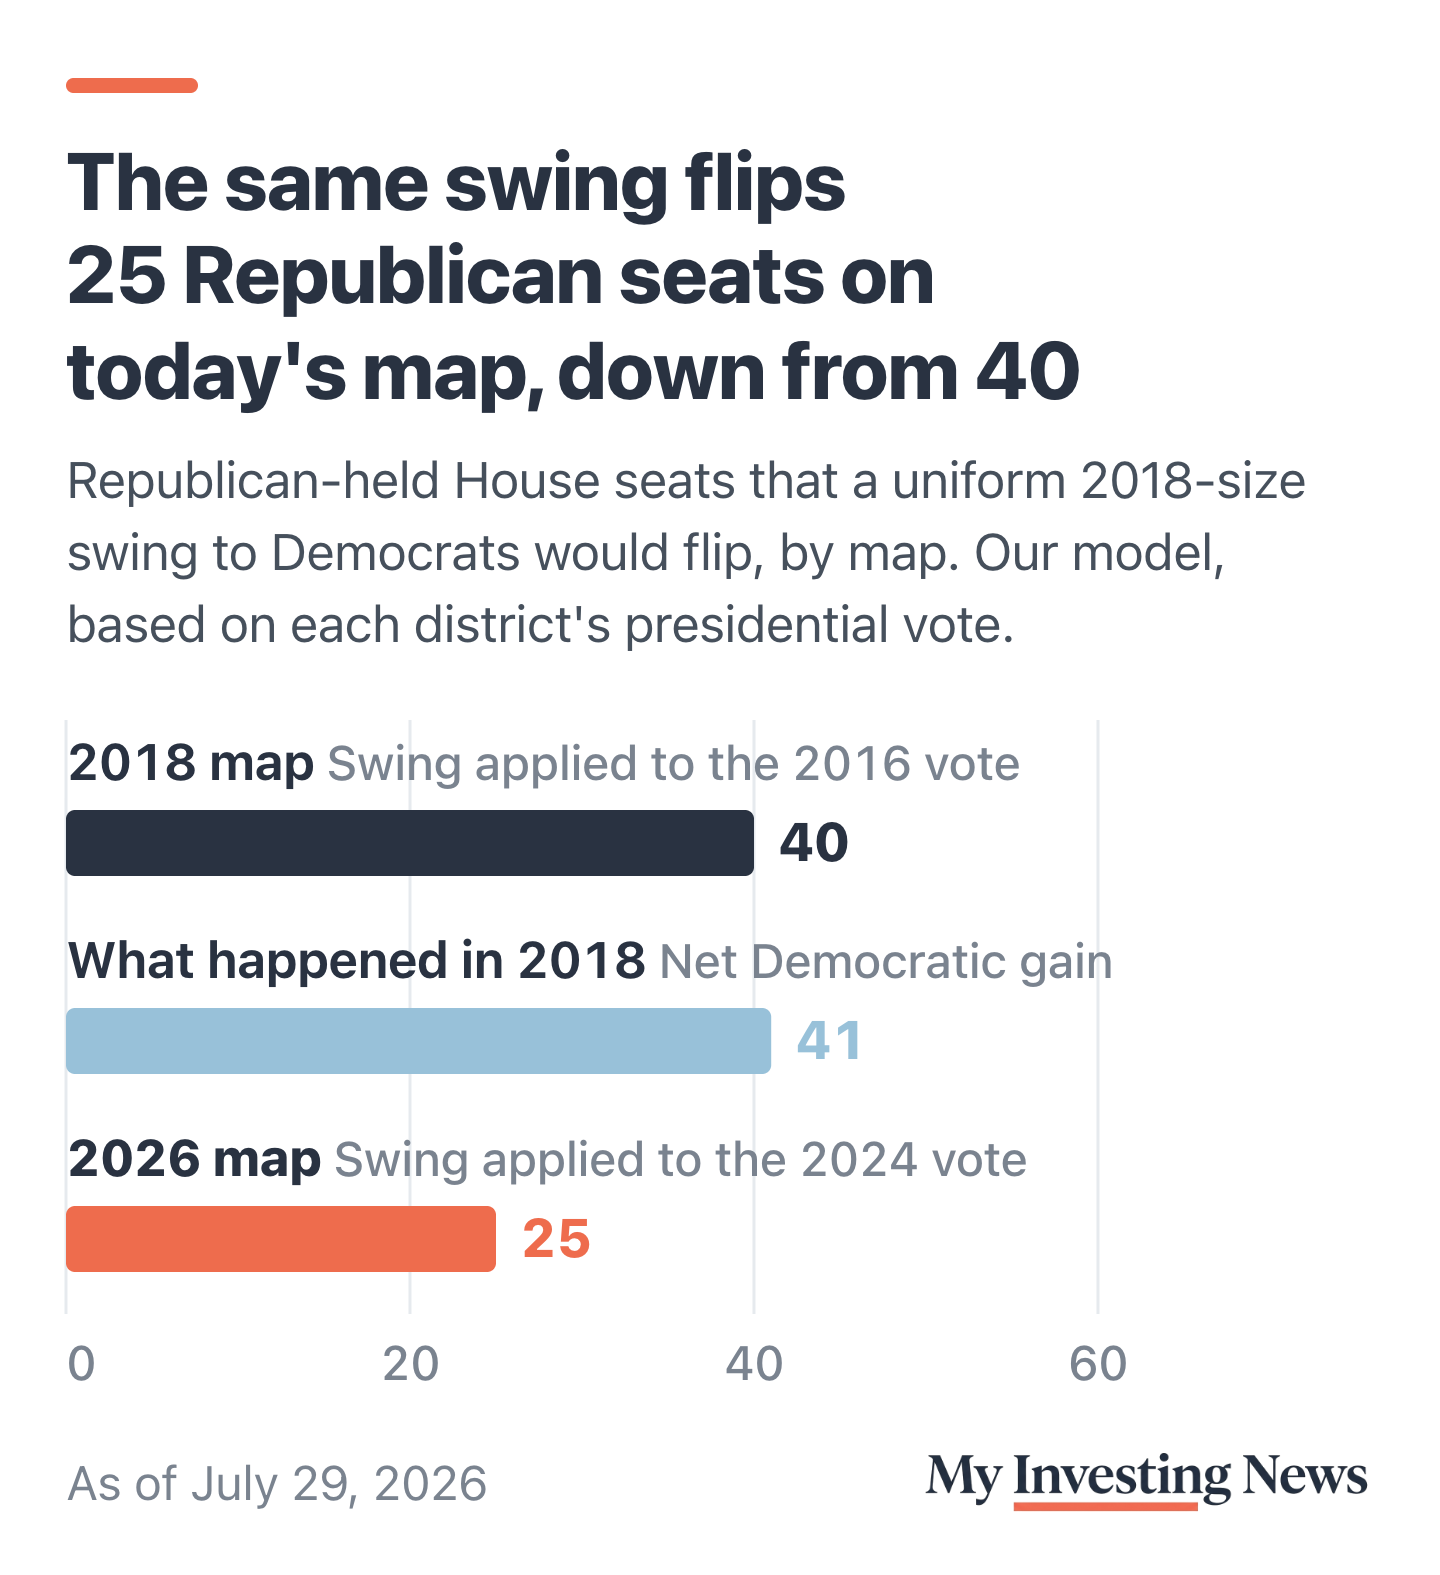
On the 2018 map, using the 2016 presidential vote, the model flips 40 Republican seats. Democrats actually gained 41, so the model tracks what happened. On the 2026 map, a 2018-size swing from the 2024 House vote, which Republicans won by 2.6 points, flips 25. That is 38% fewer, close to what Wingrove described.
The House map in four numbers
The reason is who holds the swing seats now. Of the 78 on the 2026 map, Democrats hold 49 and Republicans 28, so a wave has fewer Republican targets to knock over. Wingrove’s 10-point line shows the same thing. There are 31 districts on the new maps that Donald Trump carried by less than 10 points in 2024, against 41 on the 2018 lines in 2016.
Redistricting also moved 15 Democratic-held seats, most of them in Texas, Florida and other redrawn states, into territory Trump won by more than a 2018-size swing would cover. Even so, if every district followed its presidential lean plus that swing, Democrats would end up with about 227 seats, down from 231 on the 2018 map but above the 218 needed for a majority.
What Bettors Expect
Wingrove’s last point was that this year’s swing could be bigger than 2018’s. Bettors on Polymarket put Democrats’ odds of winning the House at 91.5% as of Oct. 27. On the House popular vote, the single most likely outcome in Polymarket’s market was a Democratic win by 8 to 10 points, priced at 26%. Repeating 2018’s 8.6-point margin would be a bigger swing than 2018’s, measured from 2024, and in our model it flips 31 Republican seats.
Investors have their own midterm pattern to weigh, and stocks have just come through the usual midterm-year selloff.
What to Watch
The vote is Nov. 3. Most of the 25 seats in our model sit in Pennsylvania, Michigan, Wisconsin, Iowa, Arizona, Virginia and California, and early returns there will show whether the swing is near 2018’s size. Six of them are Republican-held seats that Kamala Harris carried in 2024. Missouri’s map is still in court; we used the lines it voted on in 2024, and a switch to its 2025 map could change the Missouri numbers. Then watch the districts Trump won by 10 to 12 points, the ones Wingrove says are no longer safe. If Democrats start winning those, the swing is bigger than 2018’s.
Wingrove says the House looks lost for Republicans and a 2018-size swing would flip fewer seats now. The seat math backs him: our model flips 25 Republican seats on today’s maps, against 40 on the 2018 map. Swing districts themselves aren’t fewer than in 2018, though. More of them are already held by Democrats, so a bigger wave may be needed to match 2018’s gains.