Where we heard itDonald Trump in a Fox News phone call on election night, Nov. 3, 2026, as reported by Business Insider; Vice President JD Vance’s reply, as read on CNBC’s Squawk on the Street, Nov. 4.
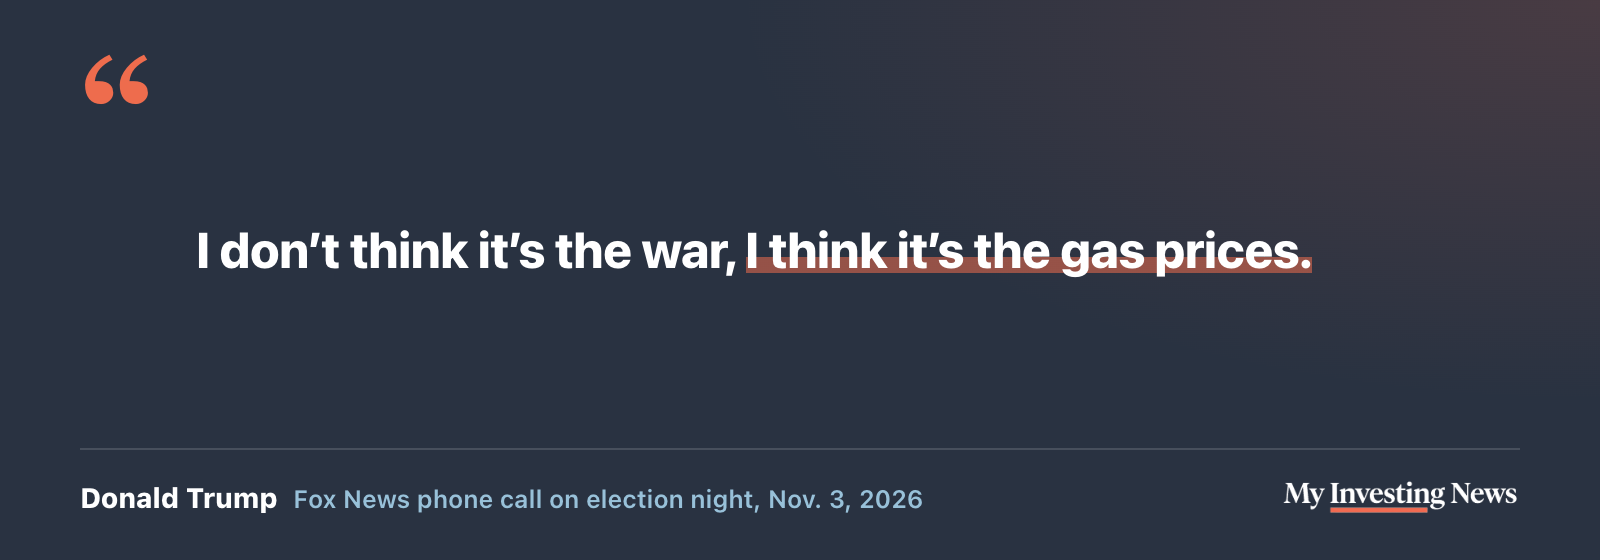
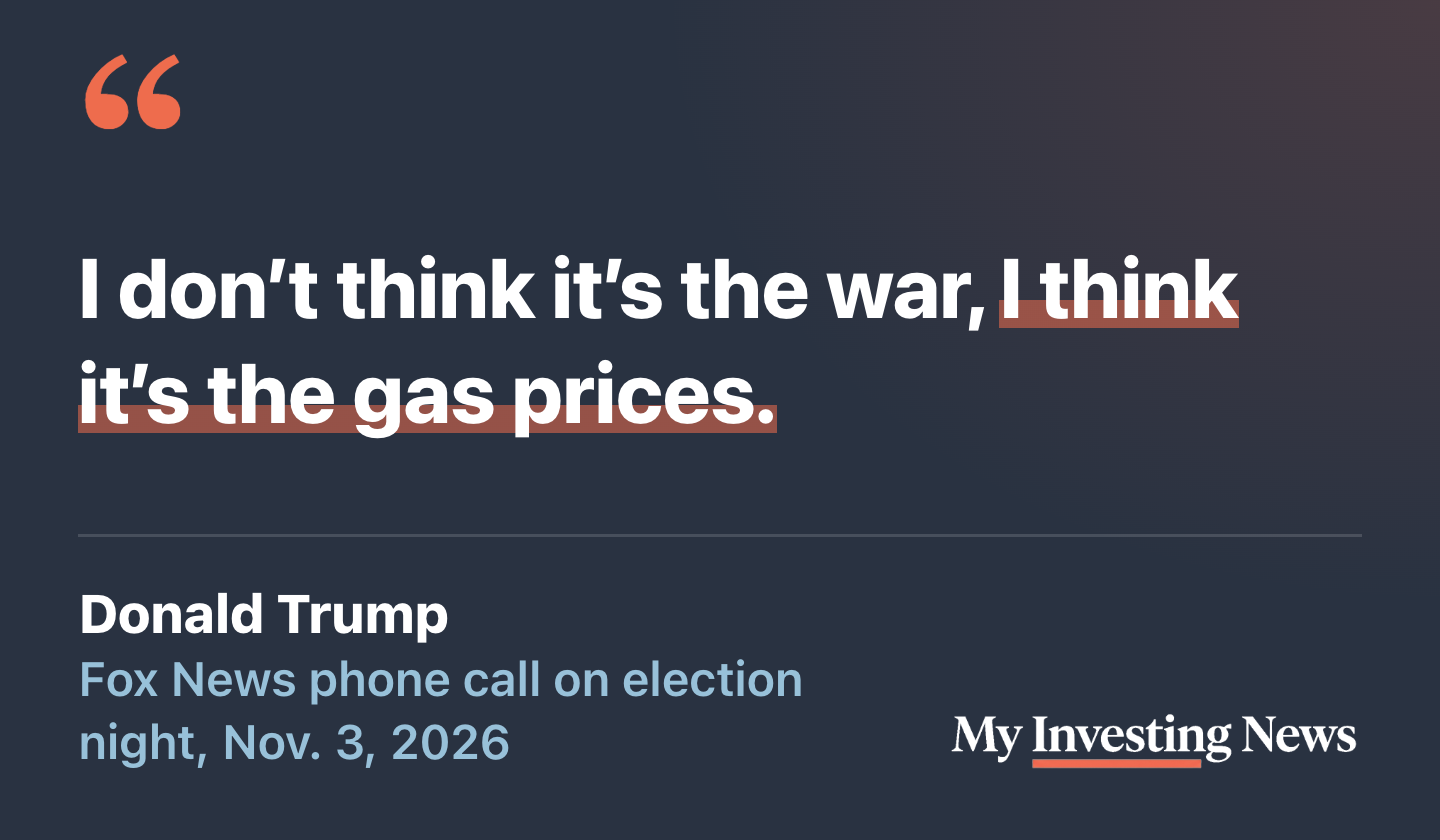
As the House slipped away from Republicans on election night, President Donald Trump offered his reason in a phone call with Fox News. “People agree with what I’m doing in Iran, but they really, probably weren’t willing to do the short-term consequence of paying more for gasoline,” he said, according to Business Insider. He called the higher prices “a short-term problem but for long-term gain.”
His vice president disagreed the next morning. In a social media post that CNBC’s Megan Cassella read on air, JD Vance wrote, “The reason we lost is the war,” and added that “everyone knows why we lost.” As of the Associated Press count on Nov. 9, Republicans had lost at least 39 House seats, with 18 races still uncalled, a loss David Sacks called the biggest midterm loss since Watergate. The two explanations overlap, since the war is what pushed gas up. So we tested the part of Trump’s claim the record can check: do gas prices move midterms?
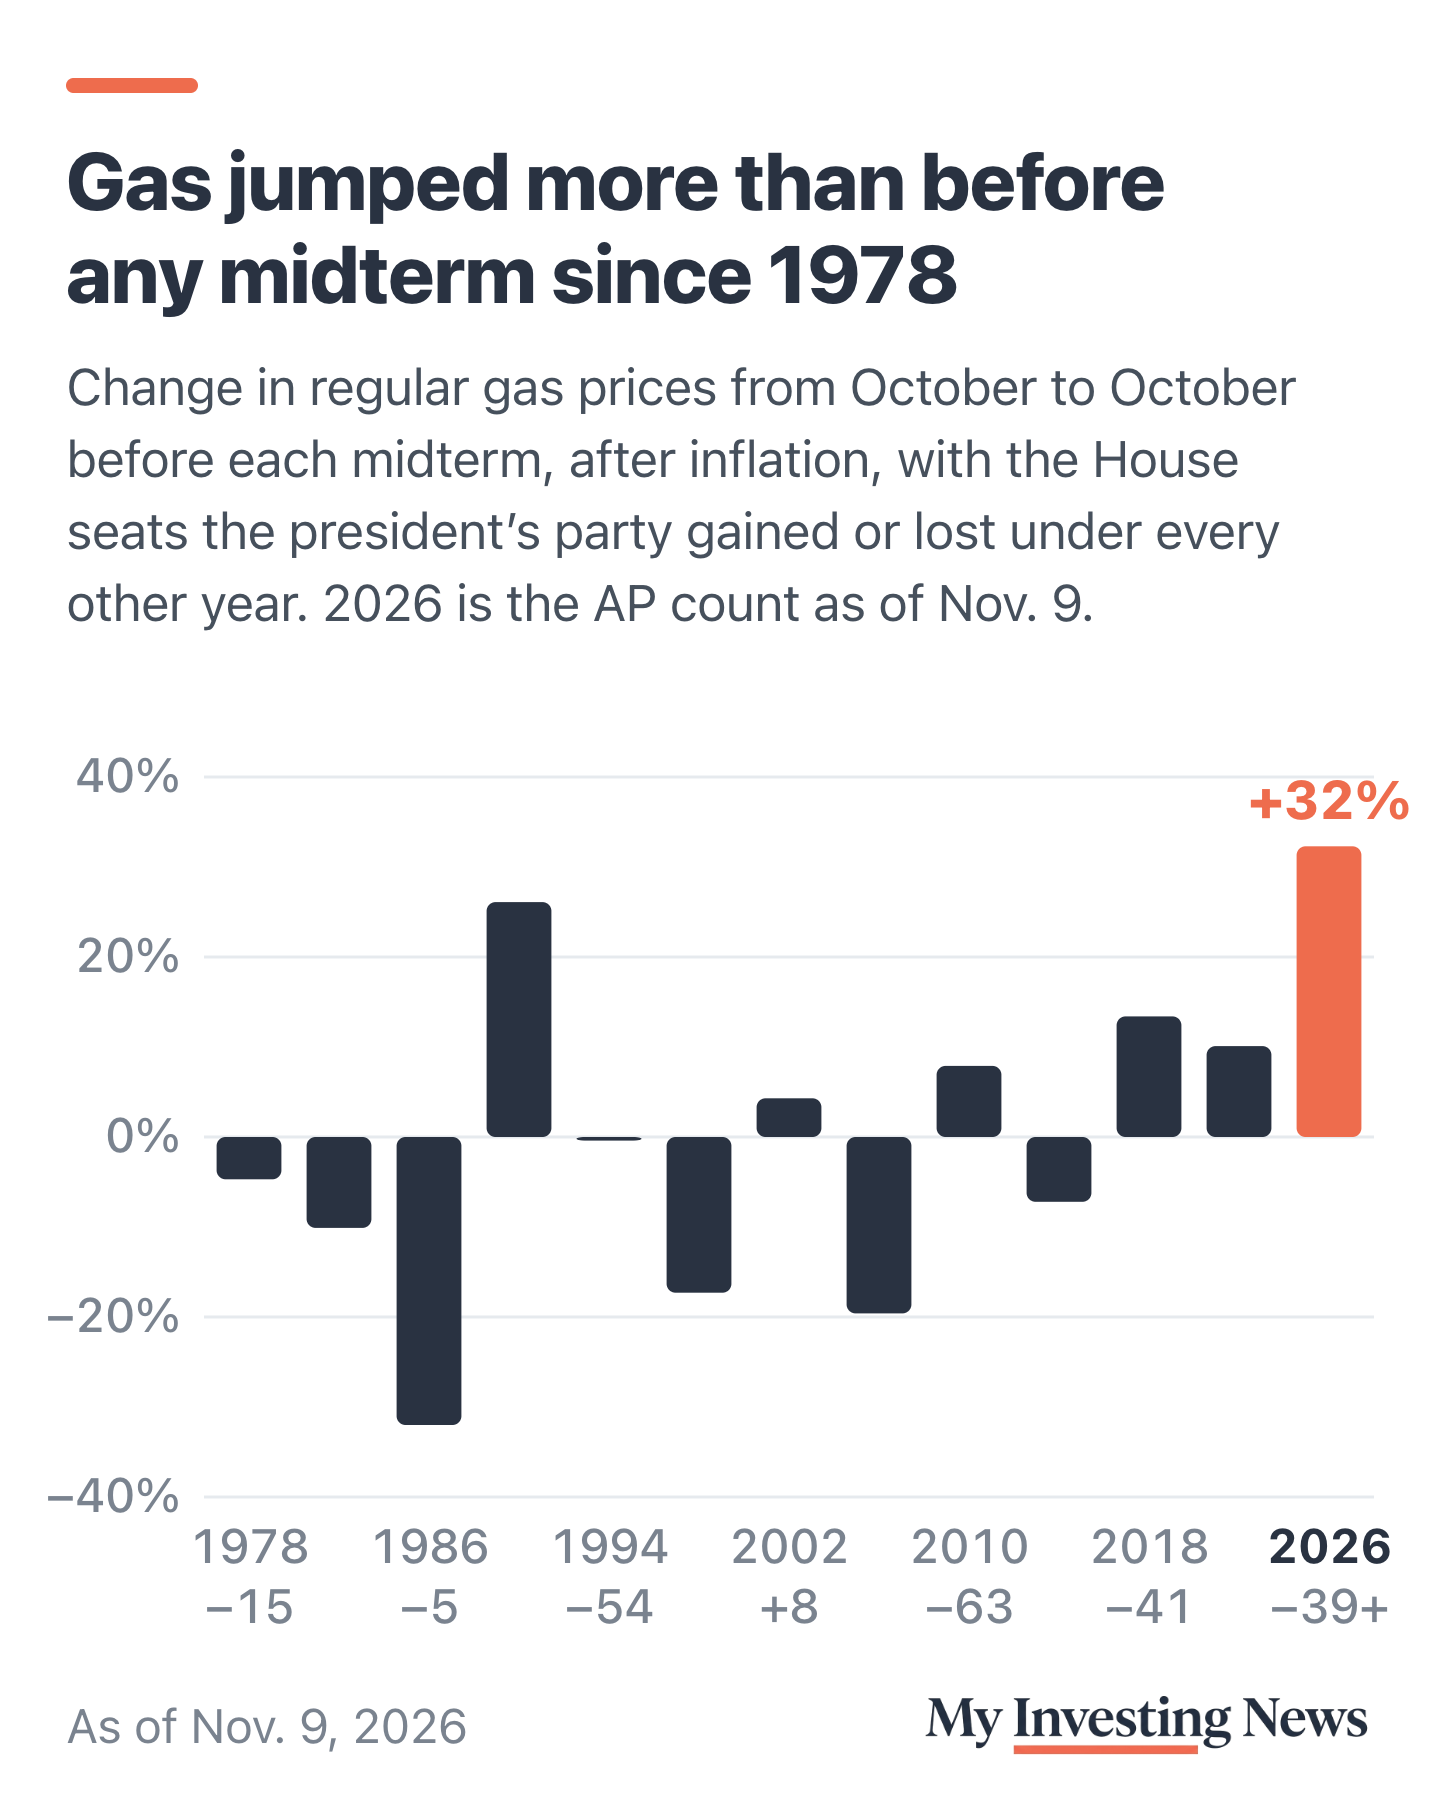
The Biggest Gas Jump Before Any Midterm Since 1978
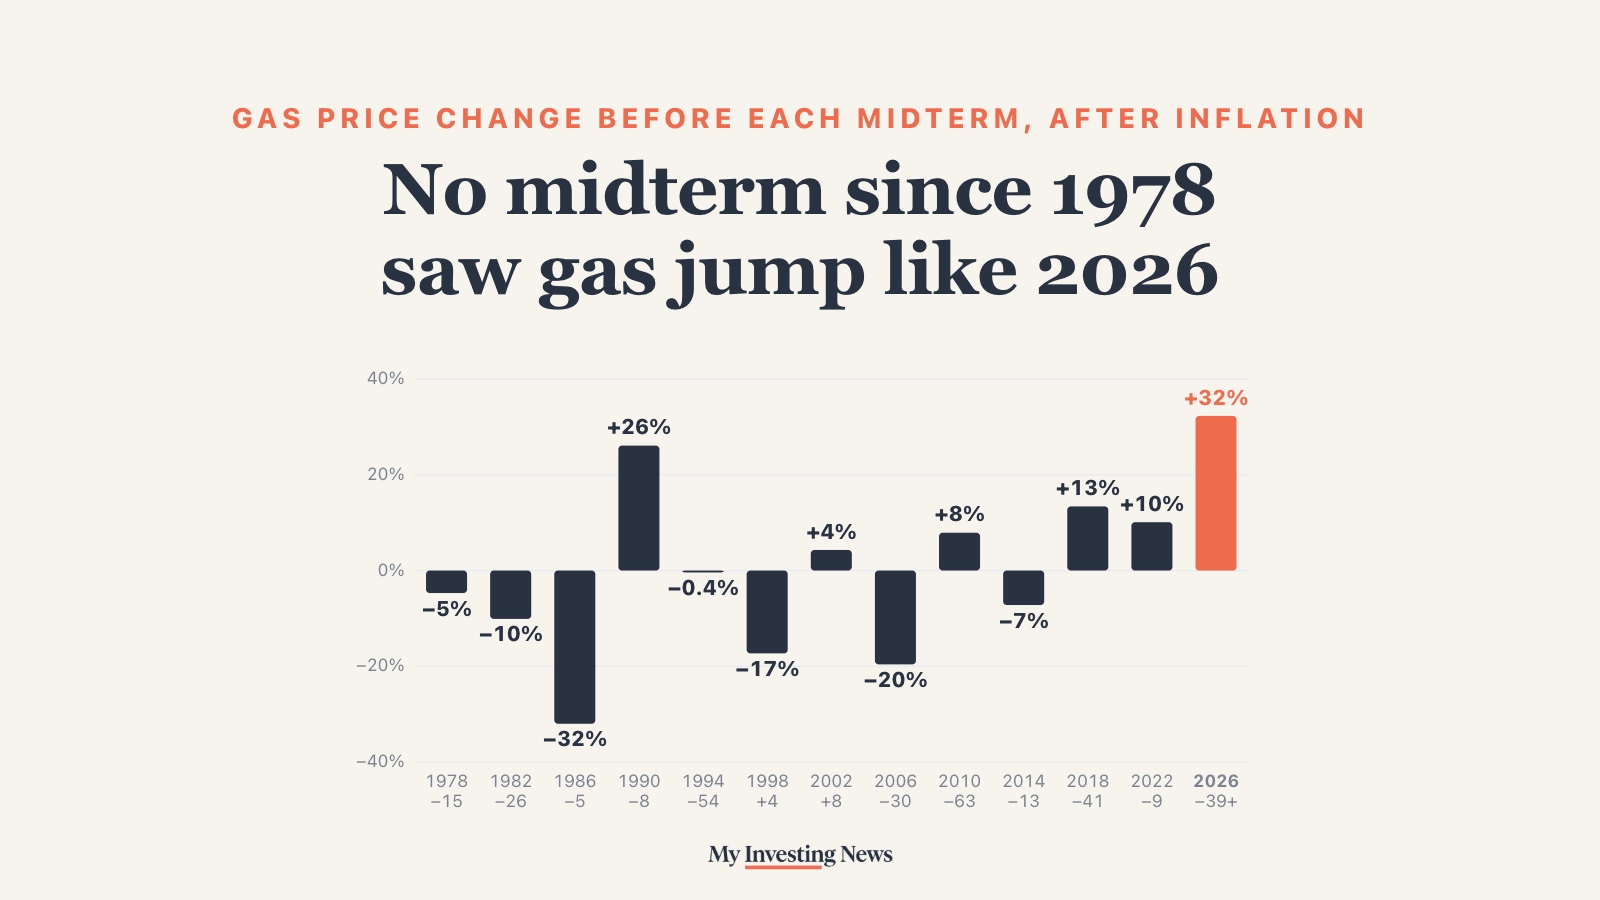
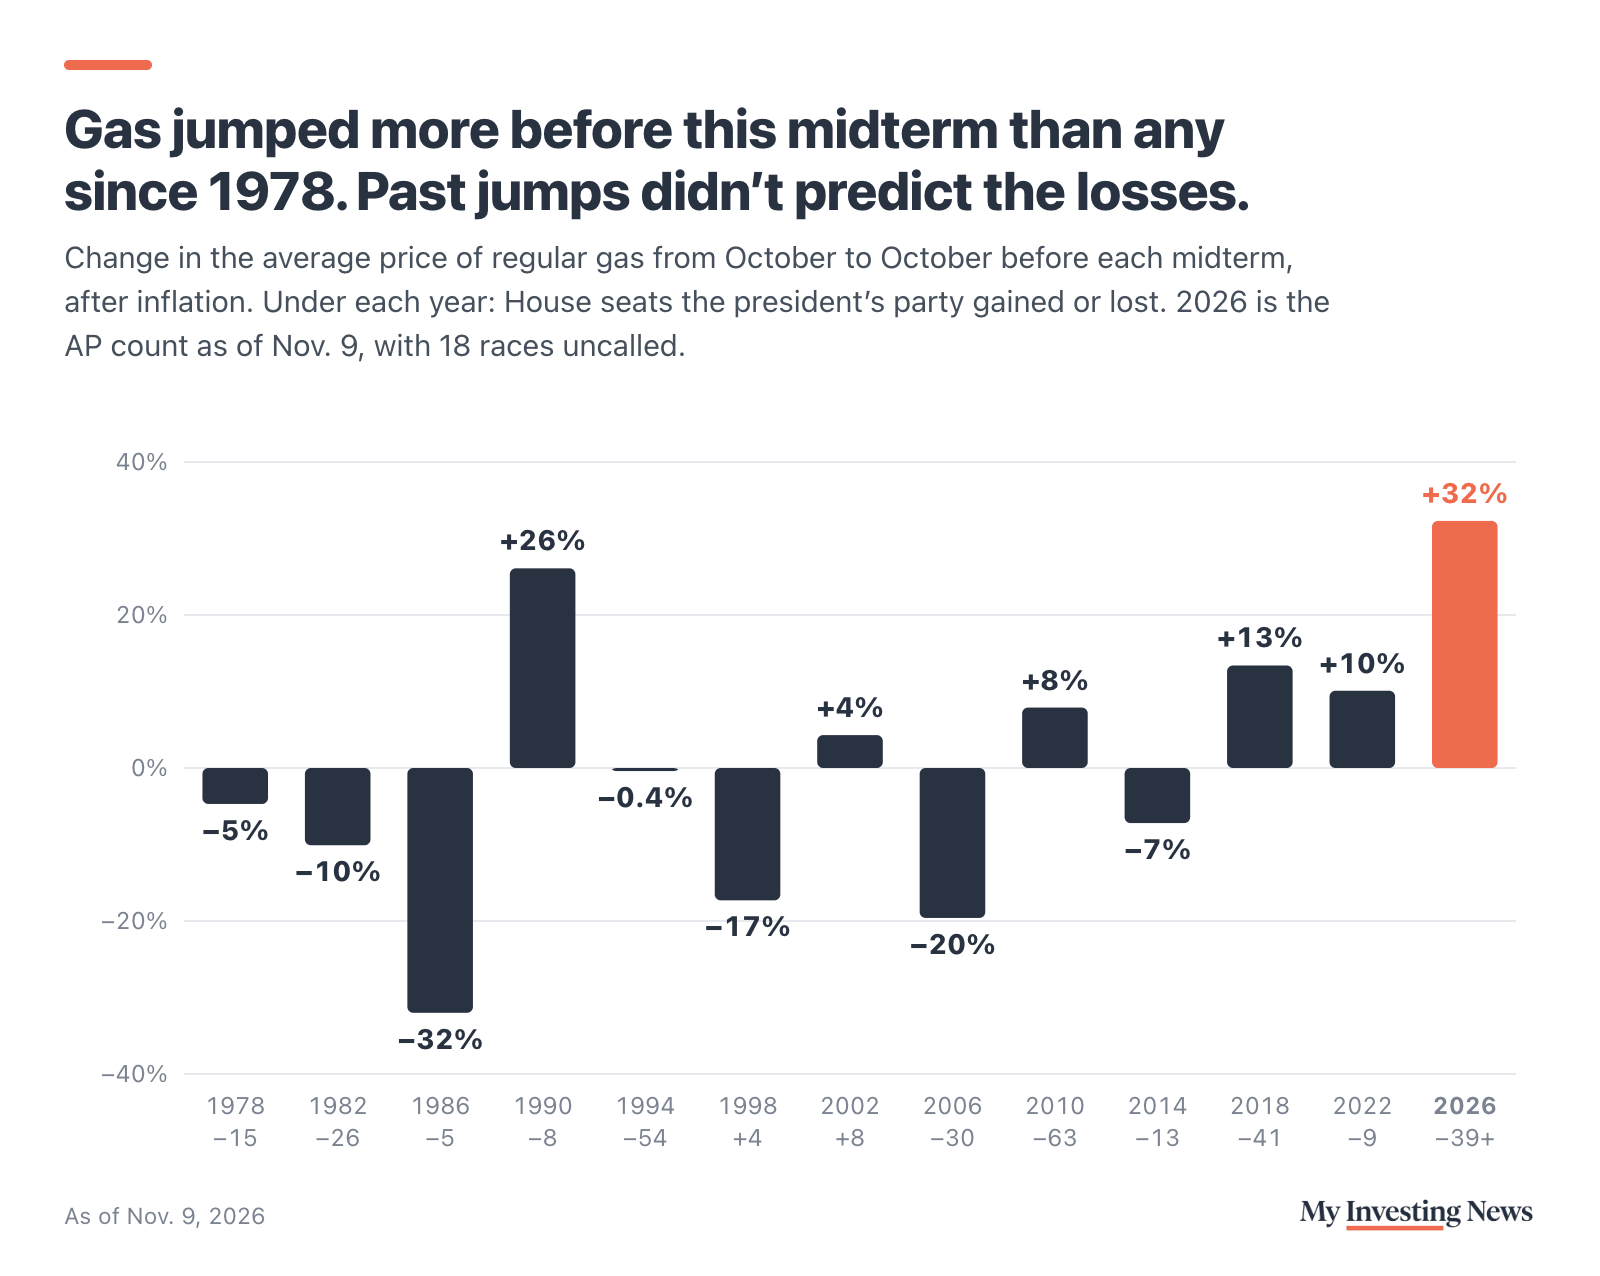
Trump is right that this year’s rise was unusual. The average price of regular gas in October was $4.45 a gallon, according to the Bureau of Labor Statistics, up 37.5% from $3.24 a year earlier. After inflation, it rose 32%. The Energy Information Administration’s weekly survey shows the same thing: $4.15 in the week before Election Day, up 38% from a year before, after a peak of $4.50 in May. In pump prices, this fall set records for the season.
We compared the October price with the October before for every midterm since 1978, the first one the BLS price series fully covers. No midterm in that stretch came after a jump this big, in pump prices or after inflation. The closest was 1990, when Iraq’s invasion of Kuwait sent gas up 34% (26% after inflation). President George H.W. Bush’s party lost eight House seats that year.
What the Record Shows
Across the 12 midterms from 1978 to 2022, the president’s party lost an average of 21 House seats. In the five where gas rose after inflation, it lost 23 on average. In the seven where gas fell, it lost 20. That gap is small, and the individual years point in every direction.
Democrats lost 63 seats in 2010, the biggest loss in the record, when gas was up 8% after inflation. Republicans lost 30 in 2006 even though gas had fallen 20%. In 1986 gas fell 32% and Ronald Reagan’s party lost five. In 2022, with gas up 19% at the pump, Democrats lost just nine. Measured in pump prices without the inflation adjustment, the averages spread to 26 seats when gas rose and 14 when it fell, but that gap rests on 1994 and 2010, two big Democratic losses in years when gas barely moved.
The 2026 midterm by the numbers
Approval Did the Work
A better guide in the same 12 elections was the president’s approval rating. When his last Gallup reading before the vote was under 50%, his party lost an average of 31 seats. When it was 50% or higher, as in 1986, 1990, 1998 and 2002, the party lost one seat across all four elections combined. Approval also tracked the size of the result: on a scale where 1 is a perfect match and 0 is none, its correlation with the seat change was 0.58. For gas it was 0.20. Trump’s last Gallup reading in the American Presidency Project’s midterm table, from late August, was 33%, the lowest before any of the 13 midterms since 1978. George W. Bush was at 37% before his party lost 30 seats in 2006.
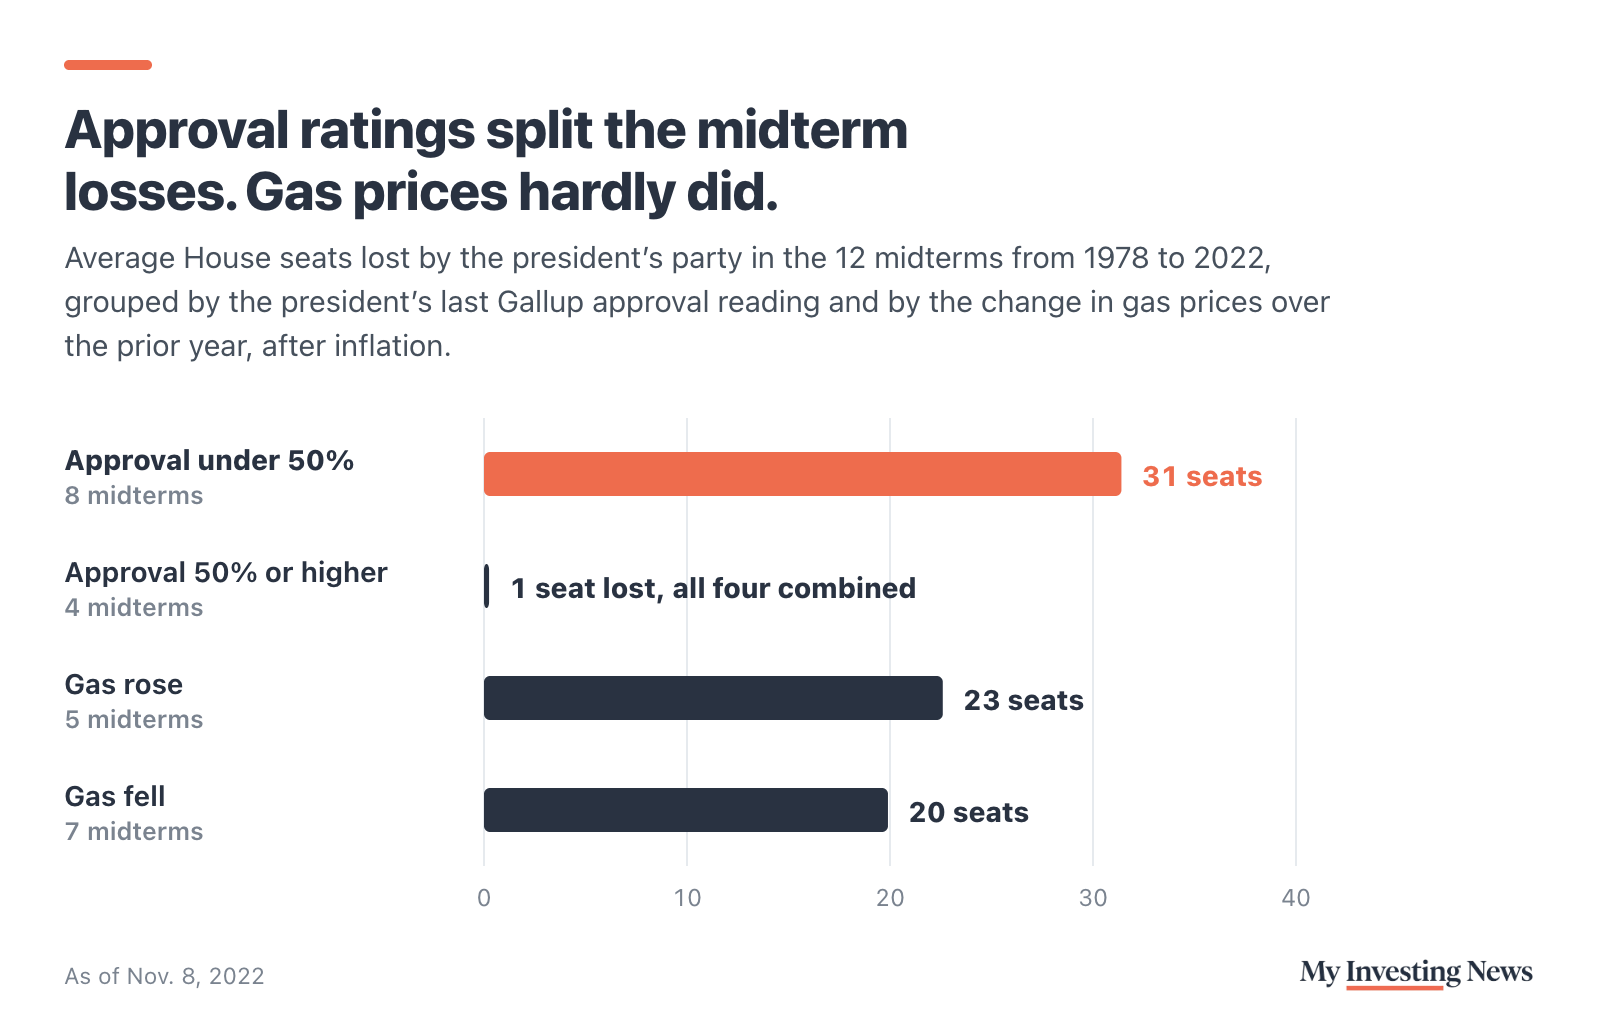
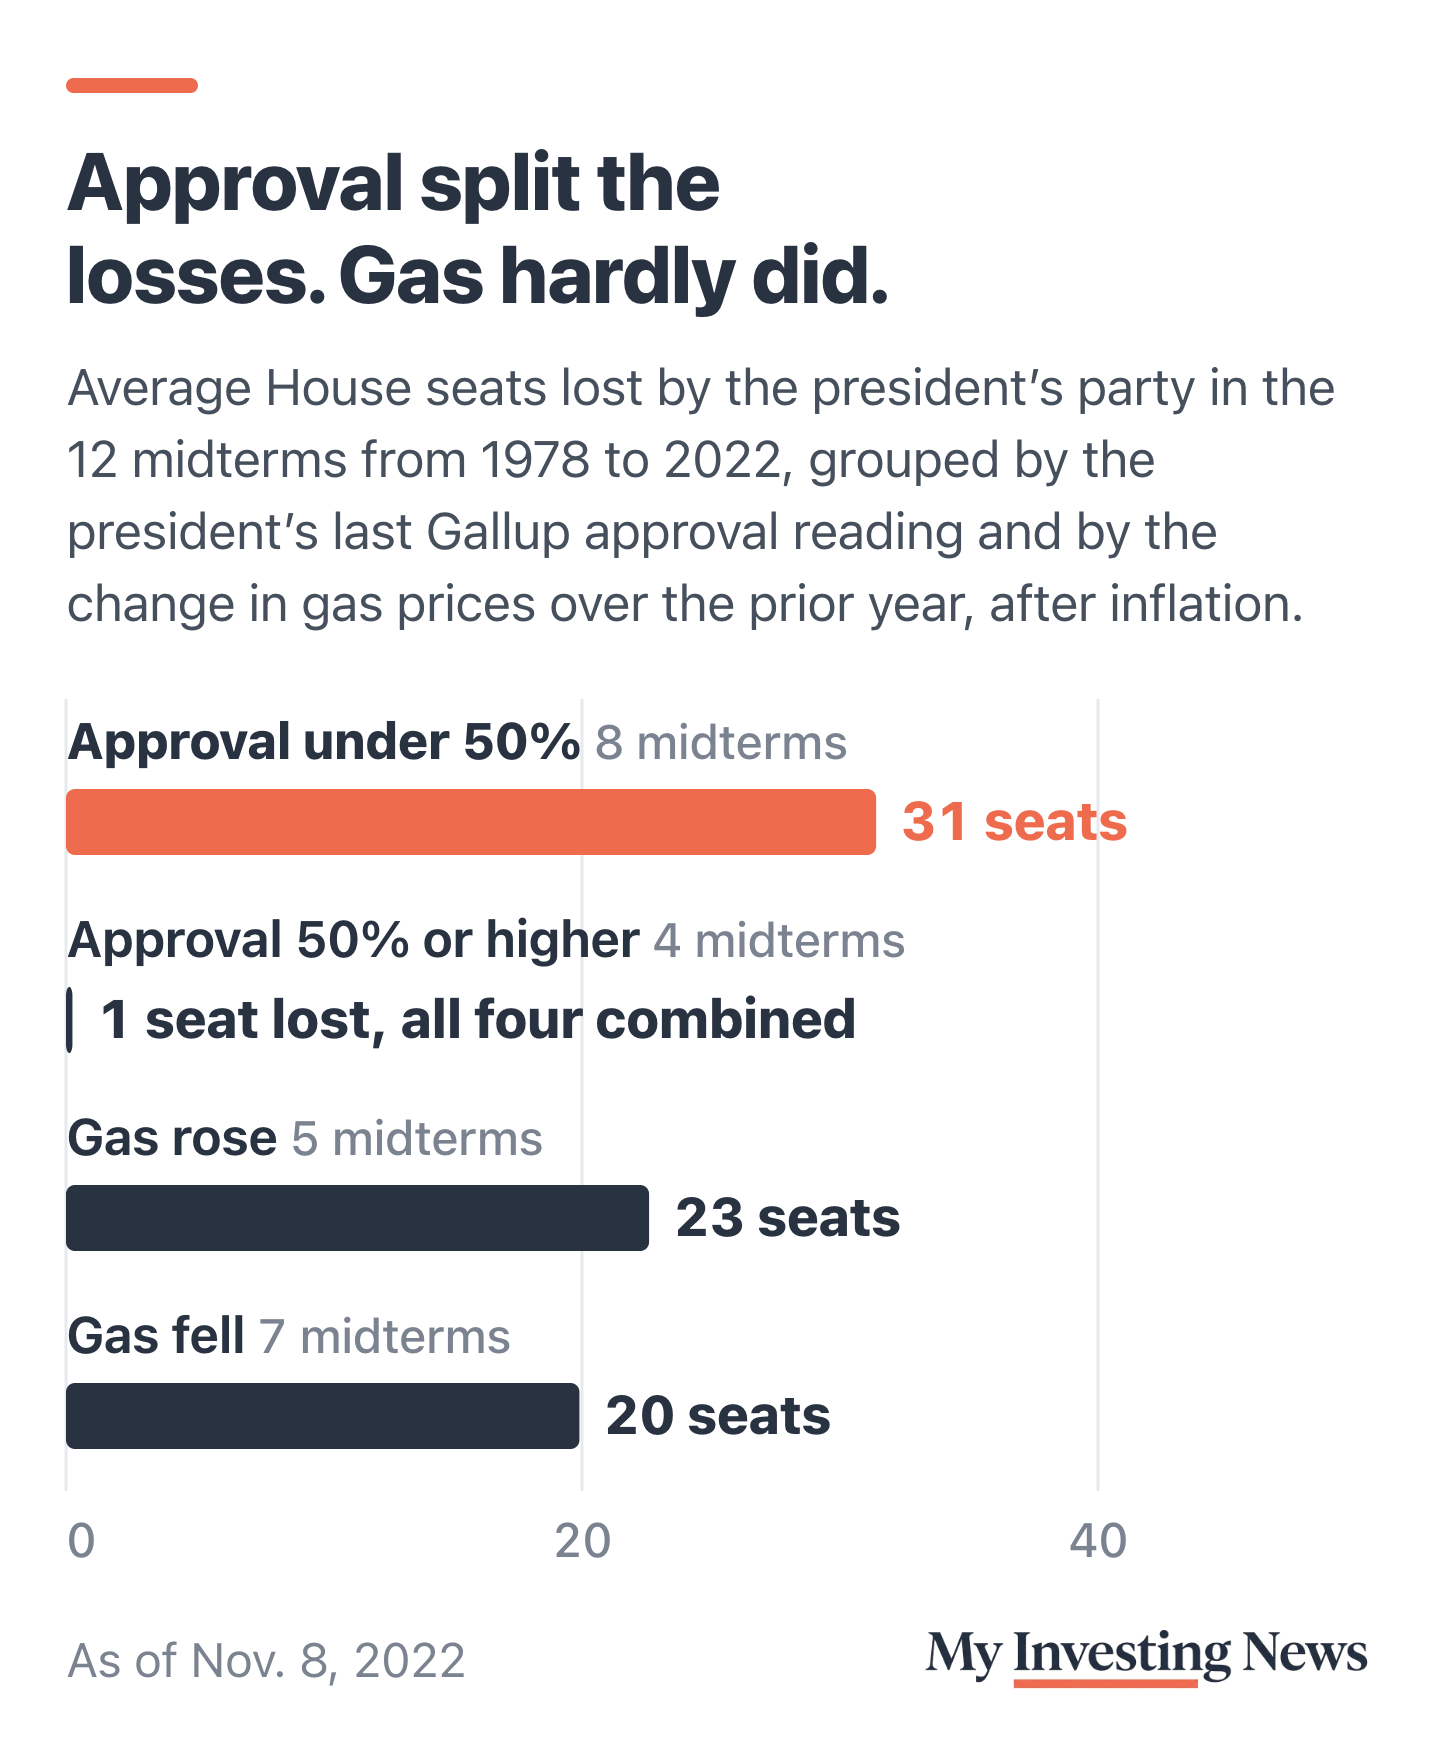
None of this clears gas prices. A price jump this large can drag down a president’s approval, so the two are tangled. But on the record since 1978, the price at the pump alone has not told you how a midterm would go. How voters felt about the president has. Twelve elections is a small sample, so the pattern is a guide, and the 2026 result will add a 13th data point with the largest gas jump of all.
What to Watch
The final House count: with 18 races uncalled as of Nov. 9, the Republican loss could land anywhere from 39 to 57 seats. Before the vote, Bloomberg’s Josh Wingrove argued that a 2018-size swing would flip fewer seats on this year’s maps, so the final number also tests that call. Then gas itself. The weekly price had already slipped from its May peak by Election Day. In September, Trump told reporters he expected Iran to seek an end to the war “immediately after the election,” and said lower prices would “take a little bit longer than the midterm.” If prices keep falling while his approval stays low, that will say more about his explanation than anything he tells Fox News.
Trump blamed the midterm losses on gas, and gas did rise more in the year before this election, 32% after inflation, than before any midterm since 1978. But in the 12 midterms before it, gas prices barely tracked House losses, while presidents under 50% approval lost 31 seats on average and those above it lost almost none.