Where we heard itThe Pomp Podcast, “Bitcoin Beats Stocks for the Next 5 Years? | Jordi Visser,” posted Nov. 7, 2026. Jordi Visser of 22V Research, interviewed by Anthony Pompliano (episode).
Bitcoin has spent most of its life as the wildest thing in a portfolio. Jordi Visser thinks that has flipped. On The Pomp Podcast, in an episode posted Nov. 7, the macro investor, who runs 22V Research’s AI Macro Nexus service, pointed to a brutal session for chip stocks: “Nvidia was down about 10% today. Micron was down more than 10%.” Those moves match Nov. 5, when NvidiaNVDA fell 9.3% and MicronMU 17.5% as the S&P 500 dropped 4.4%.
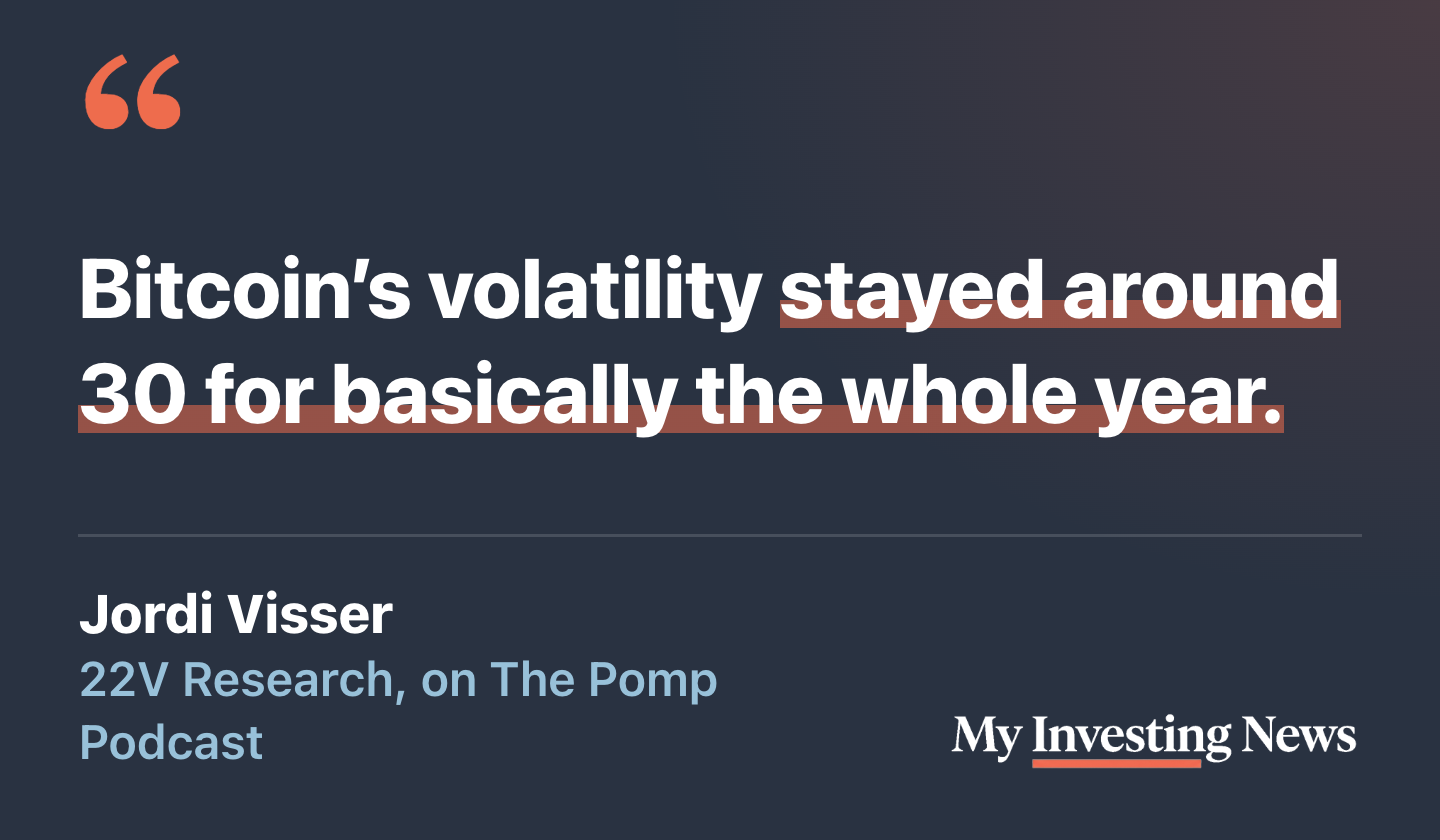
Visser said the volatility inside the AI trade is “so much higher than Bitcoin, and this was not the case before.” He put a number on bitcoin’s side of it:

What We Measured
Volatility is a measure of how big an asset’s daily price swings are, scaled to a yearly figure. A reading of 30 means daily moves that, over a year, would typically add up to a swing of about 30% in either direction. We computed 30-day realized volatility for bitcoin, Nvidia and the SPDR S&P 500 ETFSPY from Yahoo Finance daily closes, using the same U.S. trading days for all three so the numbers line up.
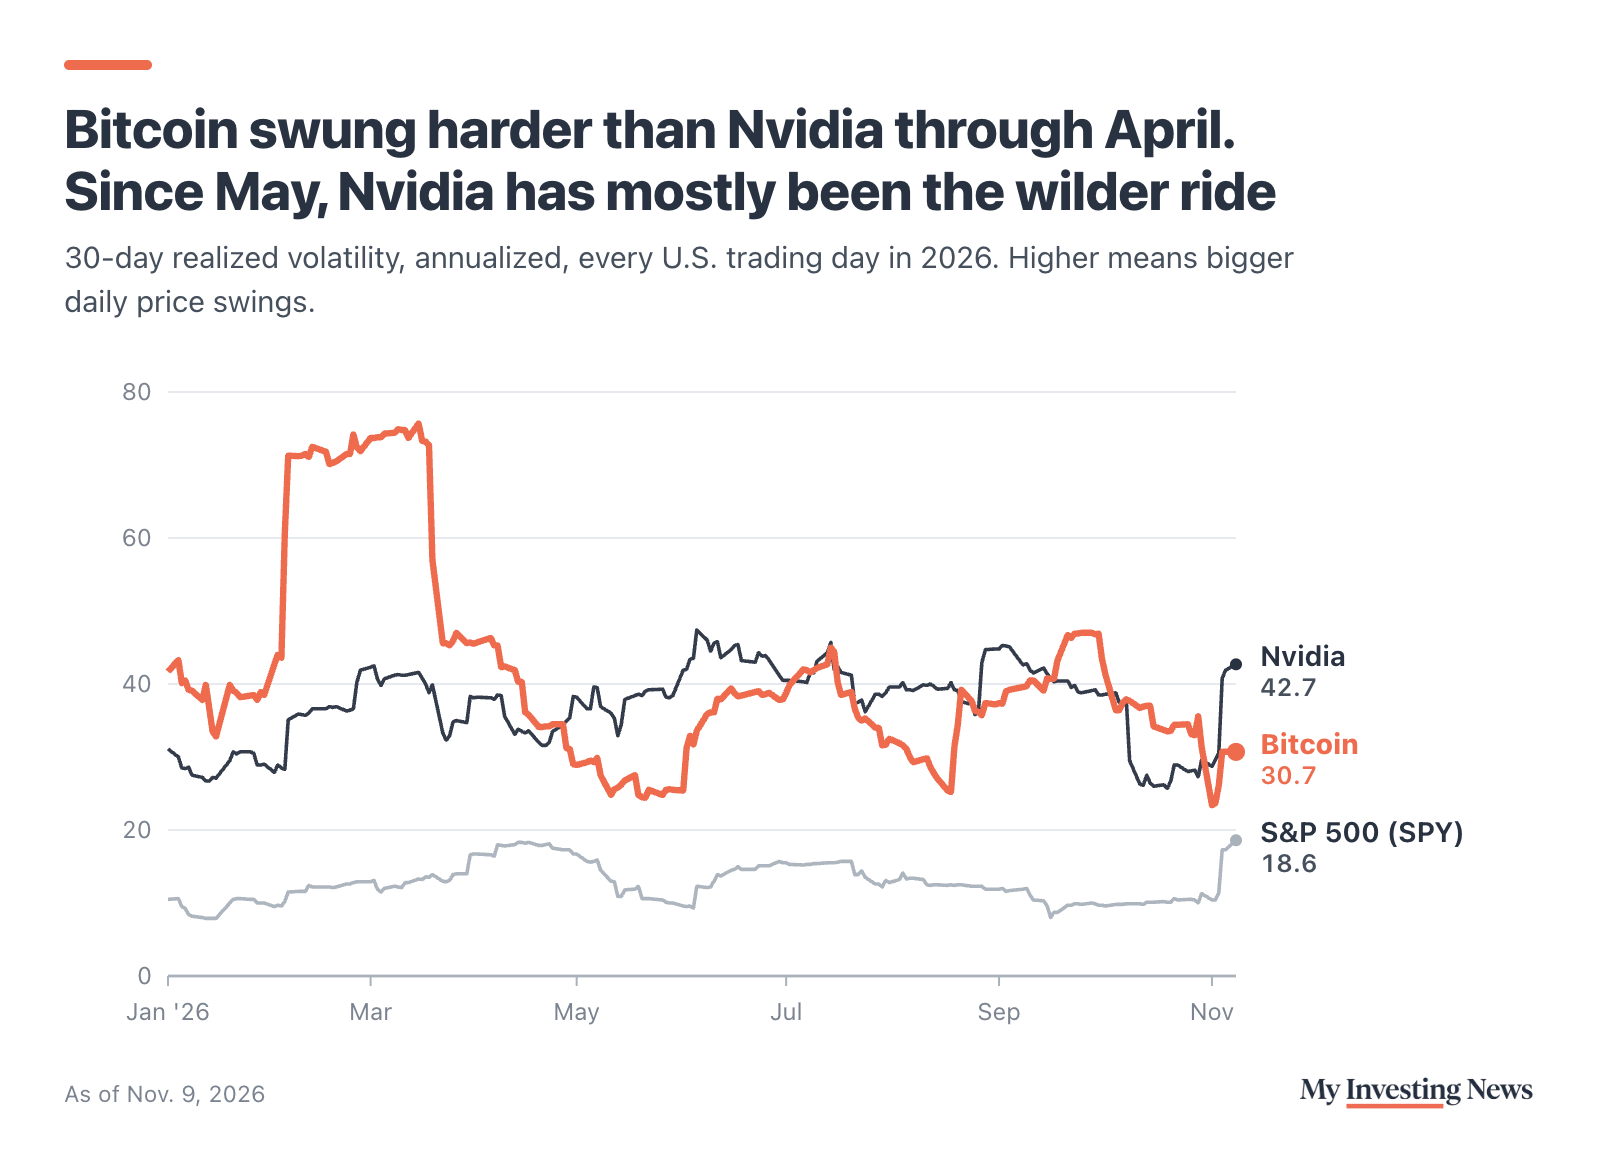
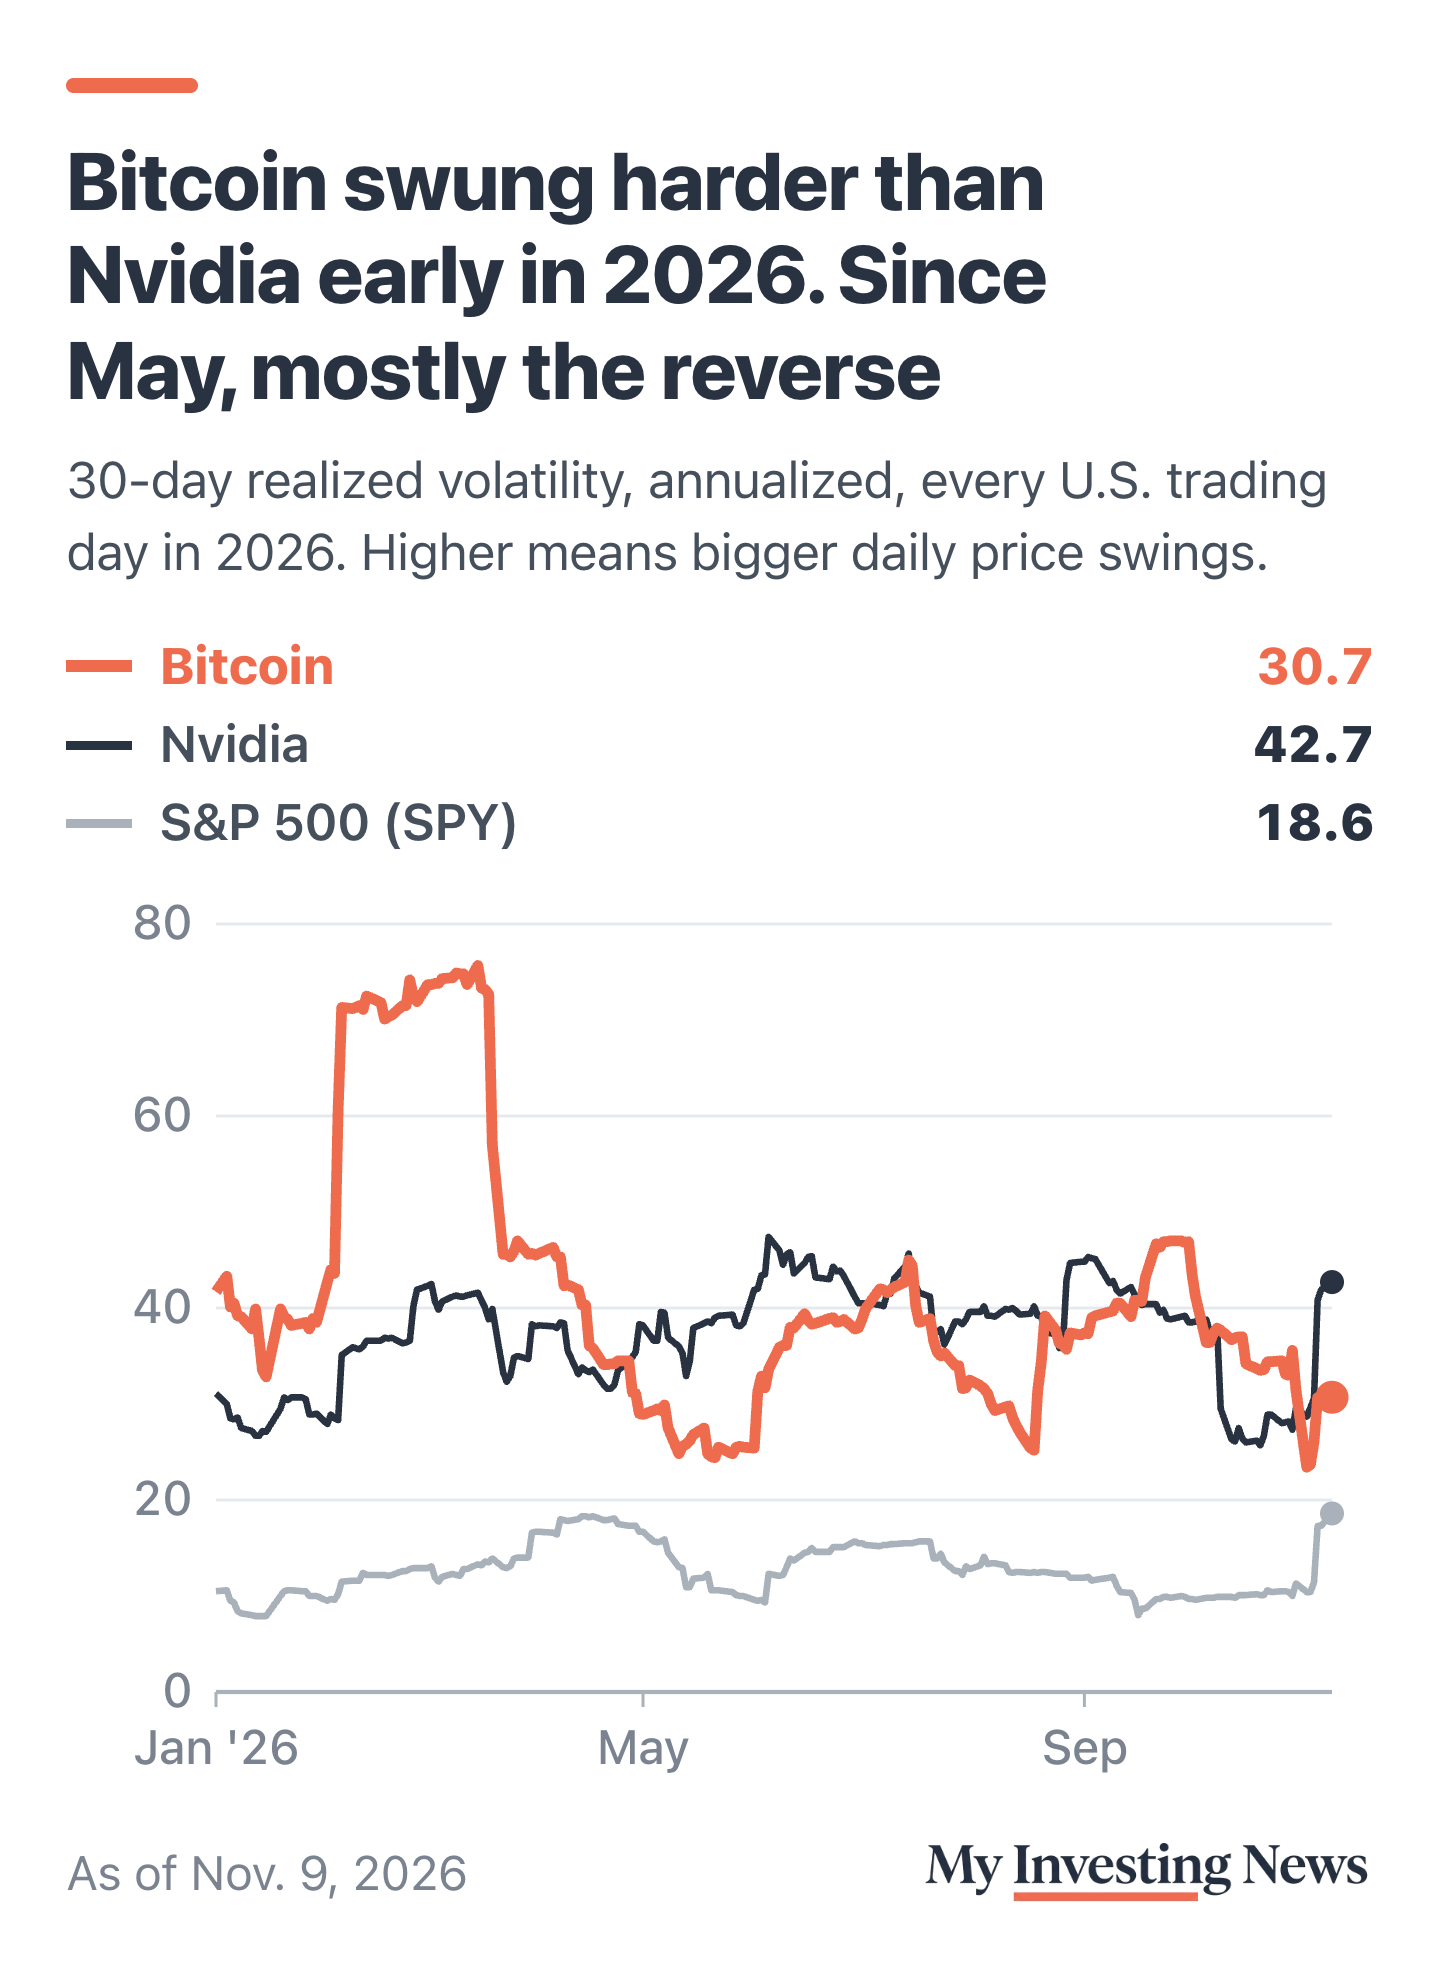
By that measure, bitcoin was not near 30 for the whole year. Its reading hit 76 on March 16, weeks after bitcoin fell 14% in a single day on Feb. 5, and stayed above 50 on 31 trading days. It sat between 25 and 35 on 64 of the year’s 215 trading days through Nov. 9. Its 2026 median was 38.4, the same as Nvidia’s.
Option traders’ forward-looking gauge tells a similar story. Deribit’s bitcoin volatility index, known as DVOL, never fell below 33.6 this year and stood at 39.9 on Nov. 9.
Where He’s Right
The second half of his claim holds up better. Through April, bitcoin swung harder than Nvidia on 79 of 82 trading days. Since May 1, it has been the calmer of the two on 95 of 133. As of the Nov. 9 close, bitcoin’s 30-day reading was 30.7, against 42.7 for Nvidia and 82.8 for Micron. Even the S&P 500 fund, at 18.6, was at its jumpiest level of the year.
Bitcoin also got close to his number. Its 2026 low came on Nov. 2, at 23.4, days before the chip sell-off. Bitcoin closed at $75,223 on Nov. 9, down 14.0% this year, so the calm has not come with gains. Tom Lee called Oct. 5 the bottom of the bitcoin cycle; bitcoin closed 12% below that day’s level on Nov. 9.
Bitcoin volatility, as of the Nov. 9 close
“This Was Not the Case Before”
The long record backs that line. From 2015 through 2021, bitcoin was calmer than Nvidia on 20% of trading days, and its median volatility was 65, against 37 for the chipmaker. Since the start of 2022, it has been the calmer one on 49% of days. Bitcoin’s median fell to 46, while Nvidia’s rose to 45. In every year since 2022, the two medians have been within about a point of each other.
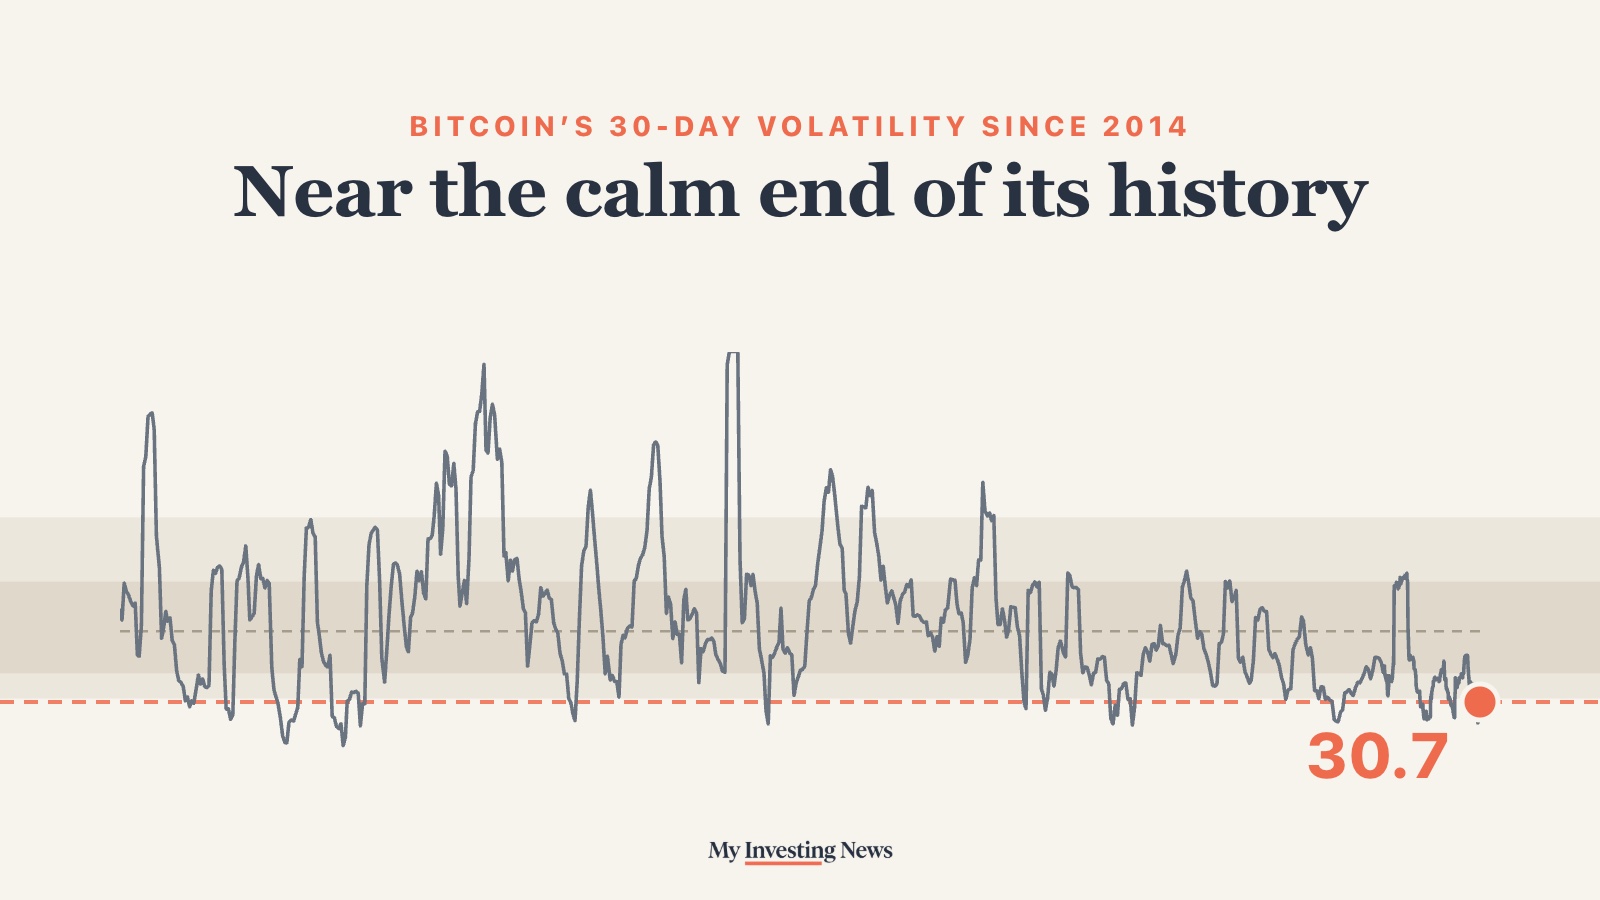
Measured against its own past, bitcoin’s current reading is low. Of 3,025 trading days since late October 2014, 92% had a higher reading than Nov. 9’s 30.7. The peak was 165 in April 2020, after the pandemic crash.
Bitcoin’s price swings are calmer than on 92% of trading days since 2014
Bitcoin’s 30-day realized volatility, annualized, on U.S. trading days since Oct. 29, 2014. The bands hold the middle half and middle 80% of all 3,025 readings; the dashed line is the median, 55.
Method matters at the edges. Counting weekend trading and annualizing over 365 days, bitcoin’s 2026 range runs from 22 to 85, and its Nov. 9 reading is 36. The picture is the same either way: a wild first quarter, then a long stretch near the bottom of its history. Stocks had a calm surface too: in mid-October, an RBC strategist called it a paddling duck market, with the VIX near the low end of its yearly range.
What to Watch
Nvidia is expected to report quarterly results on Nov. 17 after the close, according to Nasdaq. A big move either way would feed straight into its 30-day reading, and with it the gap Visser described. On bitcoin’s side, DVOL at 39.9 on Nov. 9 sat well above the 30.7 realized over the past 30 trading days, a sign that option buyers were paying for bigger swings ahead than bitcoin had just delivered.
Calm has not lasted long for bitcoin before. Its lowest readings of 2016, 2023 and 2025 were each followed by a reading above 50 within two to seven months. Visser’s case rests more on the other side of the comparison. He blamed the hyperscalers’ spending for the AI trade’s bigger swings: “When you start spending tons of money, you are taking lots of risk.”
Visser’s 30 is close to where bitcoin’s volatility sits now, at 30.7 on Nov. 9, but it misses the first quarter, when the reading hit 76. His larger point holds: since May, bitcoin has swung less than Nvidia on most days, and since 2022 the two have been about equally jumpy. A single earnings report or crypto sell-off can change a 30-day reading quickly.