Where we heard itMorgan Stanley’s “Thoughts on the Market” podcast, “Why the Bond Market Remains Calm After the Blue Wave,” Nov. 6, 2026, with Andrew Sheets, global head of fixed income research at Morgan Stanley.
Andrew Sheets thinks the bond market has made its peace with the blue wave. Speaking three days after Democrats won control of the House and the Senate, Morgan Stanley’s global head of fixed income research said the result “was generally seen as the more market negative outcome” before the vote, but that fixed income markets have “grown more comfortable” with it since.
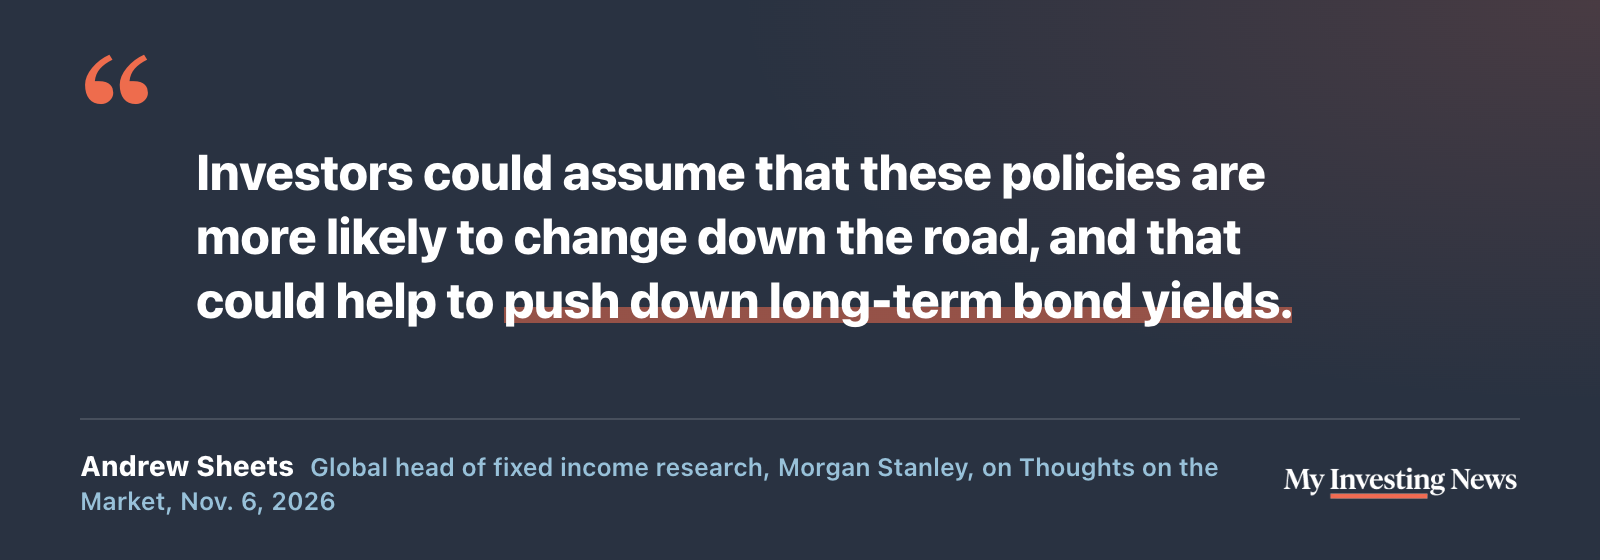
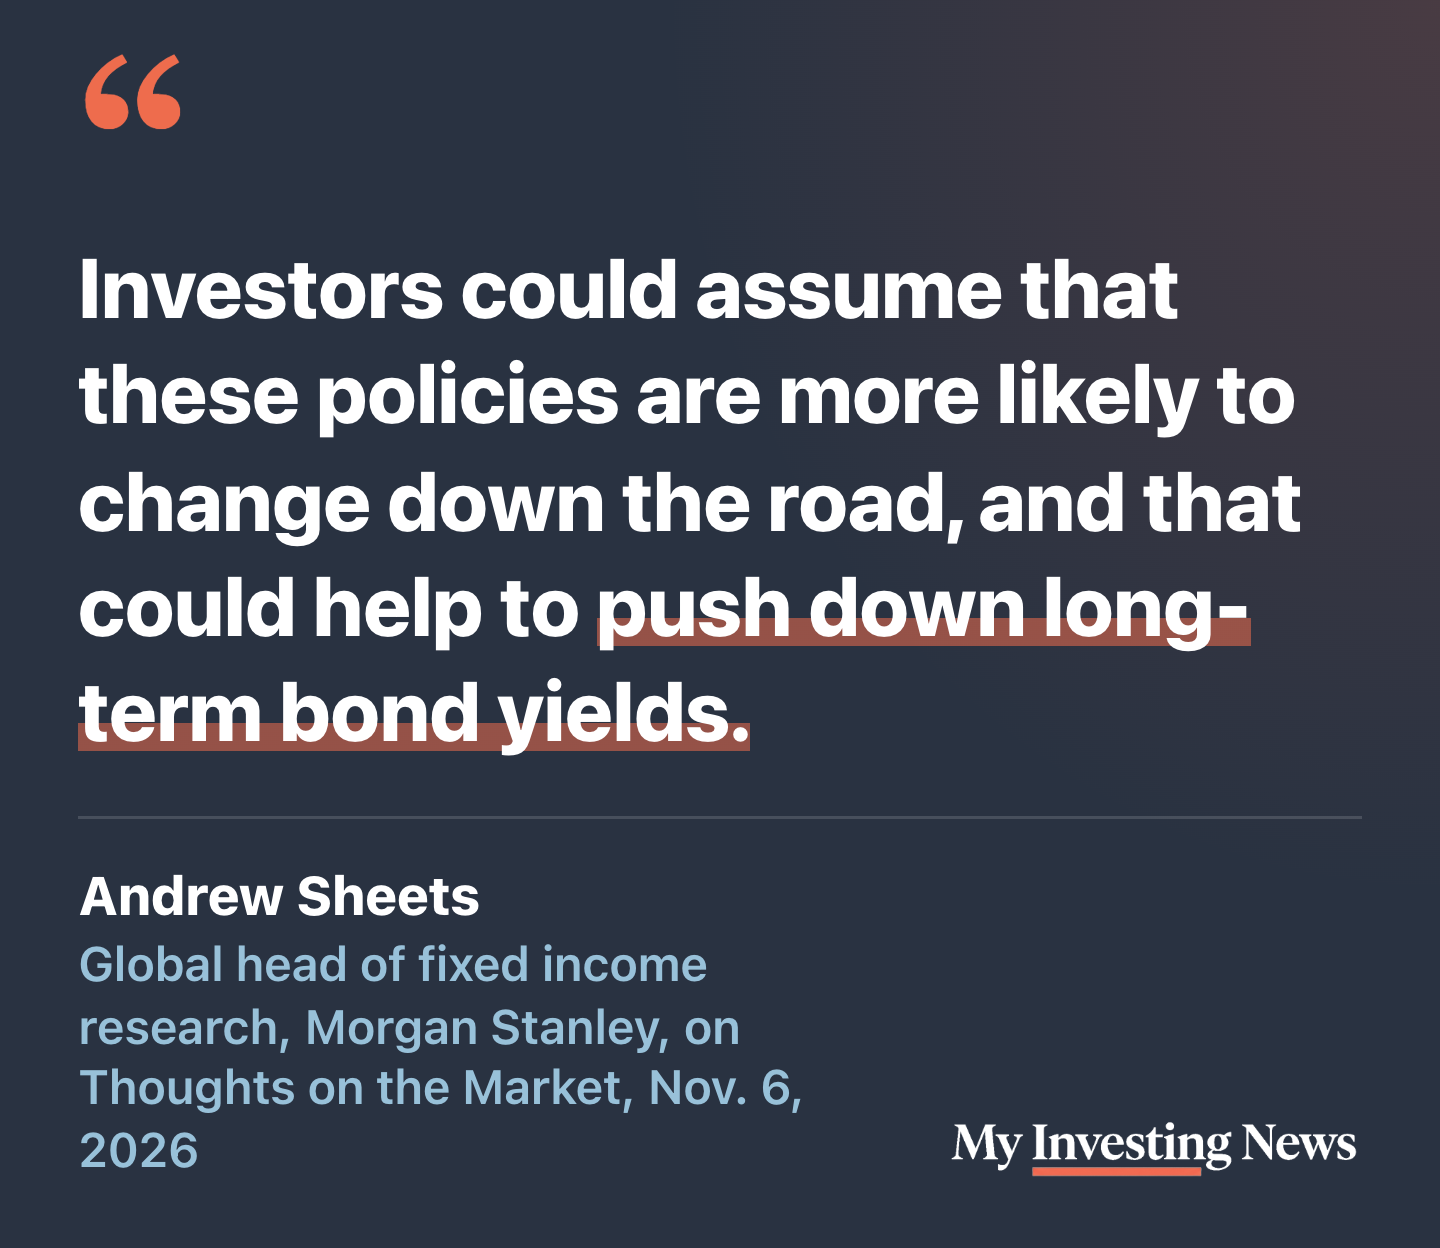
One reason, he said, is inflation, which tariffs and energy prices have kept “too high.” If investors read the vote as a verdict on tariffs or foreign policy, they may expect those policies to change, and that would be good for bonds.
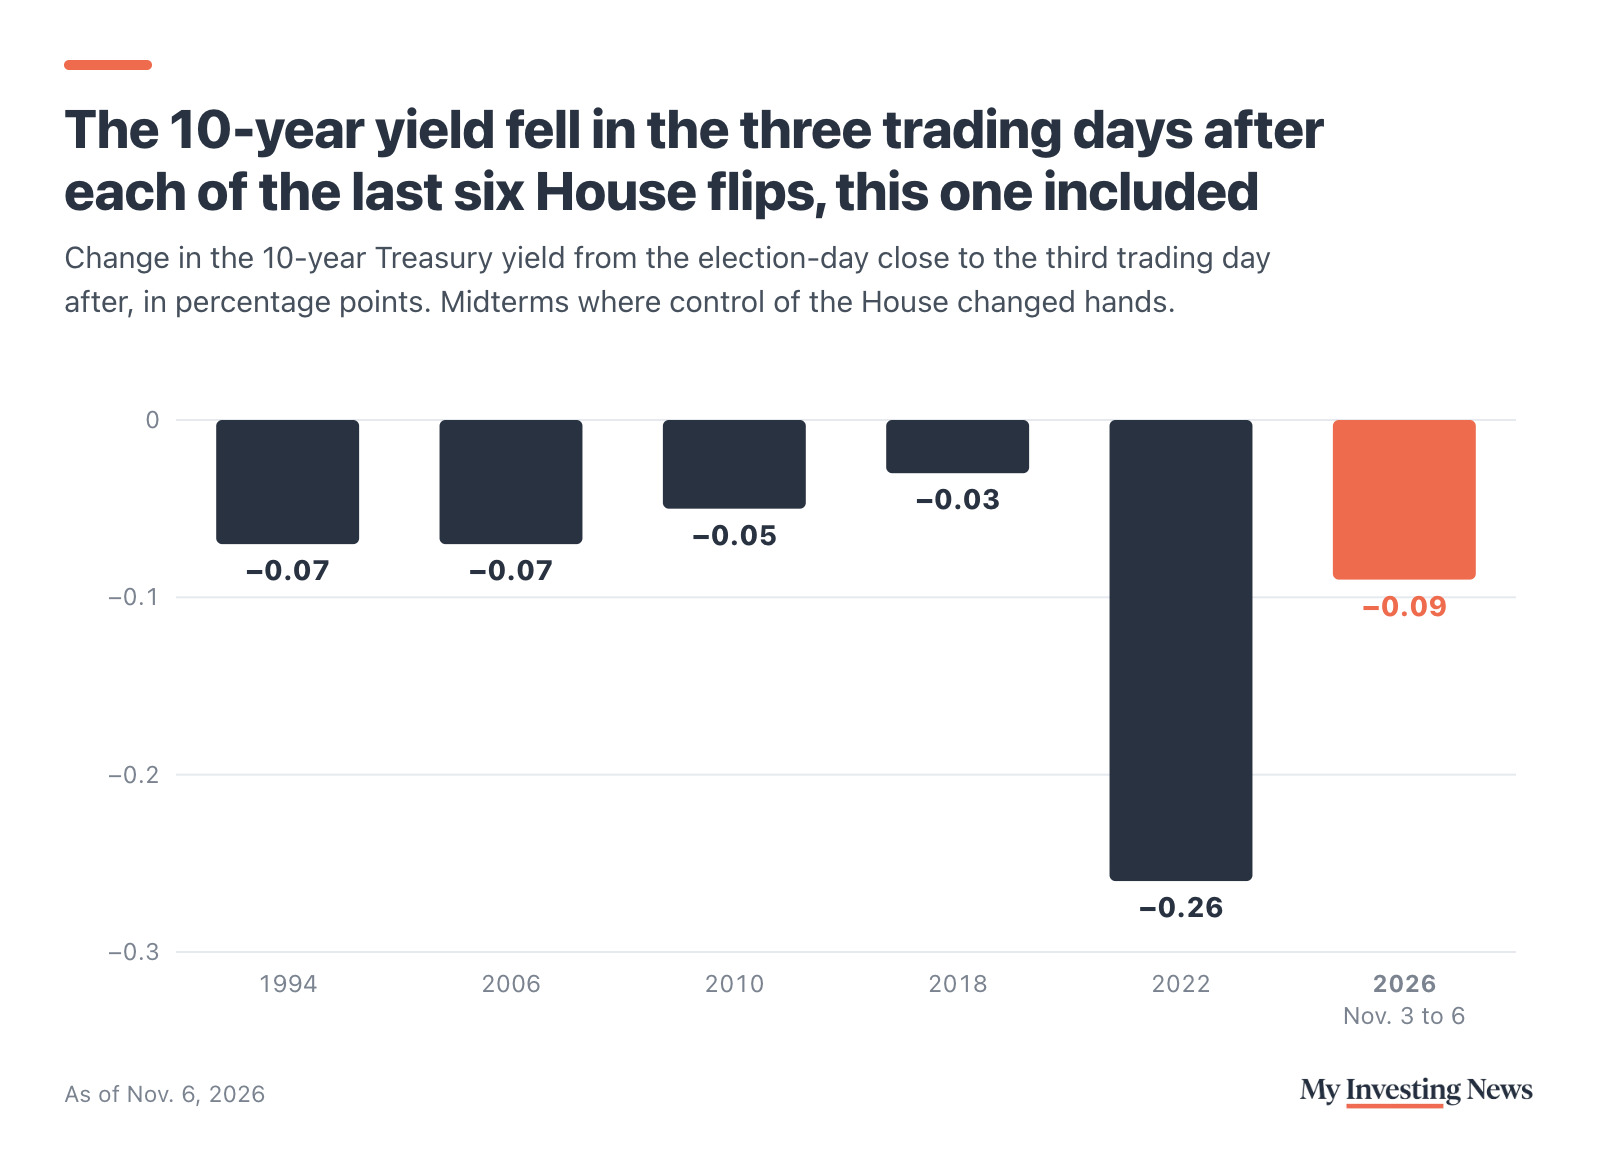
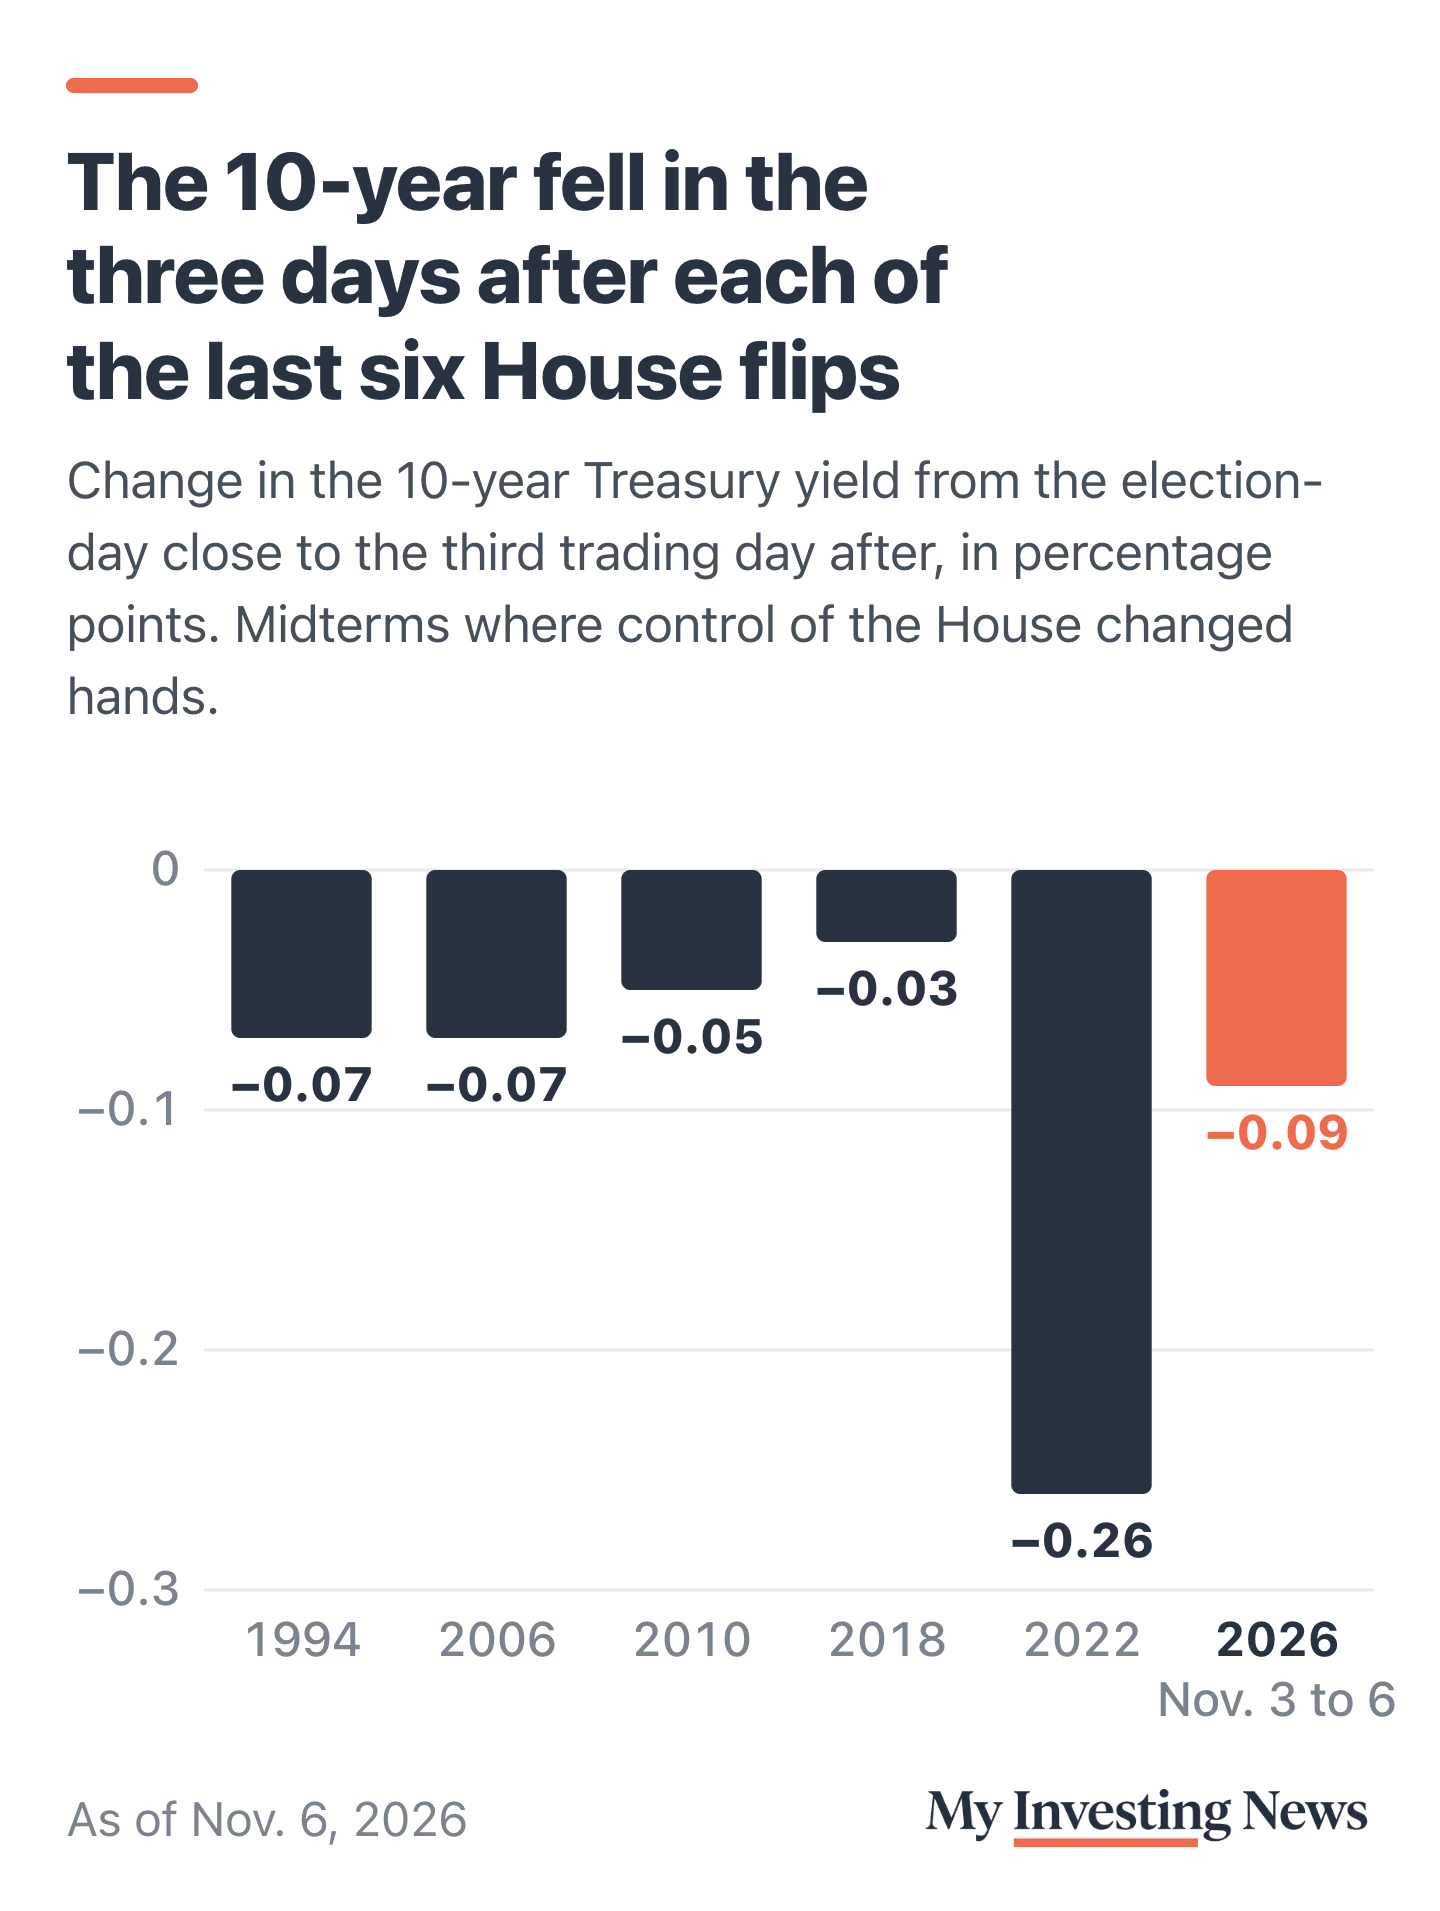
The market moved his way right after the vote. The 10-year Treasury yield closed at 4.95% on election day, Nov. 3, then slipped to 4.84% on Nov. 5, the day the S&P 500 fell 4.4%, and closed at 4.86% on Nov. 6. That is 0.09 point lower in three trading days, and well below its 5.31% peak on Oct. 5. The 10-year last closed at 5% or higher on Oct. 28.
Every Time the House Changed Hands
Sheets’ claim is about where yields go from here, so we checked what they did after every midterm since 1954, the first one the 10-year’s data covers. Using the House’s own party counts for each Congress, control of the chamber changed hands in six of those 18 elections: 1954, 1994, 2006, 2010, 2018 and 2022. This year makes seven.
The first few days look like this one. In the three trading days after each of the five flips with daily data, the 10-year fell, by 0.03 to 0.26 point. The largest drop, in 2022, came mostly on Nov. 10 of that year, the day a cooler inflation report was released. That pattern isn’t special to flips, though: yields also fell in the first three days after 7 of the 11 midterms where control held.
A Year Later, Yields Were Usually Lower
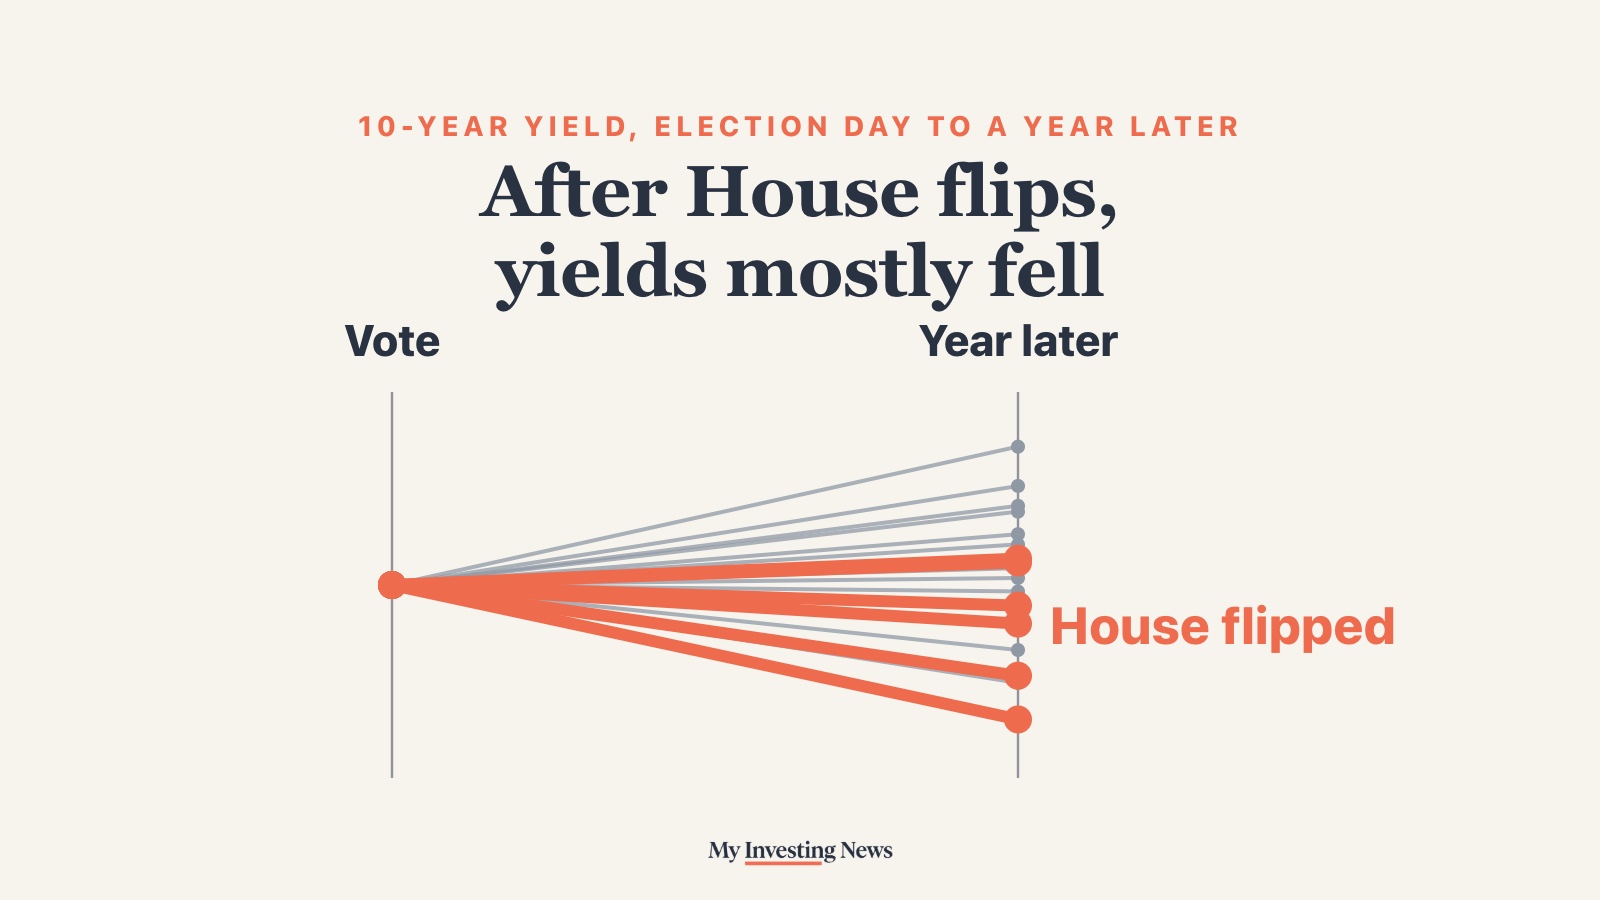
The longer view is where flips stand apart. A year after the vote, the 10-year was lower after 4 of the 6 House flips, with a median change of 0.46 point lower. After the 12 midterms where control held, it was lower only 3 times, and the median was about half a point higher.
The biggest drops came after 1994, when the 10-year went from 8.01% to 5.92%, and 2018, when it fell from 3.22% to 1.81%. The two exceptions were 1954, a small rise measured in monthly averages, and 2022, when the 10-year went from 4.14% to 4.49% after touching 4.98% in October 2023.
The 10-year Treasury yield and the House, since 1954
Why the Record Is Weaker Than It Looks
Six elections is a small sample, and timing does a lot of the work. Five of the six flips came after 1990, during a long bond rally. From October 1981 through 2020, the 10-year was lower a year later on 62% of all trading days, flip or no flip. From 1962 to 1981, when yields climbed, that share was 22%. Half of the 12 hold years in our count came in 1978 or earlier, while yields were climbing.
Compare like with like and the gap shrinks. Since 1990, the 10-year was lower a year later after 2 of the 4 midterms where control held, against four of five flips. Over three months, flips have no edge at all: yields were lower after 3 of 6 flips and 8 of 12 holds. The record fits Sheets’ view without proving it.
A year after the vote, the 10-year was lower after 4 of 6 House flips and 3 of 12 midterms where control held
10-year Treasury yield at the election-day close and one year later. Coral: the House changed hands. Gray: it didn’t. *1954 and 1958 use monthly averages.
What to Watch
Sheets also flagged a nearer-term catalyst unrelated to the vote: Morgan Stanley’s economists expect the next U.S. inflation number “is going to show a notable step down.” The October consumer price index is due Nov. 10. The other marker is the 5% line on the 10-year, which it held above as recently as Oct. 28.
For stocks, Sheets noted that the S&P 500 was higher a year after each of the last 11 midterms, from 1982 to 2022. Stocks have their own midterm record: higher a year later after all 19 midterms since 1950. UBS’s Evan Brown has argued that a yield near 5% pays investors to own bonds, and notes bought near 5% have made money over the next year about three times in four. Before the vote, Morgan Stanley’s Matthew Hornbach tied this year’s Treasury selloff to energy prices and the Fed.
Sheets says a vote against tariffs could help push long-term yields down. After past House flips, the 10-year was lower a year later 4 times in 6, against 3 in 12 when control held. Most flips came during a long bond rally, so the record leans his way but is thin, and the 10-year sat at 4.86% as of the Nov. 6 close.