Where we heard itMarketplace Morning Report, Nov. 9, 2026: Amy Scott, host of Marketplace’s How We Survive, with Kimberly Adams. The estimate she cited is the San Francisco Fed’s Economic Letter of Nov. 2, 2026, “The Impact of El Niño on the U.S. Economy.”
The El Niño now warming the Pacific is one of the strongest on record, and economists have started to put a price on it. On Marketplace Morning Report on Nov. 9, Amy Scott ran through the estimates: one study puts global damage near $1 trillion next year, and closer to home, the Federal Reserve Bank of San Francisco sees a hit to prices in 2027.
What the San Francisco Fed Actually Found
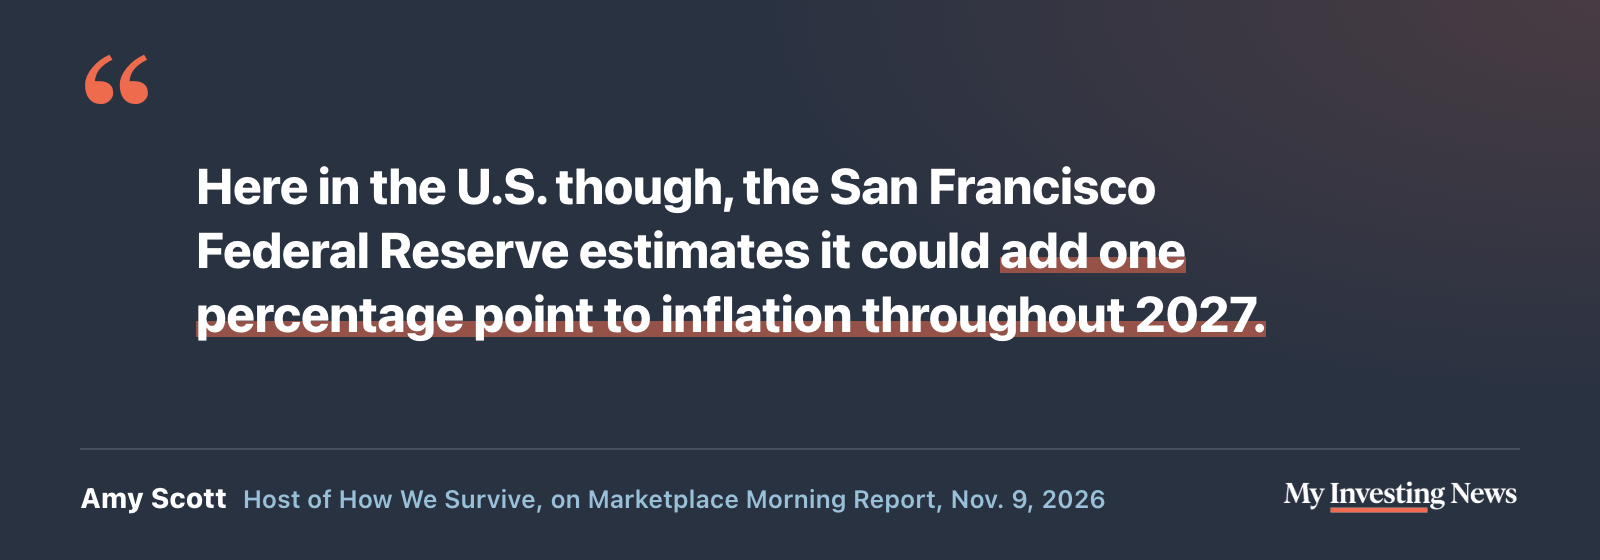
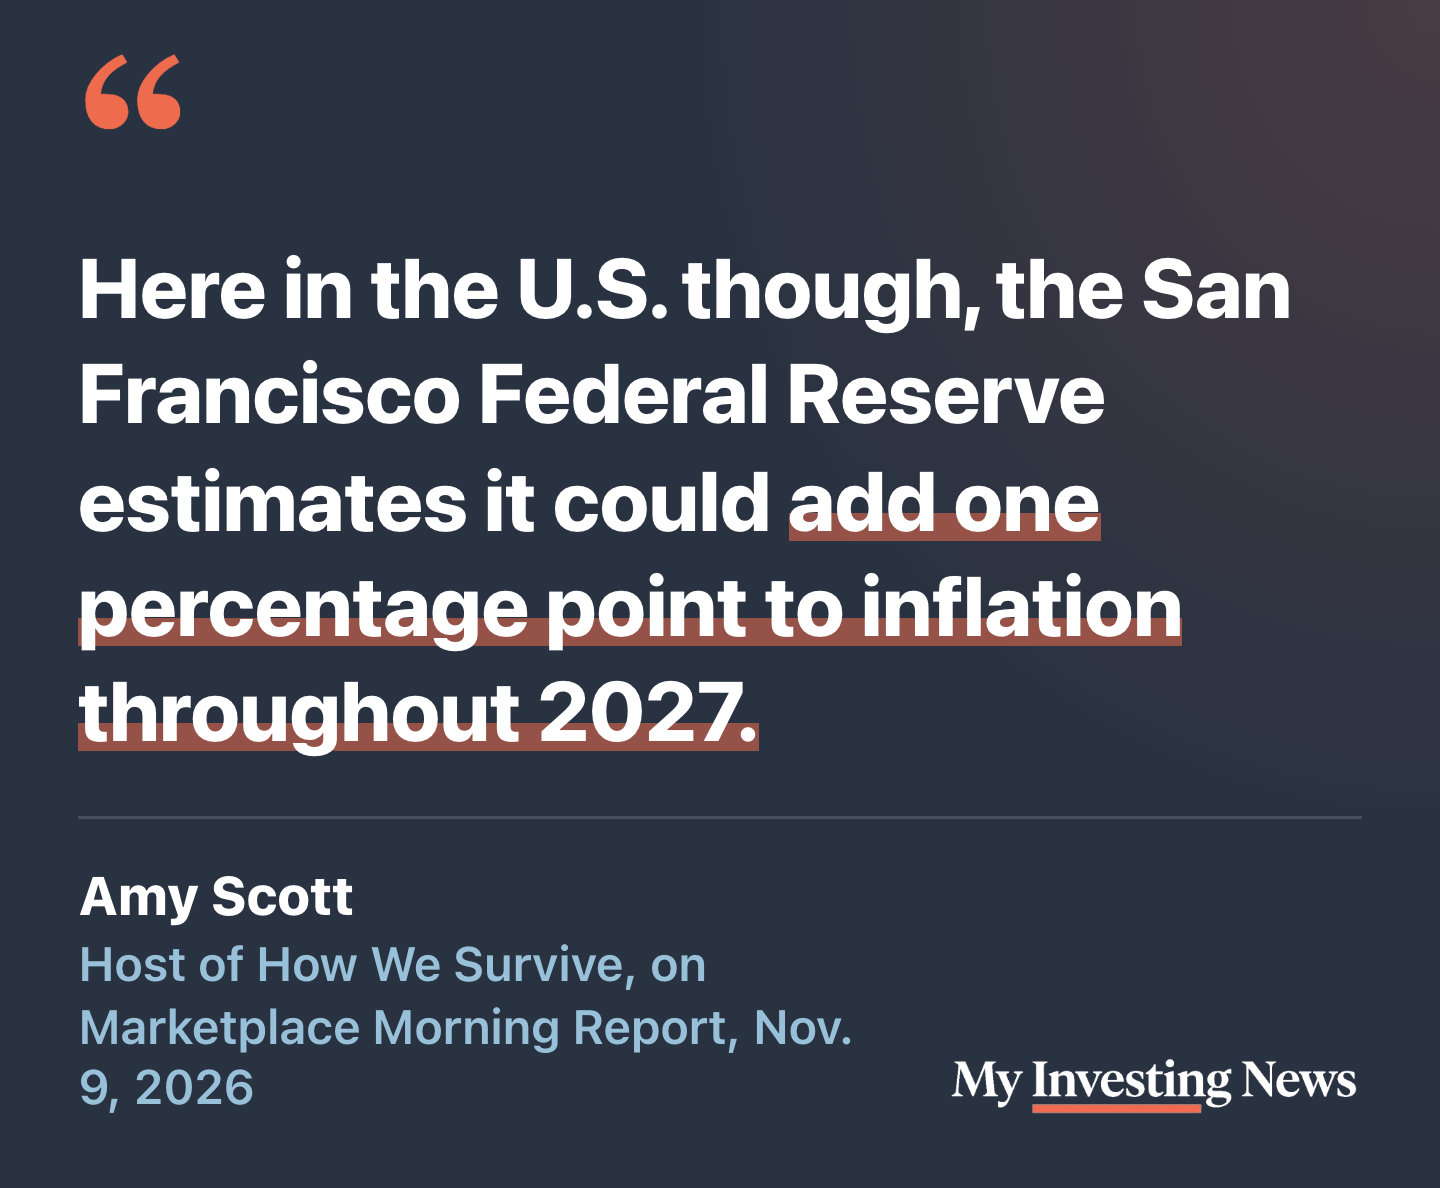
The Fed letter, by Molly Ardren, Tobin Graf and senior economist Brigitte Roth Tran, studied El Niño episodes back to the 1950s. It estimates the current one already added about 0.3 percentage point to prices, as measured by the personal consumption expenditures index, between April and July 2026, a bump it expects to fade by the end of this year. For 2027 the estimate is a 1 percentage point net increase in prices over the year, which the authors also describe as “as much as 1 percentage point.”
That number comes with a condition. The model counts on a La Niña, the cool phase that often follows a strong El Niño, arriving in 2027. “In the absence of a La Niña in 2027, the model expects no further net price effects in 2027,” the authors wrote. They call it a “meaningful risk” rather than a forecast, and say the price effects have come mostly from core services and food. They also flag two limits: their history holds only 22 El Niño events, four of them very strong, and this one is projected to be stronger than any of them.
The $1 trillion figure Scott cited comes from the Peterson Institute for International Economics. In a July 20 post, corrected Aug. 18, Cullen Hendrix estimated losses “on the order of $986 billion in 2027” if this El Niño matches the 1997 to 1998 event.
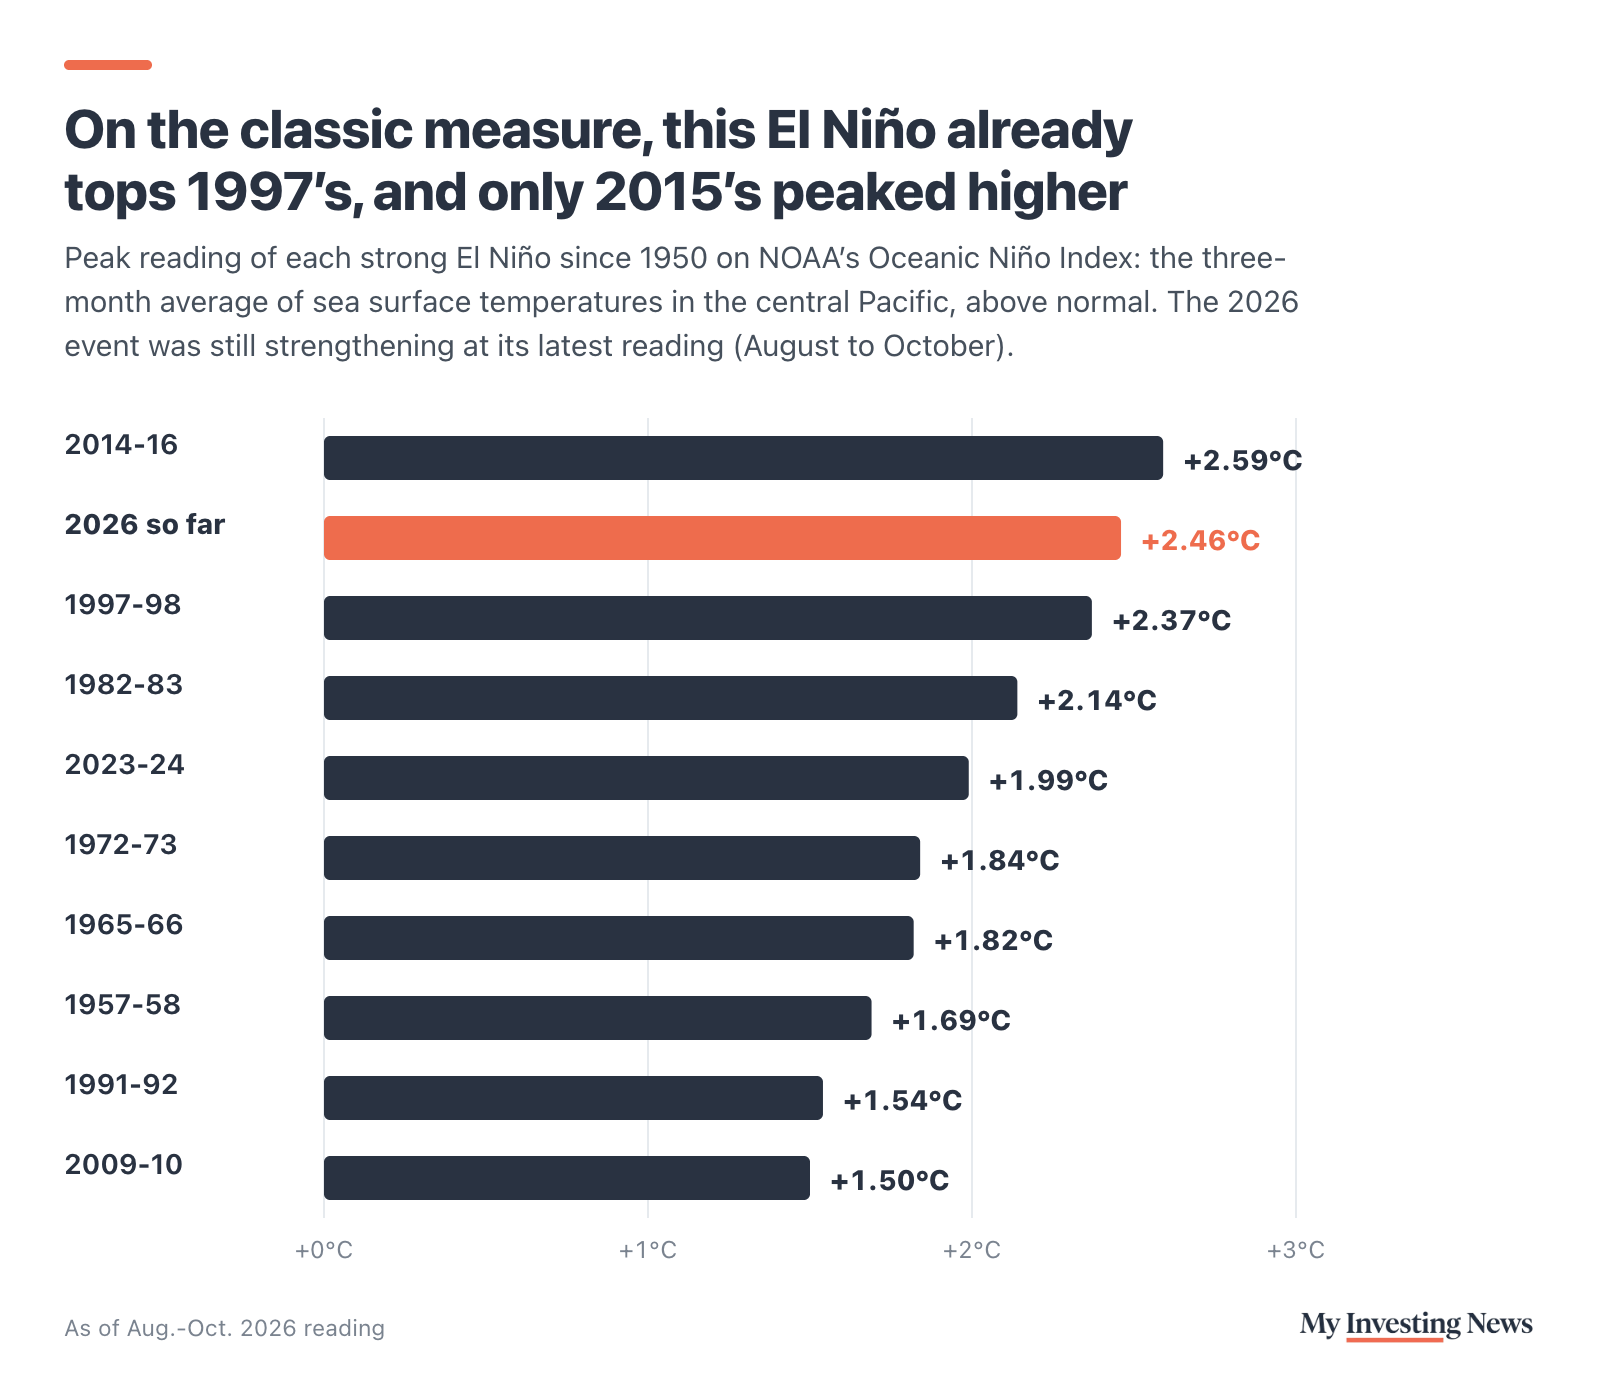
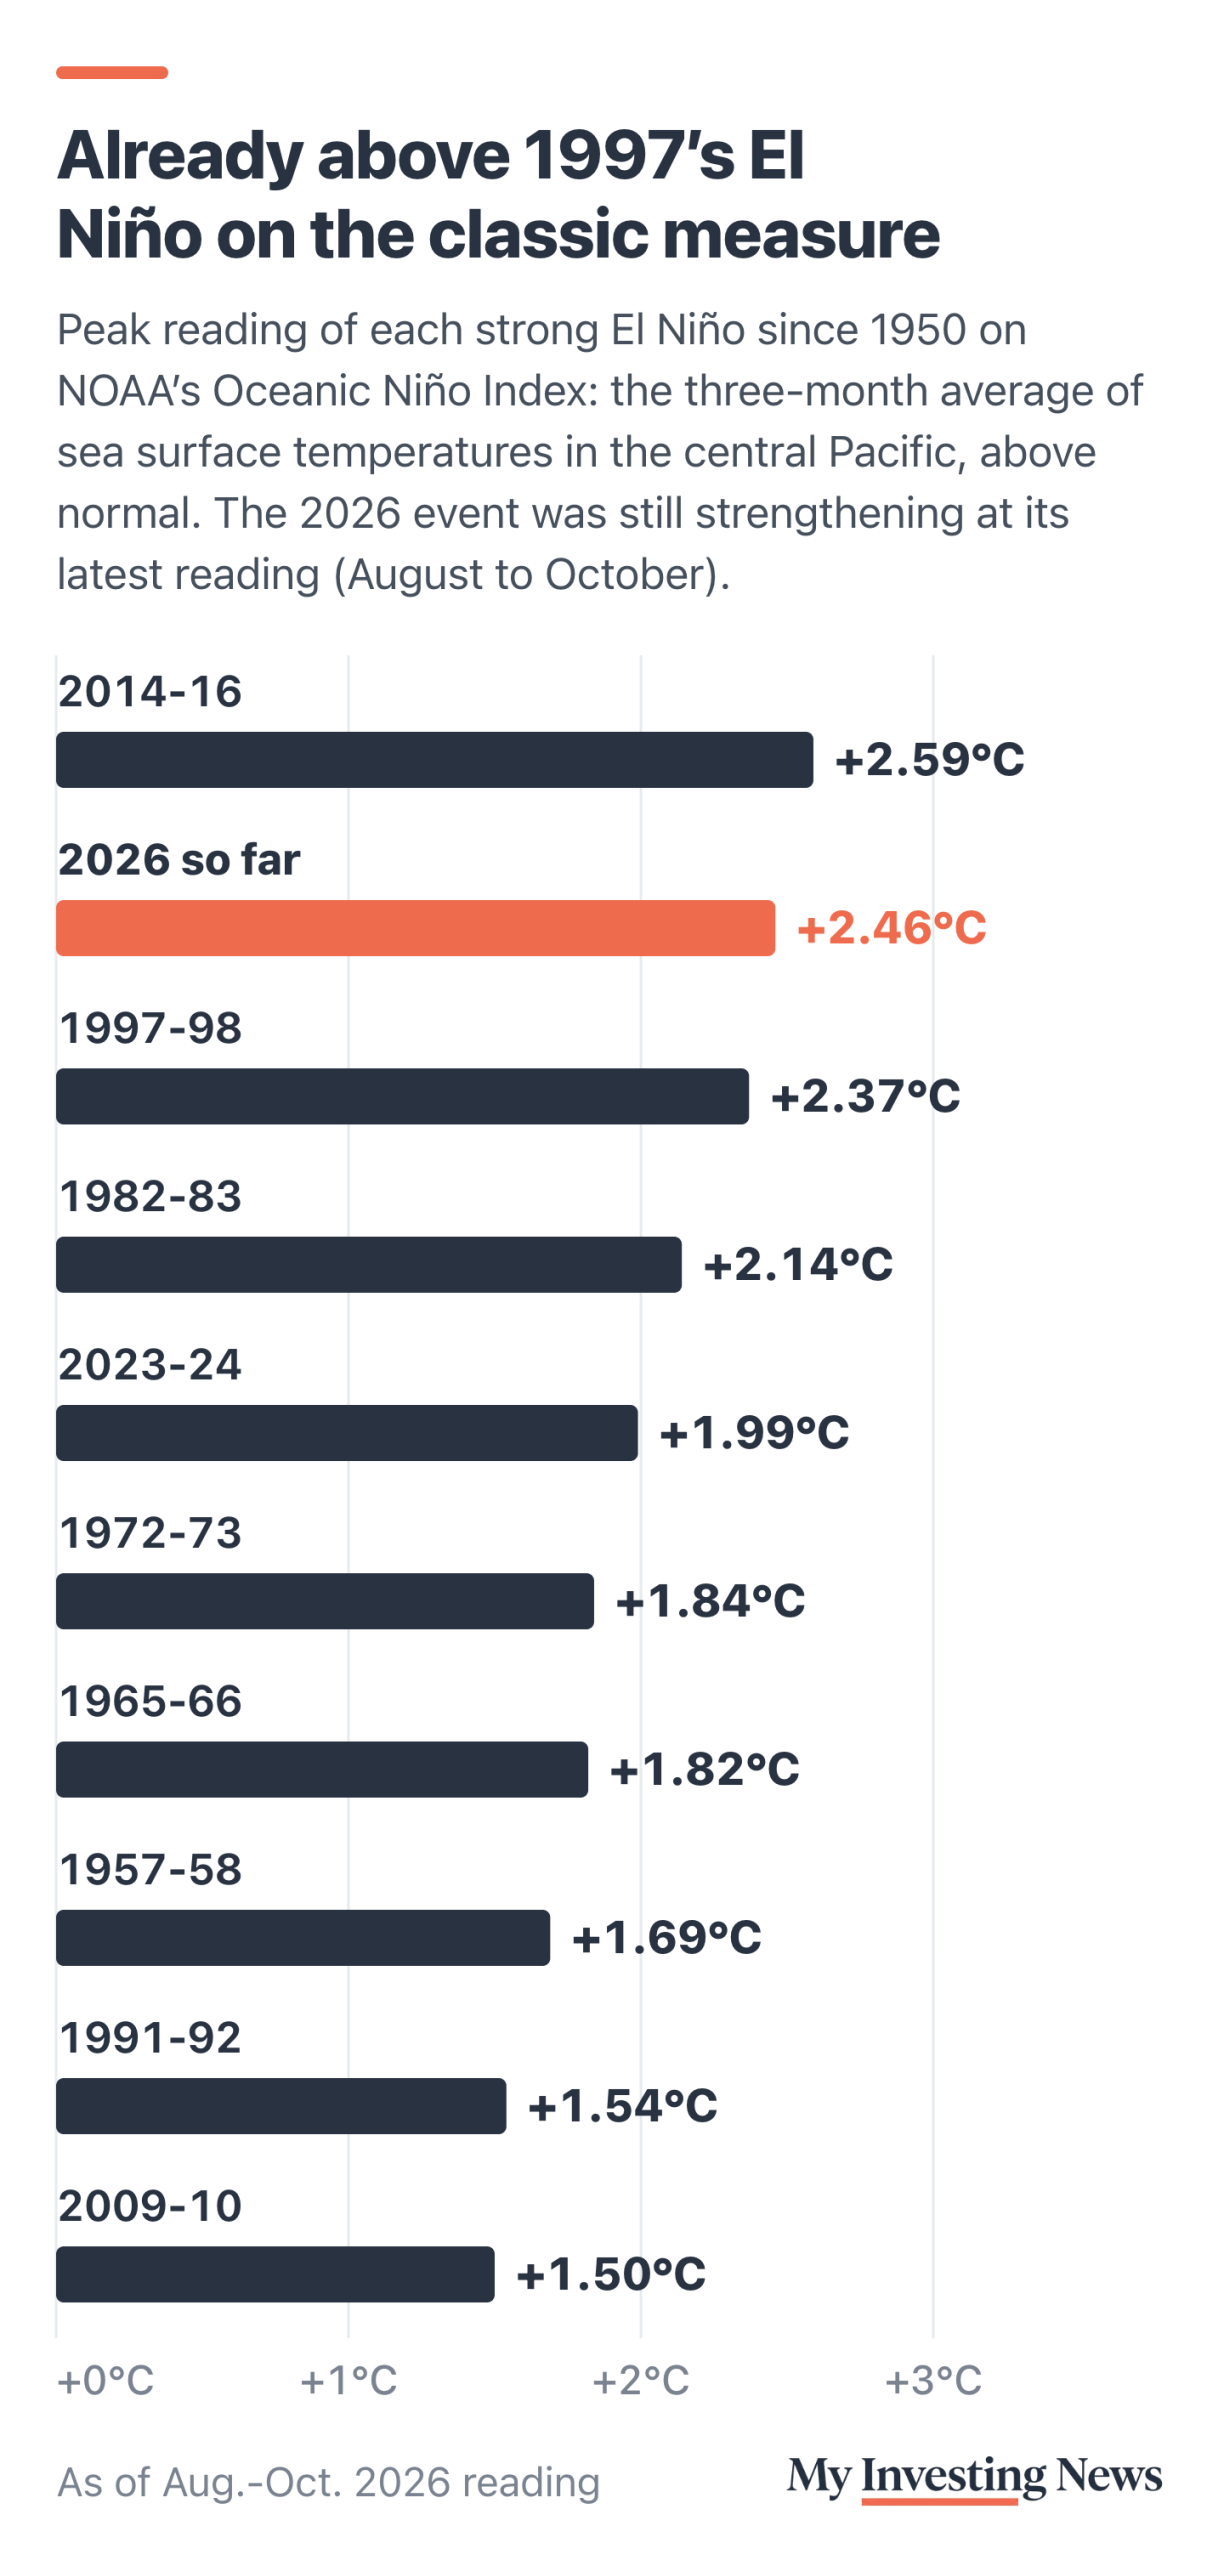
How strong is it? On NOAA’s Oceanic Niño Index, the long-running measure of how warm the central Pacific is running, the August-to-October reading was 2.46 degrees Celsius above normal. That is already above the 1997 peak of 2.37 and behind only the 2.59 reached in late 2015, in records back to 1950. NOAA now also ranks events on a relative version of the index that adjusts for the warming of the whole tropics. On that measure the reading was 1.97, and in its Oct. 8 update NOAA put the chance of a record, 2.5 or more, at 83% for October to December.
Grocery Prices After Past Strong El Niños
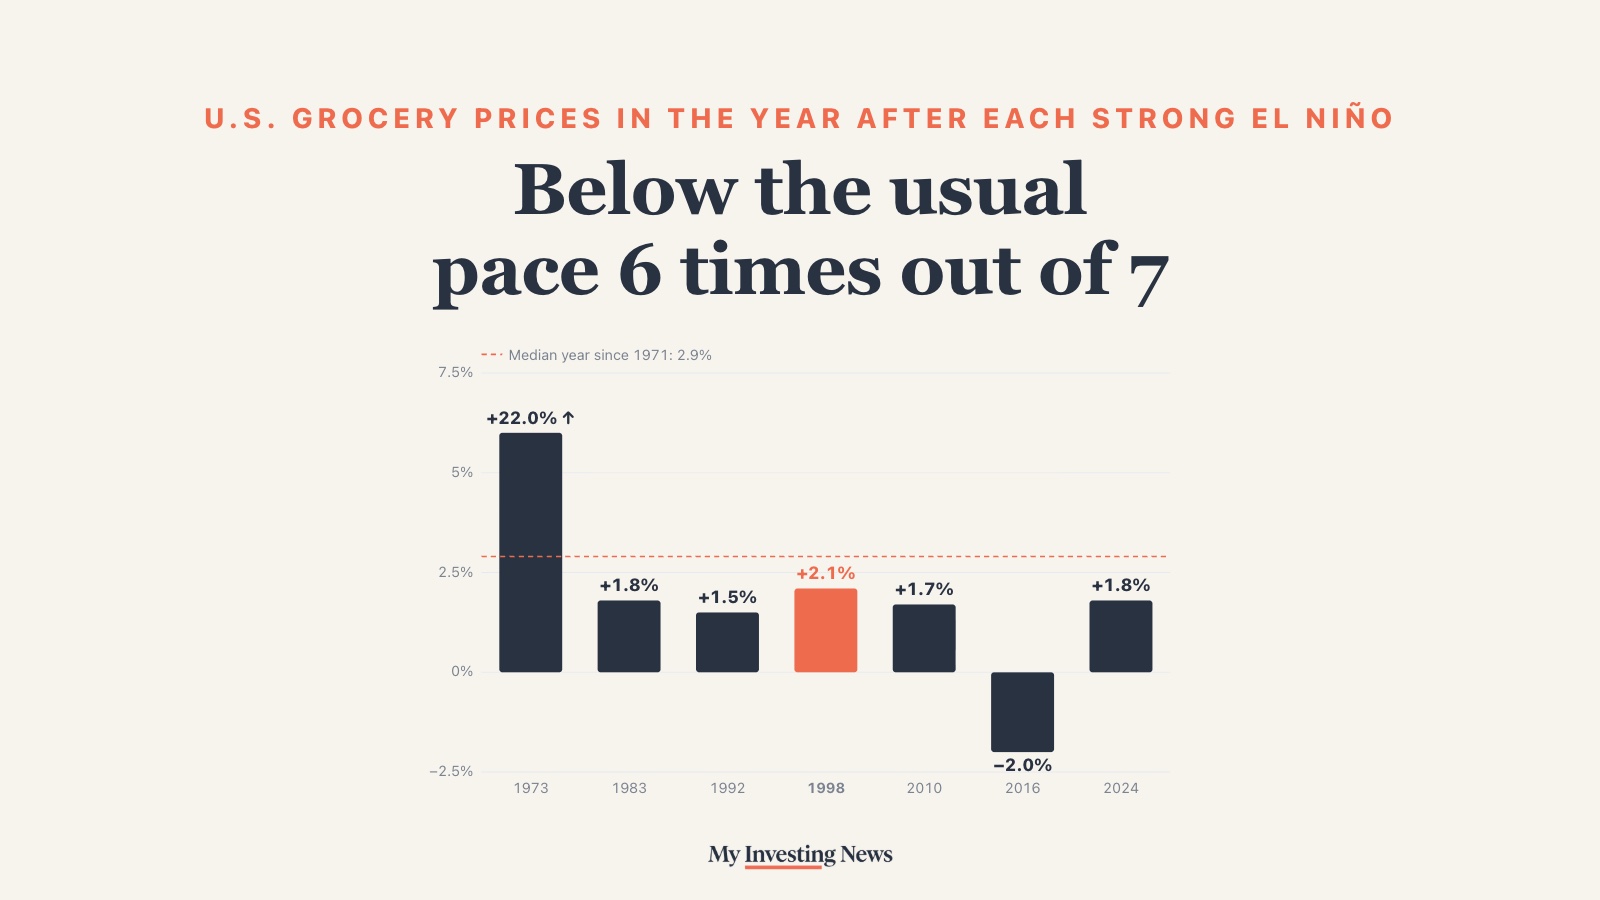
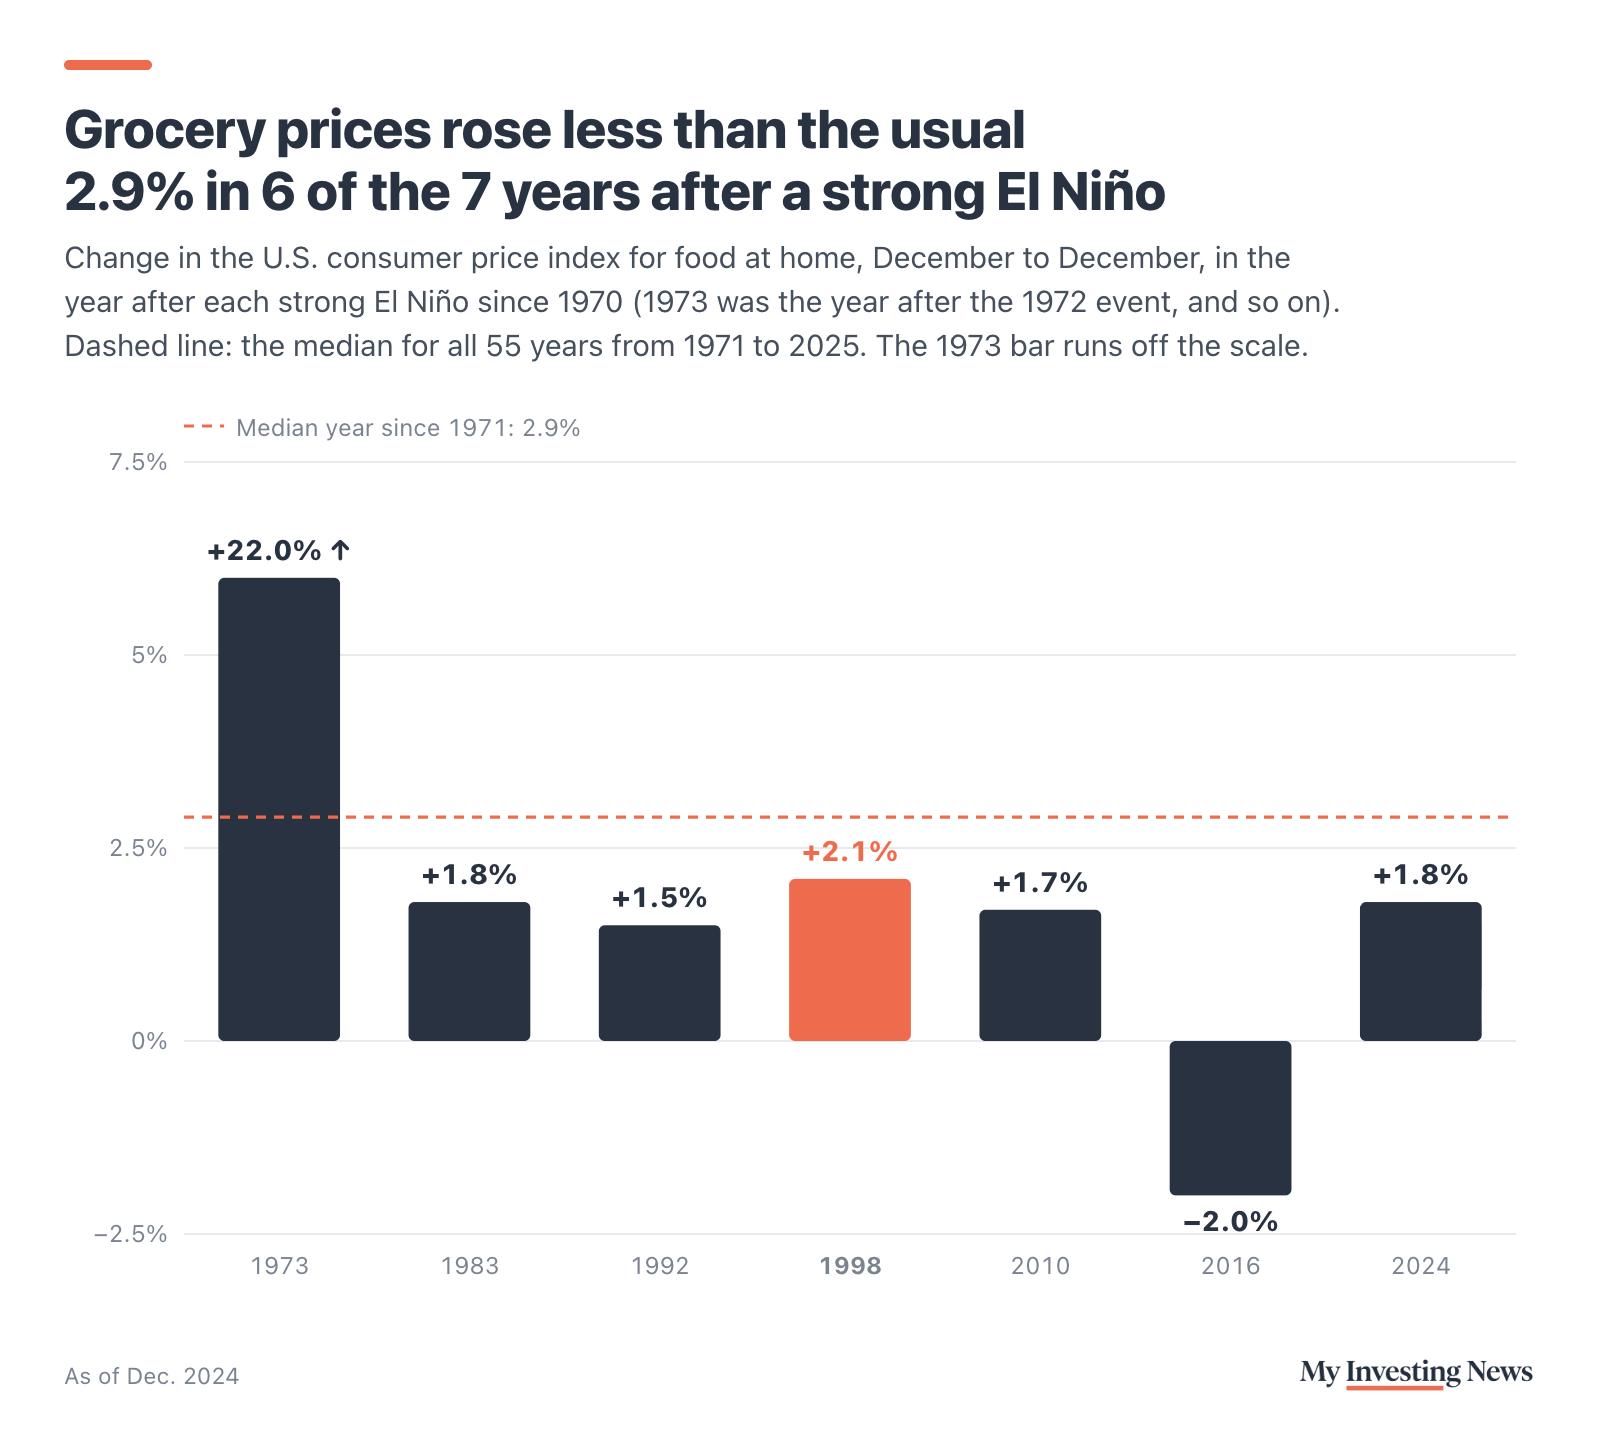
Food is the part of the story shoppers will notice first, so we checked the record. For each strong El Niño since 1970, we measured the change in the consumer price index for food at home, the government’s grocery price gauge, from December of the year the event began to the following December. Strong events usually peak in late fall or early winter, so that window matches the year the San Francisco Fed is worried about.
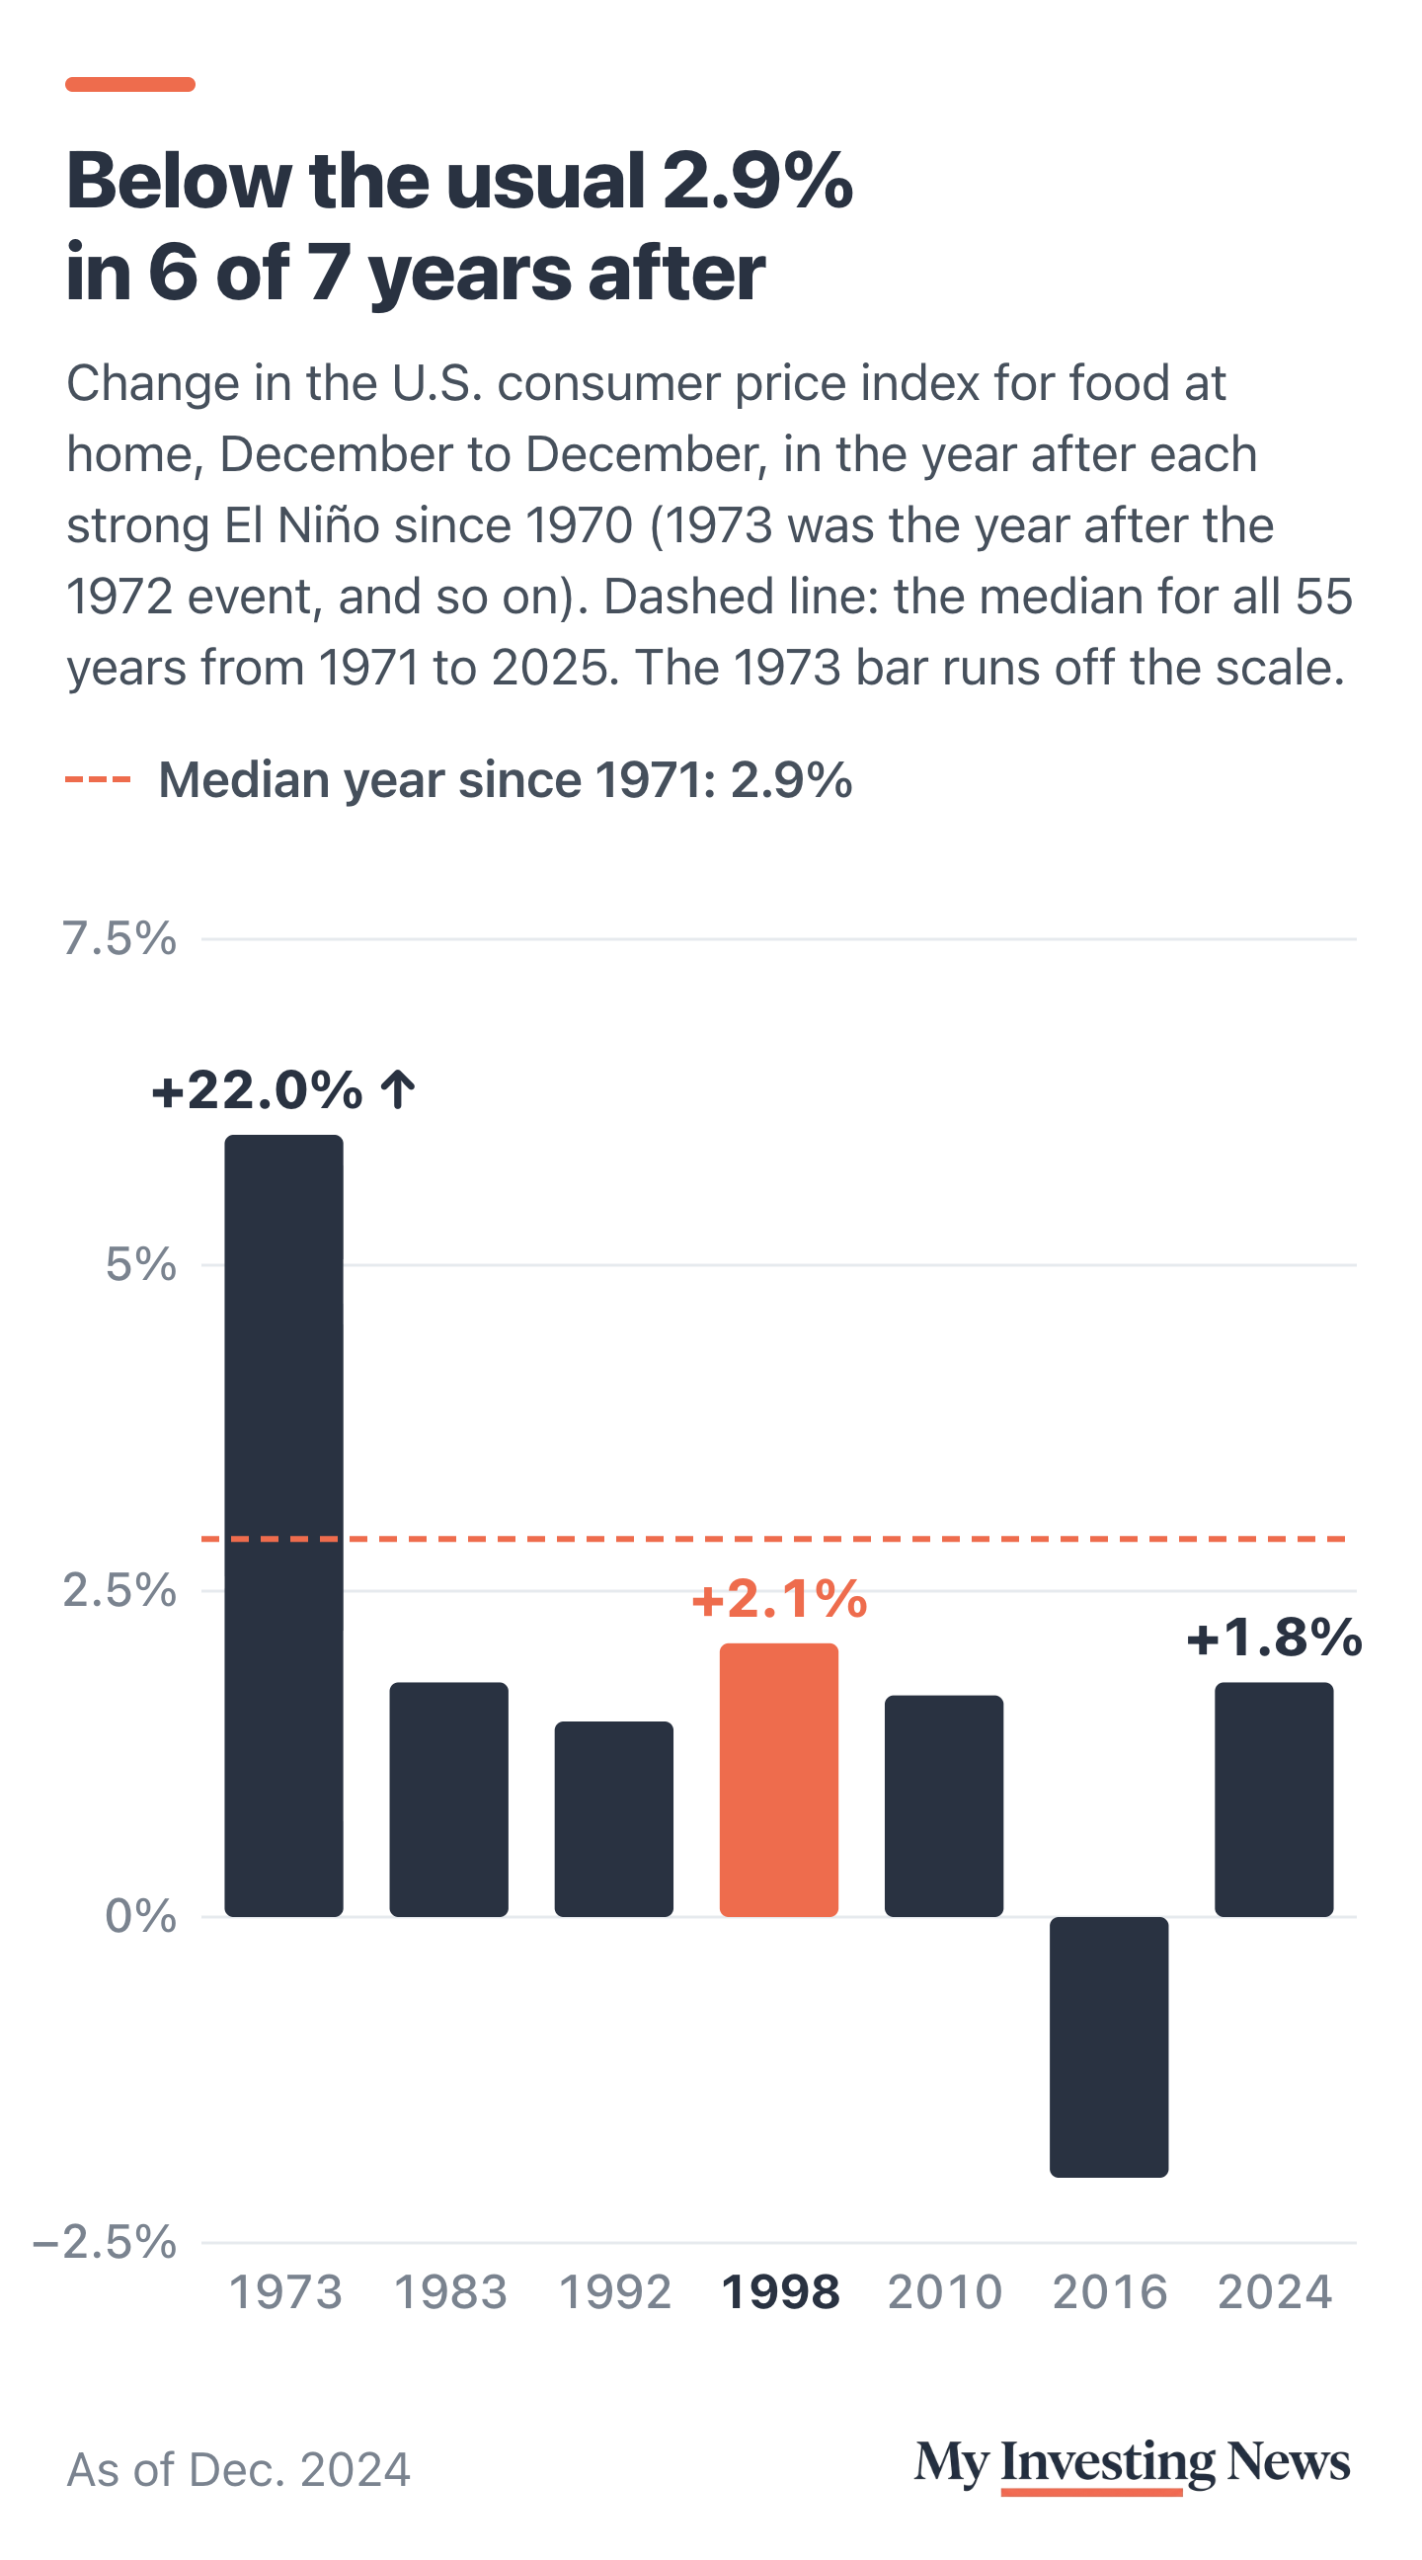
After the 1997 super El Niño, U.S. grocery prices rose 2.1% in 1998. That was below the 2.9% median for every year from 1971 to 2025, and so were five of the other six years after a strong event: 1.8% in 1983, 1.5% in 1992, 1.7% in 2010 and 1.8% in 2024. In 2016, after the 2015 event, the strongest on the classic index, grocery prices fell 2.0%.
El Niño and food prices, as of Nov. 10, 2026
The exception was 1973, when grocery prices jumped 22%. El Niño was one cause among several that year: the World Bank’s index of world food prices rose 69% from December 1972 to December 1973, in a year of broad commodity inflation. There is a smaller pattern worth noting. In 5 of the 7 cases, grocery inflation ran faster in the year after than in the year the event began, which fits the Fed’s finding that the effect shows up late. It just hasn’t been large in U.S. grocery bills.
Where the Pressure Shows Up Instead
World prices for single crops swing far more than the grocery index. Palm oil, grown mostly in Southeast Asia, rose in the year after all seven strong events since 1970, by the World Bank’s monthly prices. Cocoa rose after only three of them. Right now the pressure is uneven: in October, world sugar prices were up 26% from a year earlier and Thai rice 37%, while arabica coffee was down 17% and cocoa 3%. Crop prices reach shelves slowly and unevenly: cocoa is far below its 2024 high, yet Halloween candy still cost more this year.
The FAO Food Price Index, the United Nations’ gauge of world food commodity prices, was 133.9 in October, up 5.9% from a year earlier and 16.4% below its March 2022 peak. At home, grocery prices rose 1.8% in the year to September, about half the 3.7% rise in all prices. They rose 0.4% in October from September, seasonally adjusted, in a report with no year-ago number to compare, because October 2025 prices were never collected during the government shutdown.
What to Watch
The San Francisco Fed’s estimate turns on what comes after this El Niño, so the forecast that matters is NOAA’s outlook for 2027. NOAA’s Climate Prediction Center updates its El Niño discussion on the second Thursday of each month, and a growing chance of La Niña next year would raise the odds of the Fed’s price bump. Monthly CPI reports will show whether food at home starts to run faster than its recent pace. For the Fed itself, an El Niño risk on top of the hot core readings that have some officials talking about rate hikes adds one more risk to the 2027 inflation outlook.
The San Francisco Fed sees as much as 1 percentage point of extra inflation in 2027 from this El Niño, but only if a La Niña follows, and with a small sample behind it. The grocery record is calmer: after six of the seven strong El Niños since 1970, U.S. food-at-home prices rose less than the usual 2.9% the next year, including 2.1% in 1998. The risk is that this event is stronger than any in that record.